 🏷️ Likely Rental
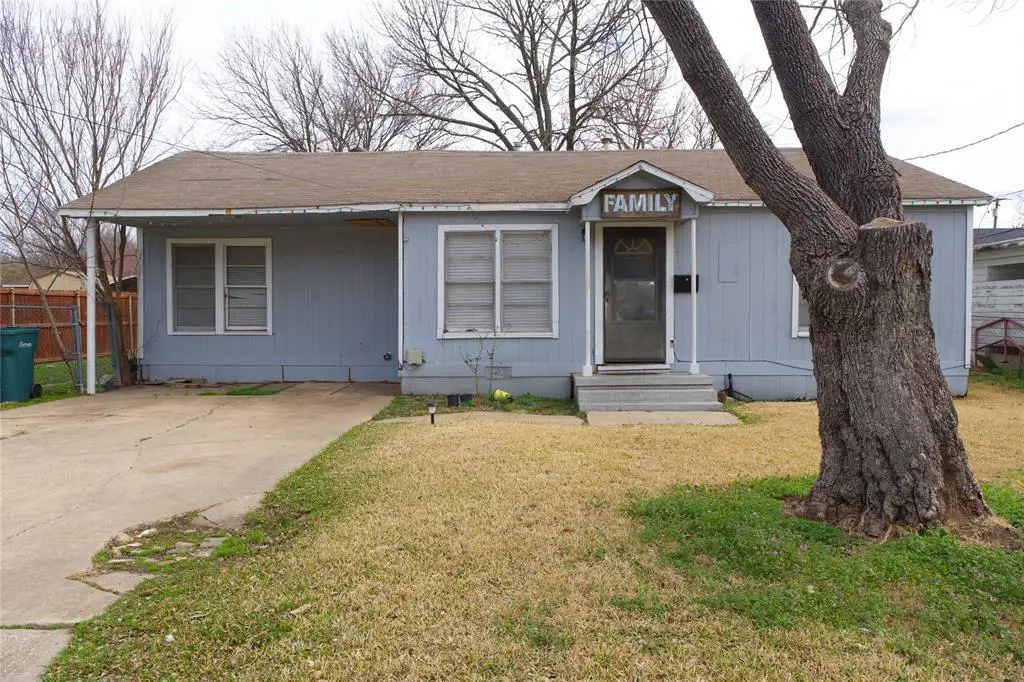
1429 S Elm · Sherman, TX
Flood risk 1/10 · Minimal
- FEMA flood zone
- X (unshaded)
- Chance of flooding over 30 yrs
- 0.0%
- Est. flood insurance / yr
- $507 – $1,088
Fire risk 6/10 · Moderate
- Est. fire insurance / yr
- $1,222 – $2,270
Heat risk 6/10 · Moderate
- Hot days now (above 108°F)
- 7 days/yr
- Hot days in 30 yrs
- 22 days/yr
Wind risk 4/10 · Minor
- Chance of severe wind over 30 yrs
- 22.0%
Air-quality risk 3/10 · Minor
- Unhealthy air days now
- 2 days/yr
- Unhealthy air days in 30 yrs
- 3 days/yr
Risk factors via First Street. Map © Google.
Why this score? — see what drove the C+ grade
The composite is a weighted blend of 9 inputs, each scored 0–100. Each bar is that input's sub-score; the figure is the points it added to the 100-point composite (weight × sub-score).
- Cash flow +23.7/30.0
- ARV discount +15.0/15.0
- DSCR +7.6/10.0
- 1% rule +6.5/10.0
- Livability +3.1/5.0
- Schools +2.9/10.0
- Condition / age +2.5/5.0
- Rent growth +1.8/5.0
- Appreciation +0.0/10.0
$129,900
🖨 Deal sheet 📄 Offer letter ✓ Due diligence
Listing remarks MLS
Investment opportunity in Sherman, Texas. This 3-bedroom, 2-bath home located at 1429 S Elm St is currently tenant-occupied with renters paying $1,300 per month, providing immediate rental income for investors. Conveniently located in Sherman with easy access to shopping, dining, schools, and major highways. Sherman continues to experience strong growth and economic development, bringing new opportunities and making the area an increasingly attractive place to live and invest. Whether you're looking to expand your rental portfolio or secure a property in one of North Texas’ growing communities, this property offers solid investment potential. The seller is offering to replace the roof before closing with an acceptable offer. Seller is also selling 625 Main in Denison with the mls number 21200427 AND the duplex at 1422 E Lamar. Feel free to make an offer for all three!
Key facts
- Tenant occupied
- 5,750 sq ft lot
- Built 1940
Tags
Neighborhood map
What this means for you Summary
Snapshot
- This is a 3-bed/2.0-bath single-family listed at $130k.
Deal economics
- At list price, monthly cash flow is $248 ($3k/yr) — positive.
- The deal already cash-flows at list — no discount required.
- Meets the 1% rule at list price ($1k rent vs $130k).
- Recommended offer: $118k (9.0% below list) — sets the bar for market timing.
- Cap rate 8.6% vs local median 3.7% in Sherman — top-decile yield for the area; either an underpriced asset or a hidden risk that comps aren't pricing in. Stress-test before assuming the spread holds.
Location & tenants
- Location reads 61/100 on livability (#1,027 in TX) — a middle-class / working-renter tenant base. Strengths: cost of living A+, housing A+; Watch: crime C-, employment C-, schools D-.
- Sherman ISD (urban): math 31% / reading 37% proficiency, ranked #546 of 826 in TX (top 66%) — families likely to look elsewhere, expect single-tenant / working-renter base with shorter leases.
- Market conditions: Rents soft (-2.7%/yr); 473 active listings in the ZIP; 40 comparable units currently listed for rent nearby; rentals lingering (median 44d on market — plan ~5-8 weeks vacancy on turnover, expect pricing pressure); 78% of comp listings sitting > 30 days — soft ceiling on asking rent; 2,272 units permitted in Grayson County in 2024 (750 in 5+ unit buildings).
- This rent runs 32% of the median local income ($56k/yr) — at the standard rent-burdened threshold; future hikes will face affordability resistance.
Forward outlook
- Local home prices are declining (-3.0%/yr); year-one equity from $898 of loan paydown is wiped out by about $4k of value loss. Plan a longer hold.
- Grayson County population projected at +12% by 2050 — modest demand growth; plan on rents tracking national, not racing it.
Negotiation context
- It's been on market 102 days — a 9% lower offer ($118k) is reasonable based on typical stale-listing flexibility.
- 2 sale attempts since 10y ago with the ask held roughly flat each time — persistent listings suggest the price (not the market) is what's stuck; bring a comps-based counter.
Risks & watch-outs
- Watch-outs: built in 1940 — expect roof / HVAC / electrical / plumbing capex.
- Climate carrying-cost: major wildfire risk; extreme-heat days projected 7→22/yr by 2055 (HVAC capex compounding) — expect insurance premiums to compound above CPI over the hold.
Questions for the listing agent
- It's been on market 102 days. Have you received any prior offers? Is the seller open to a 9% concession, seller financing, or rate buy-down credit?
- Built in 1940 — when were the roof, HVAC, electrical panel, plumbing, and water heater last replaced?
- Why hasn't it sold? Are there any deal-killer items the seller is aware of (foundation, flood, title, zoning, code violations)?
- Is there a deadline driving the sale (1031 exchange, divorce, estate, relocation)? That informs how much negotiation room exists.
- Schools are D-rated, which usually means shorter tenancies and higher turnover. Who's the typical renter profile here, and what's been the actual vacancy rate?
- What's the average days-on-market for RENTAL listings here right now (not sales)? A rising rental-DOM trend means longer vacancies and softer asking-rent achievability than the comps imply.
- What's the recent tenant-quality profile in this submarket — average credit score on applications, eviction rate, late-payment / NSF rate, and stable-employment percentage? A property-management company in the area should have these aggregated.
- How much new for-sale + rental construction is in the pipeline within 1–3 miles? Heavy new supply typically softens prices + rents 12–24 months out; constrained supply supports both.
Investment metrics
- 1% rule
- 1.15% ✓
- Cap rate
- 8.59%
- Cash-on-cash
- 8.19%
- DSCR
- 1.36
- GRM
- 7.2
CMA / ARV
- ARV (median comp)
- $199,592
- List price
- $129,900
- Delta
- -34.92%
- Verdict
- UNDERPRICED
- Comps
- 20 within 1.0 mi
Show comp detail 12 sales within ~0.75 mi
| Address | Dist | Beds/Ba | Sqft | Sold | Price | $/sf | Match |
|---|---|---|---|---|---|---|---|
| 1710 S Walnut St | 0.28mi | 2/2.0 (-1) | 1,007 (-7%) | 10mo | $199,900 | $199 | 61 |
| 1505 S Austin St | 0.16mi | 2/1.0 (-1) | 1,214 (+12%) | 10mo | $80,000 | $66 | 56 |
| 517 Regiment Rd | 0.69mi | 2/2.0 (-1) | 1,123 (+3%) | 4mo | $236,990 | $211 | 54 |
| 2413 Anson Dr | 0.69mi | 2/2.0 (-1) | 1,123 (+3%) | 5mo | $224,490 | $200 | 53 |
| 418 Regiment Rd | 0.69mi | 2/2.0 (-1) | 1,123 (+3%) | 5mo | $227,990 | $203 | 53 |
| 110 W Moore St | 0.51mi | 2/2.0 (-1) | 1,028 (-6%) | 10mo | $165,000 | $161 | 53 |
| 2401 Anson Dr | 0.69mi | 2/2.0 (-1) | 1,123 (+3%) | 5mo | $222,990 | $199 | 53 |
| 718 E Martin Ln | 0.66mi | 3/1.5 | 997 (-8%) | 4mo | $167,000 | $168 | 50 |
| 713 S Austin St | 0.67mi | 3/1.0 | 980 (-10%) | 7mo | $99,900 | $102 | 42 |
| 1016 S 1st St | 0.66mi | 2/2.0 (-1) | 946 (-13%) | 1mo | $206,000 | $218 | 41 |
| 625 S Rusk St | 0.69mi | 2/1.0 (-1) | 988 (-9%) | 3mo | $125,000 | $127 | 41 |
| 423 E Sherman St | 0.63mi | 2/1.0 (-1) | 960 (-12%) | 6mo | $163,000 | $170 | 37 |
Match score weights: distance 35% · size 25% · config 20% · recency 20%. Top-matched comps best support the ARV.
Projected returns pro-forma
-3.0% appreciation · 0.0% rent growth · sell at horizon
- IRR
- -7.4%
- Equity multiple
- 0.74×
- Total profit
- $-9,589
- Equity at exit
- $19,369
- IRR
- -2.3%
- Equity multiple
- 0.87×
- Total profit
- $-4,789
- Equity at exit
- $11,231
Cash invested: $36,372 (down + closing). Projections, not guarantees.
Landlord ↔ Tenant lean methodology
- Overall (STATE)
- 87 Strongly Landlord-Friendly
- State Texas
- 87 Strongly Landlord-Friendly · R+5
- County
- — inherits STATE
- City
- — inherits STATE
ZIP-level market 75090
- Home prices YoY
- -20.0%
- Rents YoY
- -2.7%
- Active inventory
- 473
- Price-to-rent
- 7.2×
Monthly cashflow live
- Estimated rent
- $1,499 high interval (Pro) →
- Mortgage (P&I)
- −$681
- Tax from tax record
- −$201 /mo · $2,412/yr
- Insurance
- −$54
- HOA
- −$0
- Vacancy / Maint / Mgmt
- −$315
- Net cashflow
- $248
Break-even live
UW: 25.0% down · 7.5% · 30yr · 1.5% tax · 5.0% vac · 8.0% maint · 8.0% mgmt
Financing live
Cash to close
- Down payment
- $32,475
- Closing costs
- $3,897
- Reserves months
- —
- Total cash needed
- —
Loan-product check · same deal, 3 products live
Conventional
25% down · 7.5% · 30yr
- Down + closing
- —
- Monthly P&I
- —
- Monthly cashflow
- —
- DSCR
- —
- Eligible?
- —
Personal DTI + credit; lowest rate.
DSCR
20% down · 8.5% · 30yr
- Down + closing
- —
- Monthly P&I
- —
- Monthly cashflow
- —
- DSCR
- —
- Eligible?
- —
No personal income docs; deal must DSCR.
Hard money
10% down · 12.0% · 12mo
- Down + closing
- —
- Monthly P&I
- —
- Monthly cashflow
- —
- DSCR
- —
- Eligible?
- —
Short-term bridge; refi at stabilization.
Rent comps 40 comps
| Address | Beds | Baths | Sqft | Rent | $/sqft | DOM | Units | Dist |
|---|---|---|---|---|---|---|---|---|
| 1434 S Rusk St Unit A Sherman, TX | 2.0 | 1.0 | 800 | $1,200 | $1.50 | 44d | 1 | 0.11mi |
| 1415 S Austin St Sherman, TX | 3.0 | 1.0 | 1027 | $1,180 | $1.15 | 21d | 1 | 0.16mi |
| 232 W Lake Ave Sherman, TX | 3.0 | 2.5 | 1244 | $1,425 | $1.15 | 44d | 1 | 0.21mi |
| 232 W Lake Ave Sherman, TX | 3.0 | 2.5 | 1244 | $1,395 | $1.12 | 44d | 1 | 0.21mi |
| 218 W Lake St Sherman, TX | 3.0 | 2.5 | 1244 | $1,495 | $1.20 | 21d | 1 | 0.21mi |
| 417 W Dulin St Unit 417 Sherman, TX | 3.0 | 2.0 | 1386 | $1,850 | $1.33 | 44d | 1 | 0.23mi |
| 419 W Dulin St Unit 419 Sherman, TX | 3.0 | 2.0 | 1386 | $1,850 | $1.33 | 44d | 1 | 0.23mi |
| 1219 S Austin St Unit 1219 Sherman, TX | 2.0 | 2.0 | 1297 | $1,650 | $1.27 | 44d | 1 | 0.23mi |
| 1223 S Austin St Unit 1223 Sherman, TX | 2.0 | 2.0 | 1297 | $1,650 | $1.27 | 44d | 1 | 0.24mi |
| 243 W Forest Ave Sherman, TX | 3.0 | 2.5 | 1244 | $1,400 | $1.13 | 44d | 1 | 0.24mi |
| 1710 S Travis St Sherman, TX | 2.0 | 1.5 | 1200 | $1,200 | $1.00 | 44d | 1 | 0.26mi |
| 1402 S Montgomery St Sherman, TX | 3.0 | 2.0 | 1160 | $1,399 | $1.21 | 44d | 1 | 0.27mi |
| 208 E Lake Ave Sherman, TX | 3.0 | 2.5 | 1238 | $1,445 | $1.17 | 44d | 1 | 0.30mi |
| 224 E Lake St Sherman, TX | 2.0 | 1.0 | 889 | $1,125 | $1.27 | 44d | 1 | 0.34mi |
| 224 E Lake St Unit 224 Sherman, TX | 2.0 | 1.0 | 889 | $1,125 | $1.27 | 44d | 1 | 0.34mi |
| 2017 S Branch St Sherman, TX | 3.0 | 2.0 | 1341 | $1,700 | $1.27 | 44d | 1 | 0.58mi |
| 600 E Rosedale St Sherman, TX | 2.0 | 1.0 | 925 | $995 | $1.08 | 44d | 1 | 0.60mi |
| 830 S Lyon St Sherman, TX | 2.0 | 1.0 | 784 | $1,095 | $1.40 | 44d | 1 | 0.61mi |
| 1006 S Throckmorton St Sherman, TX | 2.0 | 1.0 | 705 | $1,026 | $1.46 | 44d | 1 | 0.72mi |
| 923 S First St Sherman, TX | 2.0 | 1.0 | 891 | $1,125 | $1.26 | 21d | 1 | 0.72mi |
| 304 E King St Sherman, TX | 2.0 | 1.0 | 876 | $1,250 | $1.43 | 44d | 1 | 0.78mi |
| 822 S Throckmorton St Sherman, TX | 3.0 | 2.0 | 1288 | $1,350 | $1.05 | 44d | 1 | 0.79mi |
| 1124 S Hazelwood St Sherman, TX | 3.0 | 2.0 | 1347 | $1,650 | $1.22 | 44d | 1 | 0.83mi |
| 2700 S Travis St Sherman, TX | 1.0–2.0 | 1.0–2.0 | 882 | $950 | $1.08 | 21d | 1 | 1.07mi |
| 817 W Lamar St Sherman, TX | 3.0 | 2.0 | 1074 | $1,495 | $1.39 | 44d | 1 | 1.11mi |
| 908 W Houston St Sherman, TX | 2.0 | 1.0 | 989 | $1,299 | $1.31 | 21d | 1 | 1.17mi |
| 1338 McCall St Sherman, TX | 3.0 | 2.0 | 1248 | $1,525 | $1.22 | 44d | 1 | 1.17mi |
| 906 W Houston St Sherman, TX | 2.0 | 1.0 | 989 | $1,175 | $1.19 | 44d | 1 | 1.18mi |
| 214 N Ricketts St Sherman, TX | 3.0 | 2.0 | 1211 | $1,550 | $1.28 | 44d | 1 | 1.28mi |
| 1429 E Odneal St Sherman, TX | 3.0 | 2.0 | 1218 | $1,700 | $1.40 | 44d | 1 | 1.29mi |
| 207 N Highland Ave Sherman, TX | 2.0 | 1.0 | 1175 | $1,300 | $1.11 | 44d | 1 | 1.33mi |
| 114 S Holly Ave Sherman, TX | 3.0 | 1.5 | 1440 | $1,195 | $0.83 | 44d | 1 | 1.35mi |
| 106 N McKown Ave Sherman, TX | 2.0 | 1.0 | 1066 | $1,050 | $0.98 | 21d | 1 | 1.35mi |
| 1121 Patricia Dr Sherman, TX | 3.0 | 2.0 | 1472 | $1,450 | $0.99 | 21d | 1 | 1.40mi |
| 2700 Ginger Ct Sherman, TX | 3.0 | 2.0 | 1090 | $1,550 | $1.42 | 44d | 1 | 1.43mi |
| 2733 Ginger Ct Sherman, TX | 2.0 | 2.5 | 1002 | $1,400 | $1.40 | 21d | 1 | 1.44mi |
| 1313 E Lamar St Sherman, TX | 2.0 | 1.0 | 1308 | $1,425 | $1.09 | 21d | 1 | 1.45mi |
| 1014 E Pecan St Sherman, TX | 3.0 | 2.0 | 1340 | $1,900 | $1.42 | 44d | 1 | 1.45mi |
| 524-526 N Woods St Sherman, TX | 3.0 | 2.0 | 1454 | $1,445 | $0.99 | 44d | 1 | 1.48mi |
| 620 N Walnut St Sherman, TX | 2.0 | 1.0 | 1100 | $1,050 | $0.95 | 44d | 1 | 1.48mi |
Listing history 26 events
-
2026-06-19days on market $129,900 Active 102 DOM
-
2026-06-18days on market $129,900 Active 101 DOM
-
2026-06-17days on market $129,900 Active 100 DOM
-
2026-06-16days on market $129,900 Active 99 DOM
-
2026-06-15days on market $129,900 Active 98 DOM
-
2026-06-14days on market $129,900 Active 96 DOM
-
2026-06-13days on market $129,900 Active 95 DOM
-
2026-06-10days on market $129,900 Active 93 DOM
-
2026-06-09days on market $129,900 Active 92 DOM
-
2026-06-08days on market $129,900 Active 91 DOM
-
2026-06-07days on market $129,900 Active 90 DOM
-
2026-06-03days on market $129,900 Active 86 DOM
-
2026-06-02days on market $129,900 Active 85 DOM
-
2026-06-01days on market $129,900 Active 84 DOM
-
2026-05-31days on market $129,900 Active 83 DOM
-
2026-05-30days on market $129,900 Active 82 DOM
-
2026-03-07$129,900 Active 890-char remark
Show marketing remark (890 chars)
Investment opportunity in Sherman, Texas. This 3-bedroom, 2-bath home located at 1429 S Elm St is currently tenant-occupied with renters paying $1,300 per month, providing immediate rental income for investors. Conveniently located in Sherman with easy access to shopping, dining, schools, and major highways. Sherman continues to experience strong growth and economic development, bringing new opportunities and making the area an increasingly attractive place to live and invest. Whether you're looking to expand your rental portfolio or secure a property in one of North Texas’ growing communities, this property offers solid investment potential. The seller is offering to replace the roof before closing with an acceptable offer. Seller is also selling 625 Main in Denison with the mls number 21200427 AND the duplex at 1422 E Lamar. Feel free to make an offer for all three!
-
2021-10-06soldstatus
-
2018-08-22soldstatus
-
2016-05-31soldstatus Sold 235-char remark
Show marketing remark (235 chars)
Investment or handyman special. Needs lots of updates. 3b2b house with large workshop in back with electricity. Gas water heater and wall unit. AC window units have been removed. Needs repairs. Inspection needed to determine condition.
-
2016-05-31soldstatus
Show marketing remark (235 chars)
Investment or handyman special. Needs lots of updates. 3b2b house with large workshop in back with electricity. Gas water heater and wall unit. AC window units have been removed. Needs repairs. Inspection needed to determine condition.
-
2016-05-05status Pending 235-char remark
Show marketing remark (235 chars)
Investment or handyman special. Needs lots of updates. 3b2b house with large workshop in back with electricity. Gas water heater and wall unit. AC window units have been removed. Needs repairs. Inspection needed to determine condition.
-
2016-04-28historical Active Option Contract 235-char remark
Show marketing remark (235 chars)
Investment or handyman special. Needs lots of updates. 3b2b house with large workshop in back with electricity. Gas water heater and wall unit. AC window units have been removed. Needs repairs. Inspection needed to determine condition.
-
2016-02-15price $45,000 235-char remark
Show marketing remark (235 chars)
Investment or handyman special. Needs lots of updates. 3b2b house with large workshop in back with electricity. Gas water heater and wall unit. AC window units have been removed. Needs repairs. Inspection needed to determine condition.
-
2016-02-04$53,000 Active 235-char remark
Show marketing remark (235 chars)
Investment or handyman special. Needs lots of updates. 3b2b house with large workshop in back with electricity. Gas water heater and wall unit. AC window units have been removed. Needs repairs. Inspection needed to determine condition.
-
1999-05-04soldstatus
ⓘ Source: listings_history table (triggers on properties + properties_extension) + one-shot
backfill from property_details.listing_events for pre-trigger history.
Tax reassessment forecast TX · Resets to sale price
- Current annual tax
- $2,412 · $201/mo
- Projected year-2 tax
- $2,412 · $201/mo
- Expected delta
- $0/yr ($0/mo · 0.0%)
ⓘ Screening estimate from a state-policy table — verify with the county assessor before closing.
Climate risk First Street
- Flood 1/10 Low FEMA zone X (unshaded) · 0% chance over 30 yrs
- Wildfire 6/10 Major
- Heat 6/10 Major 7 d/yr ≥108°F today · 22 d/yr by 30 yrs out
- Wind 4/10 Moderate 22% chance of damaging wind over 30 yrs
- Air quality 3/10 Moderate 2 unhealthy d/yr today · 3 by 30 yrs out
Nearby sold comps map
Loading sold comps map…
Walkable amenities ~0.75 mi
Loading nearby amenities…
Taxation est. · year 1
- Rental income
- $17,993
- − Mortgage interest
- −$7,276
- − Property taxes
- −$2,412
- − Insurance
- −$650
- − Repairs & maintenance
- −$1,439
- − Management
- −$1,439
- − Depreciation
- −$3,779
- Taxable income
- $997
- Est. tax owed @ 24.0%
- −$239
- After-tax cash flow
- $2,739/yr
For passive investors: Depreciation is non-cash, so a rental often shows a tax loss while cash-flowing — sheltering income. Rental losses are passive: they offset passive income freely, and up to $25,000/yr can offset ordinary (W-2) income if you actively participate and your MAGI is under $100k (phasing out to $0 by $150k); unused losses carry forward. On sale, claimed depreciation is recaptured at up to 25%, and gains may owe capital-gains tax (a 1031 exchange can defer both). Figures are a year-1 estimate at your 24.0% rate — not tax advice; consult a CPA.
Schools (NCES district)
- District
- Sherman ISD
- NCES district ID
- 4840080
- Math proficiency
- 31% ▼ -9.00%
- Reading proficiency
- 37% ▼ -2.00%
- Median HH income
- $42,587
- Composite
- 28.79/100
- National rank
- #6665
- State rank
- #546 of 826 in TX
Livability — Sherman
- Score
- 61/100
- State rank
- #1027
- US rank
- #18243
Category grades
Schools grade is shown separately in the Schools card above.
Census & demographics
- Census place
- Sherman, TX
- County
- Grayson County · 108,053 people
- City population
- 54,936
- Metro
- Sherman-Denison, TX
- Population (ZIP)
- 26,594
- Household income
- $55,543
- Rent vs Own
- Severe rent burden
- 840.0
Population outlook (Grayson County) Hauer SSP2
- Today (2025)
- 134,540 people
- By 2030
- 138,653 · +3.1%
- By 2040
- 145,958 · +8.5%
- By 2050
- 151,218 · +12.4%
- By 2075
- 161,802 · +20.3%
- By 2100
- 159,036 · +18.2%
Race, ethnicity, and origin ACS 2023
- Neighborhood character
- Diverse neighborhood (Simpson 0.64)
- Race & ethnicity
- White 49% Hispanic / Latino 32% Two or more races 17% Black 11%
- Hispanic origin (detail)
- Mexican 26%
- Common ancestry
- Slovak 2% Romanian 2% Lithuanian 1%
- Foreign-born
- 15% · Canada
- Languages at home
- 73% English-only · Spanish 24% German/W. Germanic 1% Other Indo-European 1%
Political lean MEDSL · Grayson
- 2024 margin
- Solid R (+54.3) · D 22.5% · R 76.7%
- 2008→2024 swing
- -16.4pp toward R · 2008: -37.9pp · 2024: -54.3pp
- All cycles
- 2024: R+54.3 2020: R+49.9 2016: R+53.1 2012: R+48.0 2008: R+37.9
Not yet ingested
- Civics
- —
Market trends
- HPI YoY
- ▼ -69.00%
- Current HPI
- 276.5739
- Rent YoY
- ▼ -2.70%
- Metro
- Sherman-Denison, TX
- State GDP YoY
- ▲ 3.95%
- F500 in state
- 110
Industry mix (Fortune 500 HQ in TX)
| Industry | F500 HQs | Revenue |
|---|---|---|
| Energy | 16 | $1,198B |
|
||
| Technology | 5 | $198B |
|
||
| Engineering / Construction | 4 | $72B |
|
||
| Energy Services | 3 | $60B |
|
||
| Utilities | 3 | $41B |
|
||
| Healthcare | 2 | $330B |
|
||
Price history
+145.1% since first listed10 events — show timeline
- 2026-03-07 Listed $129,900 NTREIS
- 2021-10-06 Sold (Public Records) — Public Records
- 2018-08-22 Sold (Public Records) — Public Records
- 2016-05-31 Sold (Public Records) — Public Records
- 2016-05-31 Sold (MLS) — NTREIS
- 2016-05-05 Pending — NTREIS
- 2016-04-28 Contingent — NTREIS
- 2016-02-15 Price Changed $45,000 NTREIS
- 2016-02-04 Listed $53,000 NTREIS
- 1999-05-04 Sold (Public Records) — Public Records
Property tax history
+4.4%/yrLatest (2025): $2,412 · +4.9% YoY. Source: county tax records.
Cash-flow waterfall
monthlySold comps — $/sqft
last 12 mo · ≤1 miLoading sold comps…