520/522 Shasta Ave #520 · McCloud, CA
Flood risk 1/10 · Minimal
- FEMA flood zone
- X (shaded)
- Chance of flooding over 30 yrs
- 0.0%
- Est. flood insurance / yr
- $507 – $1,088
Fire risk 6/10 · Moderate
- Est. fire insurance / yr
- $659 – $1,223
Heat risk 4/10 · Minor
- Hot days now (above 94°F)
- 8 days/yr
- Hot days in 30 yrs
- 19 days/yr
Wind risk 1/10 · Minimal
- Chance of severe wind over 30 yrs
- —
Air-quality risk 10/10 · Severe
- Unhealthy air days now
- 30 days/yr
- Unhealthy air days in 30 yrs
- 31 days/yr
Risk factors via First Street. Map © Google.
Why this score? — see what drove the B- grade
The composite is a weighted blend of 9 inputs, each scored 0–100. Each bar is that input's sub-score; the figure is the points it added to the 100-point composite (weight × sub-score).
- Cash flow +25.0/30.0
- Appreciation +10.0/10.0
- DSCR +8.1/10.0
- ARV discount +7.5/15.0
- 1% rule +6.5/10.0
- Schools +3.6/10.0
- Livability +3.0/5.0
- Rent growth +2.5/5.0
- Condition / age +2.2/5.0
$235,000
🖨 Deal sheet 📄 Offer letter ✓ Due diligence
Listing remarks
Opportunity & Abundance - Here is your opportunity to renovate one unit - while taking the Abundance of the remodeled unit in the back that brings in over $1,000 a month with a wonderful tenant in place. A lot of love will need to be put in the front unit, but the sweat equity could be worth your investment. A boost that will get you going - both units have mini splits installed. Bring your tools, your imagination and make this opportunity happen. The back unit was renovated in end of 2024. Square footage and amenities to be verified by buyer, as this has been a rental for over 25 years. Owner has little information.
Key facts
- Renovated unit
- 7,841 sq ft lot
- Listed 35 days
Tags
Property features AI
Finance
- Other: Zoned Res - 1, Duplex 2 Units
Exterior
- Parking: Gravel parking
- Utilities: Public water; Propane
- Home design: Residential income property (multi-family); Single-story
- Construction: Wood siding; Metal roof
- Exterior features: Wood fencing; Level lot
Interior
- Kitchen: Refrigerator
- Flooring: Laminate
- Interior features: Refrigerator; Laminate flooring
Neighborhood map
What this means for you Summary
Snapshot
- This is a 4-bed/2.0-bath condo listed at $235k. Condition is rated fair.
Deal economics
- At list price, monthly cash flow is $509 ($6k/yr) — positive.
- The deal already cash-flows at list — no discount required.
- Meets the 1% rule at list price ($3k rent vs $235k).
- Recommended offer: $228k (3.0% below list) — sets the bar for market timing.
Location & tenants
- Location reads 59/100 on livability (#636 in CA) — a working-class tenant base; expect higher turnover. Strengths: health & safety A+, housing B+; Watch: crime F, amenities F, commute F.
- Siskiyou Union High (rural): math 25% / reading 55% proficiency, ranked #763 of 1,400 in CA (top 54%) — families likely to look elsewhere, expect single-tenant / working-renter base with shorter leases; only 12% free/reduced lunch — higher-income household profile.
- Market conditions: 135 active listings in the ZIP; 50 units permitted in Siskiyou County in 2024 (0 in 5+ unit buildings).
Forward outlook
- In year one you build about $25k of equity ($2k loan paydown + $24k appreciation (10.0% local appreciation)).
- Siskiyou County population projected at -26% by 2050 — secular population decline; favor cash flow + early exit over multi-decade hold.
- At projected returns (10.0% appreciation + 3.0% rent growth), your $66k cash investment doubles in ~3 years — after that, you're playing with house money.
- By year 2, paydown + projected appreciation supports a ~$40k cash-out refi (75% LTV) — recoverable capital for the next deal without selling this one.
Negotiation context
- It's been on market 36 days — a 3% lower offer ($228k) is reasonable based on typical stale-listing flexibility.
Risks & watch-outs
- Climate carrying-cost: major wildfire risk — expect insurance premiums to compound above CPI over the hold.
Questions for the listing agent
- It's been on market 36 days. Have you received any prior offers? Is the seller open to a 3% concession, seller financing, or rate buy-down credit?
- Have any recent inspections been done? Can we get a copy of the seller's disclosures and any deferred-maintenance estimates?
- Any open or pending special assessments — roof, HVAC, plumbing, elevator, façade? What's the per-unit balance and payoff schedule, and is the seller paying it off at close or rolling it to the buyer?
- Is there a deadline driving the sale (1031 exchange, divorce, estate, relocation)? That informs how much negotiation room exists.
- Crime grade is F in this area — have there been break-ins, vandalism, or insurance claims at this property in the last 3 years? What carrier currently insures it and at what premium?
- What's the average days-on-market for RENTAL listings here right now (not sales)? A rising rental-DOM trend means longer vacancies and softer asking-rent achievability than the comps imply.
- What's the recent tenant-quality profile in this submarket — average credit score on applications, eviction rate, late-payment / NSF rate, and stable-employment percentage? A property-management company in the area should have these aggregated.
- How much new apartment / multifamily construction is in the pipeline within 1–3 miles? Heavy new supply (>2% of stock underway) typically softens rents 12–24 months out; light construction supports rent growth.
Investment metrics
- 1% rule
- 1.15% ✓
- Cap rate
- 8.89%
- Cash-on-cash
- 9.29%
- DSCR
- 1.41
- GRM
- 7.3
CMA / ARV
No comps found within radius.
Projected returns pro-forma
10.0% appreciation · 3.0% rent growth · sell at horizon
- IRR
- 31.1%
- Equity multiple
- 3.44×
- Total profit
- $160,473
- Equity at exit
- $211,707
- IRR
- 26.9%
- Equity multiple
- 7.80×
- Total profit
- $447,133
- Equity at exit
- $456,553
Cash invested: $65,800 (down + closing). Projections, not guarantees.
Landlord ↔ Tenant lean methodology
- Overall (STATE)
- 18 Strongly Tenant-Friendly
- State California
- 18 Strongly Tenant-Friendly · D+13
- County
- — inherits STATE
- City
- — inherits STATE
ZIP-level market 96057
- Active inventory
- 135
- Price-to-rent
- 7.3×
Monthly cashflow live
- Estimated rent
- $2,701 medium interval (Pro) →
- Mortgage (P&I)
- −$1,232
- Tax est. 1.5%
- −$294 /mo · $3,525/yr
- Insurance
- −$98
- HOA
- −$0
- Vacancy / Maint / Mgmt
- −$567
- Net cashflow
- $509
Break-even live
UW: 25.0% down · 7.5% · 30yr · 1.5% tax · 5.0% vac · 8.0% maint · 8.0% mgmt
Financing live
Cash to close
- Down payment
- $58,750
- Closing costs
- $7,050
- Reserves months
- —
- Total cash needed
- —
Loan-product check · same deal, 3 products live
Conventional
25% down · 7.5% · 30yr
- Down + closing
- —
- Monthly P&I
- —
- Monthly cashflow
- —
- DSCR
- —
- Eligible?
- —
Personal DTI + credit; lowest rate.
DSCR
20% down · 8.5% · 30yr
- Down + closing
- —
- Monthly P&I
- —
- Monthly cashflow
- —
- DSCR
- —
- Eligible?
- —
No personal income docs; deal must DSCR.
Hard money
10% down · 12.0% · 12mo
- Down + closing
- —
- Monthly P&I
- —
- Monthly cashflow
- —
- DSCR
- —
- Eligible?
- —
Short-term bridge; refi at stabilization.
HOA detail condo
- Monthly dues
- $0 · $0/yr
- Assessments
- None detected in remarks — confirm with the listing agent.
Listing history 17 events
-
2026-06-19days on market $235,000 Active 36 DOM
-
2026-06-18days on market $235,000 Active 35 DOM
-
2026-06-17days on market $235,000 Active 34 DOM
-
2026-06-16days on market $235,000 Active 33 DOM
-
2026-06-15days on market $235,000 Active 32 DOM
-
2026-06-14days on market $235,000 Active 30 DOM
-
2026-06-12days on market $235,000 Active 29 DOM
-
2026-06-09days on market $235,000 Active 26 DOM
-
2026-06-08days on market $235,000 Active 25 DOM
-
2026-06-07days on market $235,000 Active 24 DOM
-
2026-06-07days on market $235,000 Active 23 DOM
-
2026-06-04days on market $235,000 Active 20 DOM
-
2026-06-02days on market $235,000 Active 19 DOM
-
2026-06-01days on market $235,000 Active 18 DOM
-
2026-05-31days on market $235,000 Active 17 DOM
-
2026-05-31days on market $235,000 Active 16 DOM
-
2026-05-14$235,000 Active
ⓘ Source: listings_history table (triggers on properties + properties_extension) + one-shot
backfill from property_details.listing_events for pre-trigger history.
Climate risk First Street
- Flood 1/10 Low FEMA zone X (shaded) · 0% chance over 30 yrs
- Wildfire 6/10 Major
- Heat 4/10 Moderate 8 d/yr ≥94°F today · 19 d/yr by 30 yrs out
- Wind 1/10 Low
- Air quality 10/10 Extreme 30 unhealthy d/yr today · 31 by 30 yrs out
Nearby sold comps map
Loading sold comps map…
Walkable amenities ~0.75 mi
Loading nearby amenities…
Taxation est. · year 1
- Rental income
- $32,407
- − Mortgage interest
- −$13,164
- − Property taxes
- −$3,525
- − Insurance
- −$1,175
- − Repairs & maintenance
- −$2,593
- − Management
- −$2,593
- − Depreciation
- −$6,836
- Taxable income
- $2,522
- Est. tax owed @ 24.0%
- −$605
- After-tax cash flow
- $5,508/yr
For passive investors: Depreciation is non-cash, so a rental often shows a tax loss while cash-flowing — sheltering income. Rental losses are passive: they offset passive income freely, and up to $25,000/yr can offset ordinary (W-2) income if you actively participate and your MAGI is under $100k (phasing out to $0 by $150k); unused losses carry forward. On sale, claimed depreciation is recaptured at up to 25%, and gains may owe capital-gains tax (a 1031 exchange can defer both). Figures are a year-1 estimate at your 24.0% rate — not tax advice; consult a CPA.
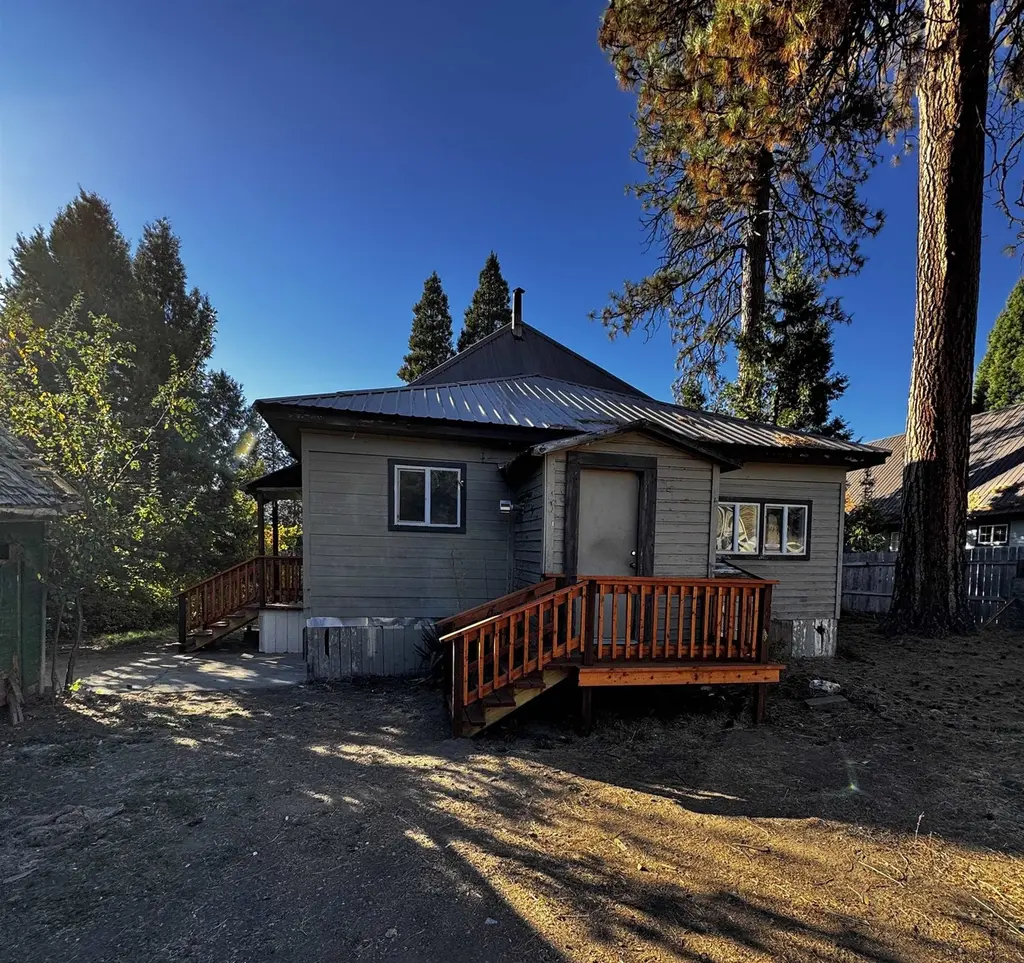
Condition & rehab AI · 14 photos
The property is in fair condition with significant repairs and maintenance needed, particularly to the roof and exterior siding. Upgrading these areas will significantly increase its value.
Repairs flagged
- Major roof — The roof appears to be in poor condition, with visible wear and tear.
- Major exterior siding — The exterior siding shows signs of wear and tear, and the paint appears faded.
- Major interior walls/paint — The interior walls and paint show signs of wear and tear, with some areas appearing faded or chipped.
- Major bathrooms — The bathrooms appear to be in poor condition, with visible wear and tear and outdated fixtures.
Value-add opportunities
- Both repair roof — Repairing the roof will improve the overall condition of the property and increase its value.
- Both repair exterior siding and paint — Updating the exterior siding and paint will improve the curb appeal and increase the property's value.
- Both repair interior walls and paint — Repairing the interior walls and paint will improve the condition of the interior and increase the property's value.
- Both update bathrooms — Updating the bathrooms will improve the condition of the property and increase its value.
Renovation cost estimate screening
| Repair item | Severity | Est. cost |
|---|---|---|
| roof · The roof appears to be in poor condition, with visible wear and tear. | Major | $15,000–50,000 |
| exterior siding · The exterior siding shows signs of wear and tear, and the paint appears faded. | Major | $15,000–50,000 |
| interior walls/paint · The interior walls and paint show signs of wear and tear, with some areas appearing faded or chipped. | Major | $15,000–50,000 |
| bathrooms · The bathrooms appear to be in poor condition, with visible wear and tear and outdated fixtures. | Major | $15,000–50,000 |
| Total estimated repair cost · 4 items | $60,000–200,000 |
Value-add ROI direction
- Both repair roof — Repairing the roof will improve the overall condition of the property and increase its value. ↑
- Both repair exterior siding and paint — Updating the exterior siding and paint will improve the curb appeal and increase the property's value. ↑
- Both repair interior walls and paint — Repairing the interior walls and paint will improve the condition of the interior and increase the property's value. ↑
- Both update bathrooms — Updating the bathrooms will improve the condition of the property and increase its value. ↑
ⓘ Cost ranges are severity-bucket heuristics (US national rule-of-thumb). Get contractor quotes + a written scope before underwriting a rehab budget.
Schools (NCES district)
- District
- Siskiyou Union High
- NCES district ID
- 0636940
- Math proficiency
- 25% ▲ 5.00%
- Reading proficiency
- 55% ▲ 5.00%
- Median HH income
- $39,293
- Composite
- 35.84/100
- National rank
- #9605
- State rank
- #763 of 1400 in CA
Livability — McCloud
- Score
- 59/100
- State rank
- #636
- US rank
- #20040
Category grades
Schools grade is shown separately in the Schools card above.
Census & demographics
- Census place
- McCloud, CA
- Population (ZIP)
- 1,076
Population outlook (Siskiyou County) Hauer SSP2
- Today (2025)
- 39,337 people
- By 2030
- 36,930 · -6.1%
- By 2040
- 32,367 · -17.7%
- By 2050
- 29,030 · -26.2%
- By 2075
- 23,534 · -40.2%
- By 2100
- 19,312 · -50.9%
Race, ethnicity, and origin ACS 2023
- Neighborhood character
- Predominantly White (79%)
- Race & ethnicity
- White 79% Two or more races 13% Hispanic / Latino 6% Native American 3% Asian 1%
- Hispanic origin (detail)
- Mexican 5%
- Common ancestry
- Russian 6% Slovak 5% Lithuanian 3%
- Foreign-born
- 5% · Canada
- Languages at home
- 96% English-only · German/W. Germanic 1% Other Asian/Pacific 1% Spanish 1%
Political lean MEDSL · Siskiyou
- 2024 margin
- R (+19.2) · D 38.8% · R 58.0% · Other 3.2%
- 2008→2024 swing
- -8.8pp toward R · 2008: -10.4pp · 2024: -19.2pp
- All cycles
- 2024: R+19.2 2020: R+15.8 2016: R+20.7 2012: R+15.6 2008: R+10.4
Not yet ingested
- Civics
- —
Market trends
- HPI YoY
- ▲ 147.64%
- Current HPI
- 490.68
- Rent YoY
- —
- Metro
- —
- State GDP YoY
- ▲ 3.21%
- F500 in state
- 116
Industry mix (Fortune 500 HQ in CA)
| Industry | F500 HQs | Revenue |
|---|---|---|
| Technology | 27 | $1,492B |
|
||
| Financial Services | 3 | $174B |
|
||
| Retail | 3 | $44B |
|
||
| Insurance | 3 | $26B |
|
||
| Media / Entertainment | 2 | $115B |
|
||
| Pharmaceuticals / Biotech | 2 | $62B |
|
||
Price history
1 event — show timeline
- 2026-05-14 Listed $235,000 SMLS
Cash-flow waterfall
monthlySold comps — $/sqft
last 12 mo · ≤1 miLoading sold comps…