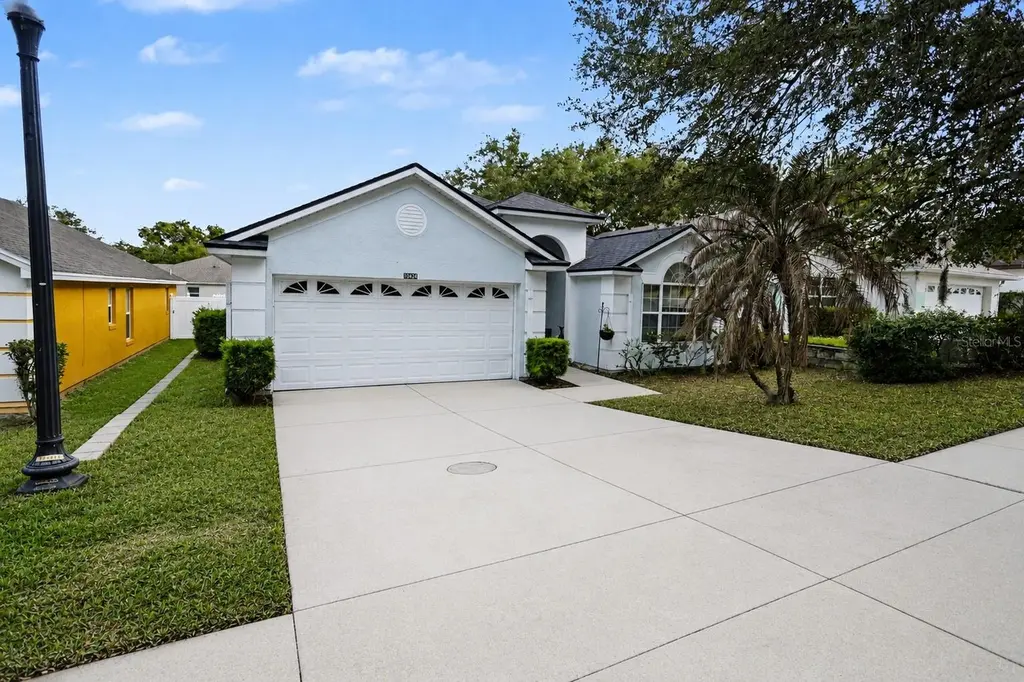
10424 Stonepark Drive Dr · Silver Lake, FL
Flood risk 1/10 · Minimal
- FEMA flood zone
- X (unshaded)
- Chance of flooding over 30 yrs
- 0.0%
- Est. flood insurance / yr
- $507 – $1,088
Fire risk 3/10 · Minor
- Est. fire insurance / yr
- $947 – $1,759
Heat risk 8/10 · Major
- Hot days now (above 107°F)
- 7 days/yr
- Hot days in 30 yrs
- 22 days/yr
Wind risk 9/10 · Severe
- Chance of severe wind over 30 yrs
- 99.0%
Air-quality risk 2/10 · Minimal
- Unhealthy air days now
- 1 days/yr
- Unhealthy air days in 30 yrs
- 1 days/yr
Risk factors via First Street. Map © Google.
Why this score? — see what drove the D+ grade
The composite is a weighted blend of 9 inputs, each scored 0–100. Each bar is that input's sub-score; the figure is the points it added to the 100-point composite (weight × sub-score).
- ARV discount +15.0/15.0
- Cash flow +12.9/30.0
- 1% rule +4.3/10.0
- Schools +4.2/10.0
- DSCR +3.9/10.0
- Livability +3.2/5.0
- Rent growth +2.5/5.0
- Condition / age +2.5/5.0
- Appreciation +0.0/10.0
$260,000
🖨 Deal sheet (PDF) 📄 Offer letter ✓ Due diligence
Listing remarks
One or more photo(s) has been virtually staged. Check out this solid 2003 block/stucco home featuring 3 beds, 2 baths, 1,724 sq ft, a 2-car garage, and a brand-new 2024 roof. The high ceilings in the living/dining area instantly open up the space, and the home is upgraded with custom barn doors, modern light fixtures, laminate flooring, and built-in shelving. The kitchen and bathrooms have Corian countertops and tile flooring, with plenty of space for family meals in the dining area, breakfast bar, or cozy kitchen nook. The master bedroom includes luxury vinyl flooring and a full en-suite with dual vanities, garden tub, and glass shower. Additional bedrooms also have updated flooring with a
Key facts
- Laminate flooring
- Brand new roof
- Corian countertops
Tags
Property features AI
Finance
- Other: Property listed as residential single-family; Homestead exemption indicated
- HOA & community: HOA required (Association: Lionel Nau); HOA fee approximately $100.58 per month ($1,207 annually); Pets allowed
Exterior
- Parking: Attached 2-car garage
- Security: Gated community (directions reference passing through a gate)
- Utilities: Public water; Public sewer; Cable available
- Home design: Single-family residence; PUD zoning; One story; North-facing
- Construction: Stucco construction; Shingle roof; Slab foundation; Built on a 0.12-acre lot
- Exterior features: Paved road access; Irrigation system
Interior
- Kitchen: Dishwasher
- Bedrooms: 3 bedrooms
- Flooring: Carpet
- Bathrooms: 2 full bathrooms
- Heating & cooling: Central heating; Central air conditioning
- Interior features: Ceiling fans
- Laundry & utility: Laundry room
Neighborhood map
What this means for you Summary
Snapshot
- This is a 3-bed/2.0-bath single-family listed at $260k.
Deal economics
- At list price, monthly cash flow is $-20 ($-243/yr) — negative.
- To cash-flow at today's rent, offer at most $256k (1.4% below list).
- To meet the 1% rule (rent ≥ 1% of price), the offer needs to be $242k (6.9% below list).
- Recommended offer: $242k (6.9% below list) — sets the bar for 1% rule.
- Cap rate 6.2% vs local median 5.1% in Silver Lake — meaningfully above typical; check what's discounted (condition, days-on-market, listing class) to confirm the premium yield is real.
Location & tenants
- Location reads 65/100 on livability (#644 in FL) — a middle-class / working-renter tenant base. Strengths: crime A+, housing A+, cost of living A; Watch: amenities F, commute F, health & safety F.
- Lake (suburban): math 49% / reading 50% proficiency, ranked #37 of 73 in FL (top 51%) — families likely to look elsewhere, expect single-tenant / working-renter base with shorter leases.
- Zoned schools: Treadway Elementary School (math 53% / reading 48%, grade D+, #1,055 of 2,144 statewide, top 50%, 879 students, 66% FRL); Tavares Middle School (math 43% / reading 40%, grade F, #348 of 571 statewide, top 62%, 1,070 students, 58% FRL); Tavares High School (math 32% / reading 40%, grade F, #359 of 667 statewide, top 55%, 1,507 students, 45% FRL).
- Market conditions: 288 active listings in the ZIP; 5 comparable units currently listed for rent nearby; rentals at typical pace (median 17d on market — plan ~3-4 weeks tenant-placement turnaround); 4,799 units permitted in Lake County in 2024 (814 in 5+ unit buildings).
- At $2,420/mo this rent would consume 54% of the median local household income ($54k/yr) (locally 406% of renters already pay >50% of income on rent) — very limited rent-growth headroom before tenants either downsize or default.
Forward outlook
- Local home prices are declining (-3.0%/yr); year-one equity from $2k of loan paydown is wiped out by about $8k of value loss. Plan a longer hold.
- Lake County population projected at +37% by 2050 — long-run rental-demand tailwind backs the buy-and-hold thesis.
Negotiation context
- It's been on market 21 days — a 2% lower offer ($256k) is reasonable based on typical stale-listing flexibility.
- 7 sale attempts since 21y ago with the ask held roughly flat each time — persistent listings suggest the price (not the market) is what's stuck; bring a comps-based counter.
- Current owner paid $197k; 32% above their basis — modest negotiation headroom, anchor on the comps not their cost.
Risks & watch-outs
- Climate carrying-cost: severe wind risk, 99% chance of damaging wind over 30y; extreme-heat days projected 7→22/yr by 2055 (HVAC capex compounding) — expect insurance premiums to compound above CPI over the hold.
Questions for the listing agent
- What do current leases actually rent for vs. the listed asking? Can we see a recent rent roll and the last 12 months of T-12 income?
- What does the HOA fee cover, when was the last increase, and are there any pending special assessments or reserve-fund shortfalls?
- Is there a deadline driving the sale (1031 exchange, divorce, estate, relocation)? That informs how much negotiation room exists.
- Schools are F-rated, which usually means shorter tenancies and higher turnover. Who's the typical renter profile here, and what's been the actual vacancy rate?
- The area grade is low — what's the realistic commute time and amenity access for the typical tenant pool here? Any planned neighborhood developments (good or bad) we should know about?
- What's the average days-on-market for RENTAL listings here right now (not sales)? A rising rental-DOM trend means longer vacancies and softer asking-rent achievability than the comps imply.
- What's the recent tenant-quality profile in this submarket — average credit score on applications, eviction rate, late-payment / NSF rate, and stable-employment percentage? A property-management company in the area should have these aggregated.
- How much new for-sale + rental construction is in the pipeline within 1–3 miles? Heavy new supply typically softens prices + rents 12–24 months out; constrained supply supports both.
Investment metrics
- 1% rule
- 0.93% ✗
- Cap rate
- 6.20%
- Cash-on-cash
- -0.33%
- DSCR
- 0.99
- GRM
- 9.0
CMA / ARV
- ARV (on-the-fly)
- $329,284
- Comps found
- 12
Show comp detail 12 sales within ~0.75 mi
| Address | Dist | Beds/Ba | Sqft | Sold | Price | $/sf | Match |
|---|---|---|---|---|---|---|---|
| 33624 Dolores Ct | 0.42mi | 3/2.0 | 1,769 (+3%) | 12mo | $330,000 | $187 | 66 |
| 10409 Pleasant View Dr | 0.44mi | 3/2.0 | 1,821 (+6%) | 9mo | $399,000 | $219 | 63 |
| 9910 Canterbury Dr | 0.56mi | 3/2.0 | 1,860 (+8%) | 2mo | $404,000 | $217 | 60 |
| 32835 Forest Ave | 0.57mi | 4/3.0 (+1) | 1,782 (+3%) | 2mo | $337,022 | $189 | 57 |
| 32905 Indian Woods Dr | 0.46mi | 3/2.0 | 1,965 (+14%) | 0mo | $365,000 | $186 | 55 |
| 10238 Summit Square Dr | 0.50mi | 3/2.0 | 1,608 (-7%) | 14mo | $290,000 | $180 | 54 |
| 9736 Fairway Cir | 0.69mi | 3/2.0 | 1,727 (+0%) | 22mo | $315,000 | $182 | 50 |
| 33312 Coventry Dr | 0.47mi | 2/2.0 (-1) | 1,483 (-14%) | 5mo | $250,000 | $169 | 46 |
| 9774 Carson Way | 0.72mi | 3/2.0 | 1,501 (-13%) | 1mo | $294,858 | $196 | 44 |
| 10343 Barrington Ct | 0.45mi | 3/2.0 | 1,972 (+14%) | 13mo | $395,000 | $200 | 44 |
| 33827 Silver Pine Dr | 0.67mi | 3/2.0 | 1,548 (-10%) | 14mo | $295,000 | $191 | 40 |
| 10341 Summit Square Dr | 0.51mi | 4/2.0 (+1) | 1,478 (-14%) | 21mo | $300,000 | $203 | 30 |
Match score weights: distance 35% · size 25% · config 20% · recency 20%. Top-matched comps best support the ARV.
Projected returns pro-forma
-3.0% appreciation · 3.0% rent growth · sell at horizon
- IRR
- -16.8%
- Equity multiple
- 0.41×
- Total profit
- $-43,300
- Equity at exit
- $38,767
- IRR
- -8.5%
- Equity multiple
- 0.47×
- Total profit
- $-38,878
- Equity at exit
- $22,480
Cash invested: $72,800 (down + closing). Projections, not guarantees.
Landlord ↔ Tenant lean methodology
- Overall (STATE)
- 87 Strongly Landlord-Friendly
- State Florida
- 87 Strongly Landlord-Friendly · R+3
- County
- — inherits STATE
- City
- — inherits STATE
ZIP-level market 34788
- Home prices YoY
- -18.2%
- Active inventory
- 288
- Price-to-rent
- 9.0×
Monthly cashflow live
- Estimated rent
- $2,420 high interval (Pro) →
- Mortgage (P&I)
- −$1,363
- Tax from tax record
- −$361 /mo · $4,328/yr
- Insurance
- −$108
- HOA
- −$100
- Vacancy / Maint / Mgmt
- −$508
- Net cashflow
- $-20
Break-even live
Sensitivity live
| Price | -10% $127 | -5% $53 | +0% $-20 | +5% $-94 | +10% $-167 |
|---|---|---|---|---|---|
| Rent | -10% $-211 | -5% $-116 | +0% $-20 | +5% $75 | +10% $171 |
| Rate | -1.0pp $111 | -0.5pp $46 | base $-20 | +0.5pp $-88 | +1.0pp $-156 |
UW: 25.0% down · 7.5% · 30yr · 1.5% tax · 5.0% vac · 8.0% maint · 8.0% mgmt
Financing live
Cash to close
- Down payment
- $65,000
- Closing costs
- $7,800
- Reserves months
- —
- Total cash needed
- —
Loan-product check · same deal, 3 products live
Conventional
25% down · 7.5% · 30yr
- Down + closing
- —
- Monthly P&I
- —
- Monthly cashflow
- —
- DSCR
- —
- Eligible?
- —
Personal DTI + credit; lowest rate.
DSCR
20% down · 8.5% · 30yr
- Down + closing
- —
- Monthly P&I
- —
- Monthly cashflow
- —
- DSCR
- —
- Eligible?
- —
No personal income docs; deal must DSCR.
Hard money
10% down · 12.0% · 12mo
- Down + closing
- —
- Monthly P&I
- —
- Monthly cashflow
- —
- DSCR
- —
- Eligible?
- —
Short-term bridge; refi at stabilization.
Rent comps 5 comps
| Address | Beds | Baths | Sqft | Rent | $/sqft | DOM | Units | Dist |
|---|---|---|---|---|---|---|---|---|
| 10240 Barrington Ct Leesburg, FL | 3.0 | 2.0 | 2090 | $2,700 | $1.29 | 14d | 1 | 0.39mi |
| 10402 Pleasant View Dr Leesburg, FL | 3.0 | 2.0 | 1931 | $2,599 | $1.35 | 6d | 1 | 0.43mi |
| 32635 Vista Ave Leesburg, FL | 3.0 | 2.0 | 1159 | $1,950 | $1.68 | 25d | 1 | 0.61mi |
| 32629 Vista Ave Leesburg, FL | 3.0 | 2.0 | 1700 | $1,950 | $1.15 | 16d | 1 | 0.62mi |
| 32629 Vista Ave Leesburg, FL | 3.0 | 2.0 | 1500 | $1,850 | $1.23 | 19d | 1 | 0.62mi |
HOA detail
- Monthly dues
- $100 · $1,200/yr
Listing history 24 events
-
2026-06-02status $260,000 Pending 21 DOM
-
2026-06-01days on market $260,000 Active 21 DOM
-
2026-05-31days on market $260,000 Active 20 DOM
-
2026-05-11$260,000 Active
-
2025-11-18$260,000 Active
-
2025-04-10historical
-
2025-03-14status Active
-
2025-03-08status Pending
-
2025-02-18price $275,000
-
2025-01-27price $292,000
-
2025-01-10$297,000 Active
-
2018-07-16soldstatus $197,000
-
2018-07-13soldstatus $197,000 Sold
-
2018-05-31status Pending
-
2018-05-29price $199,900
-
2018-05-07price $209,000
-
2018-04-17$214,900 Active
-
2017-05-15soldstatus $170,000
-
2017-04-28soldstatus $170,000 Sold
-
2017-03-30status Pending
-
2017-02-21$175,000 Active
-
2005-10-03soldstatus $245,000
-
2005-09-30soldstatus $245,000
-
2005-08-30$249,999
ⓘ Source: listings_history table (triggers on properties + properties_extension) + one-shot
backfill from property_details.listing_events for pre-trigger history.
Tax reassessment forecast FL · Resets to sale price
- Current annual tax
- $4,328 · $361/mo
- Projected year-2 tax
- $4,328 · $361/mo
- Expected delta
- $0/yr ($0/mo · 0.0%)
ⓘ Screening estimate from a state-policy table — verify with the county assessor before closing.
Climate risk First Street
- Flood 1/10 Low FEMA zone X (unshaded) · 0% chance over 30 yrs
- Wildfire 3/10 Moderate
- Heat 8/10 Severe 7 d/yr ≥107°F today · 22 d/yr by 30 yrs out
- Wind 9/10 Extreme 99% chance of damaging wind over 30 yrs
- Air quality 2/10 Low 1 unhealthy d/yr today · 1 by 30 yrs out
Nearby sold comps map
Loading sold comps map…
Walkable amenities ~0.75 mi
Loading nearby amenities…
Taxation est. · year 1
- Rental income
- $29,046
- − Mortgage interest
- −$14,564
- − Property taxes
- −$4,328
- − Insurance
- −$1,300
- − Repairs & maintenance
- −$2,324
- − Management
- −$2,324
- − HOA
- −$1,200
- − Depreciation
- −$7,564
- Taxable loss
- −$4,557
- Est. tax savings @ 24.0%
- +$1,094
- After-tax cash flow
- $851/yr
For passive investors: Depreciation is non-cash, so a rental often shows a tax loss while cash-flowing — sheltering income. Rental losses are passive: they offset passive income freely, and up to $25,000/yr can offset ordinary (W-2) income if you actively participate and your MAGI is under $100k (phasing out to $0 by $150k); unused losses carry forward. On sale, claimed depreciation is recaptured at up to 25%, and gains may owe capital-gains tax (a 1031 exchange can defer both). Figures are a year-1 estimate at your 24.0% rate — not tax advice; consult a CPA.
Schools (NCES district)
- District
- Lake
- NCES district ID
- 1201050
- Math proficiency
- 49% ▼ -7.00%
- Reading proficiency
- 50% ▼ -4.00%
- Median HH income
- $46,632
- Composite
- 42.05/100
- National rank
- #3327
- State rank
- #37 of 73 in FL
Livability — Silver Lake
- Score
- 65/100
- State rank
- #644
- US rank
- #12722
Category grades
Schools grade is shown separately in the Schools card above.
Census & demographics
- County
- Lake County · 364,602 people
- Metro
- Orlando-Kissimmee-Sanford, FL
- Population (ZIP)
- 22,137
- Household income
- $54,147
- Rent vs Own
- Severe rent burden
- 406.0
Population outlook (Lake County) Hauer SSP2
- Today (2025)
- 386,640 people
- By 2030
- 417,107 · +7.9%
- By 2040
- 476,676 · +23.3%
- By 2050
- 531,296 · +37.4%
- By 2075
- 648,303 · +67.7%
- By 2100
- 698,530 · +80.7%
Race, ethnicity, and origin ACS 2023
- Neighborhood character
- Predominantly White (79%)
- Race & ethnicity
- White 79% Hispanic / Latino 12% Two or more races 7% Black 5% Asian 1%
- Hispanic origin (detail)
- Mexican 3% Puerto Rican 6%
- Common ancestry
- Romanian 4% Lithuanian 3% Slovak 2%
- Foreign-born
- 5% · Canada, South Korea
- Languages at home
- 88% English-only · Spanish 9% German/W. Germanic 1% Tagalog/Filipino 1%
Political lean MEDSL · Lake
- 2024 margin
- Strong R (+24.7) · D 37.3% · R 62.0%
- 2008→2024 swing
- -11.2pp toward R · 2008: -13.5pp · 2024: -24.7pp
- All cycles
- 2024: R+24.7 2020: R+20.0 2016: R+23.1 2012: R+17.1 2008: R+13.5
Not yet ingested
- Civics
- —
Market trends
- HPI YoY
- ▼ -61.07%
- Current HPI
- 273.6616
- Rent YoY
- —
- Metro
- Orlando-Kissimmee-Sanford, FL
- State GDP YoY
- ▲ 3.28%
- F500 in state
- 36
Industry mix (Fortune 500 HQ in FL)
| Industry | F500 HQs | Revenue |
|---|---|---|
| Industrial Technology | 2 | $29B |
|
||
| Insurance | 2 | $17B |
|
||
| Retail | 1 | $60B |
|
||
| Technology Distribution | 1 | $58B |
|
||
| Homebuilding | 1 | $35B |
|
||
| Technology Manufacturing | 1 | $35B |
|
||
Price history
+4.0% since first listed21 events — show timeline
- 2026-05-11 Listed $260,000 Stellar MLS as Distributed by MLS Grid
- 2025-11-18 Listed $260,000 Stellar MLS as Distributed by MLS Grid
- 2025-04-10 Listing Removed — Stellar MLS as Distributed by MLS Grid
- 2025-03-14 Relisted — Stellar MLS as Distributed by MLS Grid
- 2025-03-08 Pending — Stellar MLS as Distributed by MLS Grid
- 2025-02-18 Price Changed $275,000 Stellar MLS as Distributed by MLS Grid
- 2025-01-27 Price Changed $292,000 Stellar MLS as Distributed by MLS Grid
- 2025-01-10 Listed $297,000 Stellar MLS as Distributed by MLS Grid
- 2018-07-16 Sold (Public Records) $197,000 Public Records
- 2018-07-13 Sold (MLS) $197,000 Stellar MLS as Distributed by MLS Grid
- 2018-05-31 Pending — Stellar MLS as Distributed by MLS Grid
- 2018-05-29 Price Changed $199,900 Stellar MLS as Distributed by MLS Grid
- 2018-05-07 Price Changed $209,000 Stellar MLS as Distributed by MLS Grid
- 2018-04-17 Listed $214,900 Stellar MLS as Distributed by MLS Grid
- 2017-05-15 Sold (Public Records) $170,000 Public Records
- 2017-04-28 Sold (MLS) $170,000 Stellar MLS as Distributed by MLS Grid
- 2017-03-30 Pending — Stellar MLS as Distributed by MLS Grid
- 2017-02-21 Listed $175,000 Stellar MLS as Distributed by MLS Grid
- 2005-10-03 Sold (Public Records) $245,000 Public Records
- 2005-09-30 Sold (MLS) $245,000 Stellar MLS as Distributed by MLS Grid
- 2005-08-30 Listed $249,999 Stellar MLS as Distributed by MLS Grid
Property tax history
+8.8%/yrLatest (2025): $4,328 · +4.0% YoY. Source: county tax records.
Cash-flow waterfall
monthlySold comps — $/sqft
last 12 mo · ≤1 miLoading sold comps…