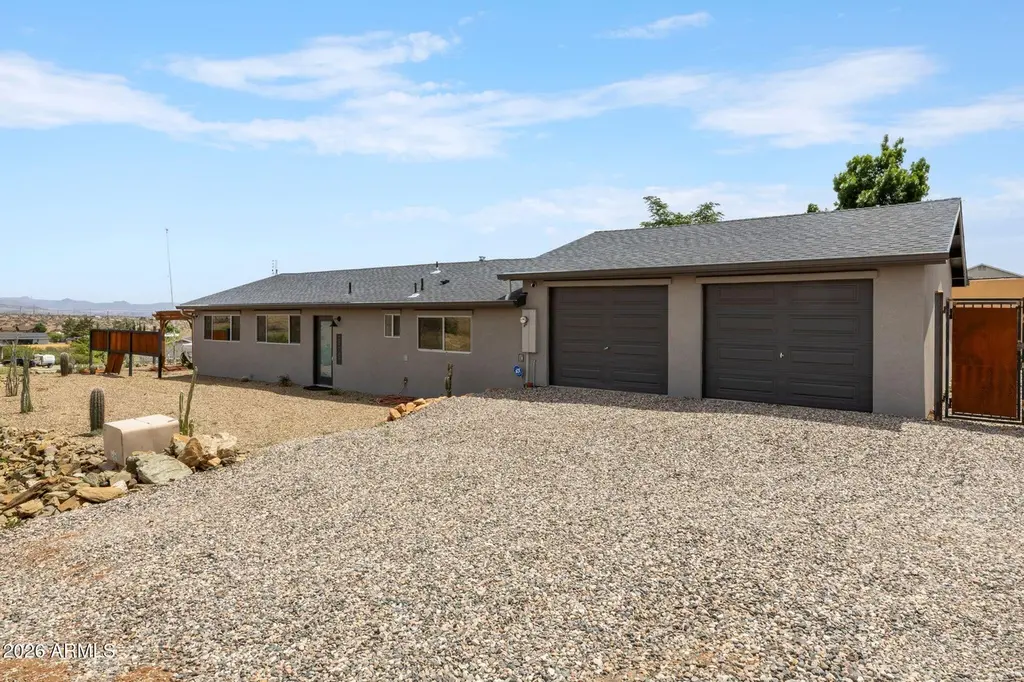
17707 E Hummingbird Ln · Spring Valley, AZ
Flood risk 1/10 · Minimal
- FEMA flood zone
- X (unshaded)
- Chance of flooding over 30 yrs
- 0.0%
- Est. flood insurance / yr
- $507 – $1,088
Fire risk 7/10 · Major
- Est. fire insurance / yr
- $610 – $1,132
Heat risk 6/10 · Moderate
- Hot days now (above 100°F)
- 7 days/yr
- Hot days in 30 yrs
- 18 days/yr
Wind risk 1/10 · Minimal
- Chance of severe wind over 30 yrs
- —
Air-quality risk 1/10 · Minimal
- Unhealthy air days now
- 0 days/yr
- Unhealthy air days in 30 yrs
- 0 days/yr
Risk factors via First Street. Map © Google.
Why this score? — see what drove the D grade
The composite is a weighted blend of 9 inputs, each scored 0–100. Each bar is that input's sub-score; the figure is the points it added to the 100-point composite (weight × sub-score).
- Cash flow +10.5/30.0
- Appreciation +10.0/10.0
- ARV discount +7.0/15.0
- Livability +3.2/5.0
- DSCR +3.0/10.0
- Rent growth +2.5/5.0
- Condition / age +2.5/5.0
- Schools +2.0/10.0
- 1% rule +1.8/10.0
$289,000
🖨 Deal sheet (PDF) 📄 Offer letter ✓ Due diligence
Listing remarks MLS
Rare opportunity to own a fully renovated single-family home in Spring Valley. Offering 1,152 square feet of updated living space, this move-in-ready property combines modern comfort with charm and functionality. From the moment you arrive, you'll love the great curb appeal, welcoming exterior, and attached 2-car garage.Inside, the home features bright, comfortable living spaces with tasteful modern finishes throughout. Situated on nearly 1/3 of an acre, the property provides plenty of room to relax, entertain, garden, or enjoy the outdoors. Finding a renovated single-family home in Spring Valley with this much charm, space, and move-in-ready appeal is hard to come by.
Key facts
- 0.28 acre lot
- 2 garage spots
- Built 1980
Property features AI
Finance
- HOA & community: No association fees
Exterior
- Parking: 2 covered parking spaces; 2-car garage
- Utilities: Private water company; Septic (in and connected)
- Home design: Single family residence; Fee simple ownership
- Construction: Stucco and wood frame construction; Composition roof
- Exterior features: Above-ground spa; Gravel/stone front yard
Interior
- Kitchen: Non-laminate countertops; Refrigerator; Dishwasher
- Bedrooms: Up to 3 possible bedrooms
- Flooring: Laminate flooring; Tile flooring
- Bathrooms: 1 full bathroom
- Heating & cooling: Heating present (mini split); Cooling present (mini split, ceiling fan(s))
- Interior features: 3/4 bath in master bedroom; Dual-pane windows; Fireplace
Neighborhood map
What this means for you Summary
Snapshot
- This is a 3-bed/1.0-bath single-family listed at $289k.
Deal economics
- At list price, monthly cash flow is $-149 ($-2k/yr) — negative.
- To cash-flow at today's rent, offer at most $263k (9.1% below list).
- To meet the 1% rule (rent ≥ 1% of price), the offer needs to be $195k (32.5% below list).
- Recommended offer: $195k (32.5% below list) — sets the bar for 1% rule.
Location & tenants
- Location reads 63/100 on livability (#117 in AZ) — a middle-class / working-renter tenant base. Strengths: cost of living A+, housing A+, crime A; Watch: employment D+, amenities F, commute F.
- Mayer Unified School District (4473) (rural): math 23% / reading 26% proficiency, ranked #165 of 249 in AZ (top 66%) — low school quality limits family demand, transient renter base, plan for 1-2y turnover; 80% free/reduced lunch — lower-income household profile, screen leases tightly.
- Zoned schools: Mayer Elementary School (math 26% / reading 32%, grade F, #570 of 1,109 statewide, top 52%, 373 students, 93% FRL); Mayer High School (math 5% / reading 5%, grade F, #364 of 381 statewide, top 100%, 200 students, 66% FRL) — zoned schools at 79% FRL track the district average.
- Market conditions: 244 active listings in the ZIP; 2,062 units permitted in Yavapai County in 2024 (98 in 5+ unit buildings).
Forward outlook
- In year one you build about $31k of equity ($2k loan paydown + $29k appreciation (10.0% local appreciation)).
- Yavapai County population projected at +10% by 2050 — modest demand growth; plan on rents tracking national, not racing it.
- By year 2, paydown + projected appreciation supports a ~$50k cash-out refi (75% LTV) — recoverable capital for the next deal without selling this one.
Negotiation context
- It's been on market 37 days — a 3% lower offer ($280k) is reasonable based on typical stale-listing flexibility.
- 4 sale attempts; this cycle's ask has dropped $185k (39%) from the opening price — seller is motivated, your offer sets the floor, not the list.
- Current owner paid $42k; list at $289k implies a 596% gain — meaningful room to come down on a strong offer.
Risks & watch-outs
- Climate carrying-cost: major wildfire risk; extreme-heat days projected 7→18/yr by 2055 (HVAC capex compounding) — expect insurance premiums to compound above CPI over the hold.
Questions for the listing agent
- What do current leases actually rent for vs. the listed asking? Can we see a recent rent roll and the last 12 months of T-12 income?
- It's been on market 37 days. Have you received any prior offers? Is the seller open to a 32% concession, seller financing, or rate buy-down credit?
- Is there a deadline driving the sale (1031 exchange, divorce, estate, relocation)? That informs how much negotiation room exists.
- Schools are D-rated, which usually means shorter tenancies and higher turnover. Who's the typical renter profile here, and what's been the actual vacancy rate?
- The area grade is low — what's the realistic commute time and amenity access for the typical tenant pool here? Any planned neighborhood developments (good or bad) we should know about?
- What's the average days-on-market for RENTAL listings here right now (not sales)? A rising rental-DOM trend means longer vacancies and softer asking-rent achievability than the comps imply.
- What's the recent tenant-quality profile in this submarket — average credit score on applications, eviction rate, late-payment / NSF rate, and stable-employment percentage? A property-management company in the area should have these aggregated.
- How much new for-sale + rental construction is in the pipeline within 1–3 miles? Heavy new supply typically softens prices + rents 12–24 months out; constrained supply supports both.
Investment metrics
- 1% rule
- 0.68% ✗
- Cap rate
- 5.67%
- Cash-on-cash
- -2.21%
- DSCR
- 0.90
- GRM
- 12.3
CMA / ARV
- ARV (on-the-fly)
- $285,696
- Comps found
- 10
Show comp detail 10 sales within ~0.75 mi
| Address | Dist | Beds/Ba | Sqft | Sold | Price | $/sf | Match |
|---|---|---|---|---|---|---|---|
| 17829 E Jackrabbit Rd | 0.13mi | 3/1.0 | 1,056 (-8%) | 2mo | $227,500 | $215 | 79 |
| 17625 E Bob White Rd | 0.18mi | 3/2.0 | 1,186 (+3%) | 15mo | $359,000 | $303 | 70 |
| 17270 E Peach Tree Rd | 0.44mi | 2/1.0 (-1) | 1,200 (+4%) | 0mo | $309,000 | $258 | 67 |
| 17933 E Bob White Rd | 0.34mi | 3/2.0 | 1,243 (+8%) | 0mo | $339,000 | $273 | 67 |
| 13819 S Bluebird Ln | 0.24mi | 2/2.0 (-1) | 1,250 (+8%) | 10mo | $296,500 | $237 | 57 |
| 17920 E Trails End Rd | 0.32mi | 3/2.0 | 1,243 (+8%) | 18mo | $354,000 | $285 | 53 |
| 17429 E Bob White Rd | 0.28mi | 3/2.0 | 989 (-14%) | 9mo | $168,000 | $170 | 52 |
| 13638 S Sage Brush Dr | 0.49mi | 2/2.0 (-1) | 1,297 (+13%) | 2mo | $263,000 | $203 | 45 |
| 17168 E Panorama Dr | 0.71mi | 3/2.0 | 1,288 (+12%) | 8mo | $210,000 | $163 | 36 |
| 17279 E Lakeview Dr | 0.60mi | 2/2.0 (-1) | 988 (-14%) | 16mo | $245,000 | $248 | 26 |
Match score weights: distance 35% · size 25% · config 20% · recency 20%. Top-matched comps best support the ARV.
Projected returns pro-forma
10.0% appreciation · 3.0% rent growth · sell at horizon
- IRR
- 22.7%
- Equity multiple
- 2.83×
- Total profit
- $147,733
- Equity at exit
- $260,354
- IRR
- 20.3%
- Equity multiple
- 6.46×
- Total profit
- $442,209
- Equity at exit
- $561,463
Cash invested: $80,920 (down + closing). Projections, not guarantees.
Landlord ↔ Tenant lean methodology
- Overall (STATE)
- 87 Strongly Landlord-Friendly
- State Arizona
- 87 Strongly Landlord-Friendly · R+3
- County
- — inherits STATE
- City
- — inherits STATE
ZIP-level market 86333
- Home prices YoY
- 17.3%
- Active inventory
- 244
- Price-to-rent
- 12.3×
Monthly cashflow live
- Estimated rent
- $1,952 medium interval (Pro) →
- Mortgage (P&I)
- −$1,516
- Tax from tax record
- −$55 /mo · $664/yr
- Insurance
- −$120
- HOA
- −$0
- Vacancy / Maint / Mgmt
- −$410
- Net cashflow
- $-149
Break-even live
Sensitivity live
| Price | -10% $14 | -5% $-67 | +0% $-149 | +5% $-231 | +10% $-313 |
|---|---|---|---|---|---|
| Rent | -10% $-303 | -5% $-226 | +0% $-149 | +5% $-72 | +10% $5 |
| Rate | -1.0pp $-4 | -0.5pp $-76 | base $-149 | +0.5pp $-224 | +1.0pp $-300 |
UW: 25.0% down · 7.5% · 30yr · 1.5% tax · 5.0% vac · 8.0% maint · 8.0% mgmt
Financing live
Cash to close
- Down payment
- $72,250
- Closing costs
- $8,670
- Reserves months
- —
- Total cash needed
- —
Loan-product check · same deal, 3 products live
Conventional
25% down · 7.5% · 30yr
- Down + closing
- —
- Monthly P&I
- —
- Monthly cashflow
- —
- DSCR
- —
- Eligible?
- —
Personal DTI + credit; lowest rate.
DSCR
20% down · 8.5% · 30yr
- Down + closing
- —
- Monthly P&I
- —
- Monthly cashflow
- —
- DSCR
- —
- Eligible?
- —
No personal income docs; deal must DSCR.
Hard money
10% down · 12.0% · 12mo
- Down + closing
- —
- Monthly P&I
- —
- Monthly cashflow
- —
- DSCR
- —
- Eligible?
- —
Short-term bridge; refi at stabilization.
Listing history 26 events
-
2026-06-22pricedays on market $289,000 Active 37 DOM
-
2026-06-18days on market $474,000 Active 33 DOM
-
2026-06-17price $474,000 Active 32 DOM
-
2026-06-16days on market $299,000 Active 32 DOM
-
2026-06-15days on market $299,000 Active 31 DOM
-
2026-06-14pricedays on market $299,000 Active 29 DOM
-
2026-06-13days on market $474,000 Active 27 DOM
-
2026-06-10days on market $474,000 Active 25 DOM
-
2026-06-09days on market $474,000 Active 24 DOM
-
2026-06-08days on market $474,000 Active 23 DOM
-
2026-06-07remarks 699-char remark
-
2026-06-07pricedays on market $474,000 Active 22 DOM
-
2026-06-03days on market $299,000 Active 19 DOM
-
2026-06-02days on market $299,000 Active 18 DOM
-
2026-06-01days on market $299,000 Active 17 DOM
-
2026-05-31days on market $299,000 Active 16 DOM
-
2026-05-30days on market $299,000 Active 15 DOM
-
2026-05-15$299,000 Active 677-char remark
Show marketing remark (863 chars)
Amazing Spring Valley opportunity featuring two unique properties being sold together, including parcels 500-03-408-B and 500-03-408-C.The first property is a fully renovated 1,152 SF single-family home offering modern updates, great curb appeal, a 2-car garage, and nearly 1/3 of an acre. Move-in ready with bright, comfortable living spaces and tasteful finishes throughout, this home combines charm, functionality, and hard-to-find value in Spring Valley.The second property is a steel home originally designed by architect William Bruder as an energy-efficient geothermal home with solar capabilities. Originally over 2,000 SF, the structure is currently not inhabitable and requires substantial renovation, but offers incredible potential for restoration, storage, workshop space, or a one-of-a-kind man cave. A unique opportunity with endless possibilities.
-
2026-05-15$299,000 Active
Show marketing remark (863 chars)
Amazing Spring Valley opportunity featuring two unique properties being sold together, including parcels 500-03-408-B and 500-03-408-C.The first property is a fully renovated 1,152 SF single-family home offering modern updates, great curb appeal, a 2-car garage, and nearly 1/3 of an acre. Move-in ready with bright, comfortable living spaces and tasteful finishes throughout, this home combines charm, functionality, and hard-to-find value in Spring Valley.The second property is a steel home originally designed by architect William Bruder as an energy-efficient geothermal home with solar capabilities. Originally over 2,000 SF, the structure is currently not inhabitable and requires substantial renovation, but offers incredible potential for restoration, storage, workshop space, or a one-of-a-kind man cave. A unique opportunity with endless possibilities.
-
2026-05-15$474,000 Active 863-char remark
Show marketing remark (863 chars)
Amazing Spring Valley opportunity featuring two unique properties being sold together, including parcels 500-03-408-B and 500-03-408-C.The first property is a fully renovated 1,152 SF single-family home offering modern updates, great curb appeal, a 2-car garage, and nearly 1/3 of an acre. Move-in ready with bright, comfortable living spaces and tasteful finishes throughout, this home combines charm, functionality, and hard-to-find value in Spring Valley.The second property is a steel home originally designed by architect William Bruder as an energy-efficient geothermal home with solar capabilities. Originally over 2,000 SF, the structure is currently not inhabitable and requires substantial renovation, but offers incredible potential for restoration, storage, workshop space, or a one-of-a-kind man cave. A unique opportunity with endless possibilities.
-
2026-05-15$474,000 Active
Show marketing remark (863 chars)
Amazing Spring Valley opportunity featuring two unique properties being sold together, including parcels 500-03-408-B and 500-03-408-C.The first property is a fully renovated 1,152 SF single-family home offering modern updates, great curb appeal, a 2-car garage, and nearly 1/3 of an acre. Move-in ready with bright, comfortable living spaces and tasteful finishes throughout, this home combines charm, functionality, and hard-to-find value in Spring Valley.The second property is a steel home originally designed by architect William Bruder as an energy-efficient geothermal home with solar capabilities. Originally over 2,000 SF, the structure is currently not inhabitable and requires substantial renovation, but offers incredible potential for restoration, storage, workshop space, or a one-of-a-kind man cave. A unique opportunity with endless possibilities.
-
2019-10-30soldstatus $41,500
-
2019-10-30soldstatus $70,000
-
2007-10-01soldstatus $150,000
-
1999-10-05soldstatus $75,000
-
1994-06-02soldstatus $75,000
ⓘ Source: listings_history table (triggers on properties + properties_extension) + one-shot
backfill from property_details.listing_events for pre-trigger history.
Tax reassessment forecast AZ · Resets to sale price
- Current annual tax
- $664 · $55/mo
- Projected year-2 tax
- $1,907 · $159/mo
- Expected delta
- +$1,244/yr (+$104/mo · 187.4%)
ⓘ Screening estimate from a state-policy table — verify with the county assessor before closing.
Climate risk First Street
- Flood 1/10 Low FEMA zone X (unshaded) · 0% chance over 30 yrs
- Wildfire 7/10 Severe
- Heat 6/10 Major 7 d/yr ≥100°F today · 18 d/yr by 30 yrs out
- Wind 1/10 Low
- Air quality 1/10 Low 0 unhealthy d/yr today · 0 by 30 yrs out
Nearby sold comps map
Loading sold comps map…
Walkable amenities ~0.75 mi
Loading nearby amenities…
Taxation est. · year 1
- Rental income
- $23,423
- − Mortgage interest
- −$16,188
- − Property taxes
- −$664
- − Insurance
- −$1,445
- − Repairs & maintenance
- −$1,874
- − Management
- −$1,874
- − Depreciation
- −$8,407
- Taxable loss
- −$7,029
- Est. tax savings @ 24.0%
- +$1,687
- After-tax cash flow
- $-104/yr
For passive investors: Depreciation is non-cash, so a rental often shows a tax loss while cash-flowing — sheltering income. Rental losses are passive: they offset passive income freely, and up to $25,000/yr can offset ordinary (W-2) income if you actively participate and your MAGI is under $100k (phasing out to $0 by $150k); unused losses carry forward. On sale, claimed depreciation is recaptured at up to 25%, and gains may owe capital-gains tax (a 1031 exchange can defer both). Figures are a year-1 estimate at your 24.0% rate — not tax advice; consult a CPA.
Schools (NCES district)
- District
- Mayer Unified School District (4473)
- NCES district ID
- 0404820
- Math proficiency
- 23% ▼ -11.00%
- Reading proficiency
- 26% ▼ -13.00%
- Median HH income
- $35,108
- Composite
- 20.22/100
- National rank
- #8627
- State rank
- #165 of 249 in AZ
Livability — Spring Valley
- Score
- 63/100
- State rank
- #117
- US rank
- #15515
Category grades
Schools grade is shown separately in the Schools card above.
Census & demographics
- Census place
- Spring Valley, AZ
- Population (ZIP)
- 6,425
Population outlook (Yavapai County) Hauer SSP2
- Today (2025)
- 241,389 people
- By 2030
- 249,523 · +3.4%
- By 2040
- 259,966 · +7.7%
- By 2050
- 264,736 · +9.7%
- By 2075
- 269,334 · +11.6%
- By 2100
- 256,505 · +6.3%
Race, ethnicity, and origin ACS 2023
- Neighborhood character
- Predominantly White (77%)
- Race & ethnicity
- White 77% Two or more races 15% Hispanic / Latino 14%
- Hispanic origin (detail)
- Mexican 11% Puerto Rican 1%
- Common ancestry
- Lithuanian 6% Iranian 3% Romanian 3%
- Foreign-born
- 5% · Canada
- Languages at home
- 93% English-only · Spanish 6% Russian/Polish/Slavic 1%
Political lean MEDSL · Yavapai
- 2024 margin
- Solid R (+33.9) · D 32.6% · R 66.5%
- 2008→2024 swing
- -9.5pp toward R · 2008: -24.4pp · 2024: -33.9pp
- All cycles
- 2024: R+33.9 2020: R+29.3 2016: R+31.4 2012: R+30.7 2008: R+24.4
Not yet ingested
- Civics
- —
Market trends
- HPI YoY
- ▲ 55.51%
- Current HPI
- 376.0374
- Rent YoY
- —
- Metro
- —
- State GDP YoY
- ▲ 4.54%
- F500 in state
- 20
Industry mix (Fortune 500 HQ in AZ)
| Industry | F500 HQs | Revenue |
|---|---|---|
| Technology | 2 | $13B |
|
||
| Mining / Metals | 1 | $23B |
|
||
| Environmental Services | 1 | $16B |
|
||
| Metals / Steel | 1 | $14B |
|
||
| Technology Distribution | 1 | $9B |
|
||
| Homebuilding | 1 | $8B |
|
||
Price history
+532.0% since first listed9 events — show timeline
- 2026-05-15 Listed $474,000 ARMLS
- 2026-05-15 Listed $474,000 PAARMLS as Distributed by MLS Grid
- 2026-05-15 Listed $299,000 ARMLS
- 2026-05-15 Listed $299,000 PAARMLS as Distributed by MLS Grid
- 2019-10-30 Sold (Public Records) $70,000 Public Records
- 2019-10-30 Sold (Public Records) $41,500 Public Records
- 2007-10-01 Sold (Public Records) $150,000 Public Records
- 1999-10-05 Sold (Public Records) $75,000 Public Records
- 1994-06-02 Sold (Public Records) $75,000 Public Records
Property tax history
+3.0%/yrLatest (2025): $664 · +6.6% YoY. Source: county tax records.
Cash-flow waterfall
monthlySold comps — $/sqft
last 12 mo · ≤1 miLoading sold comps…