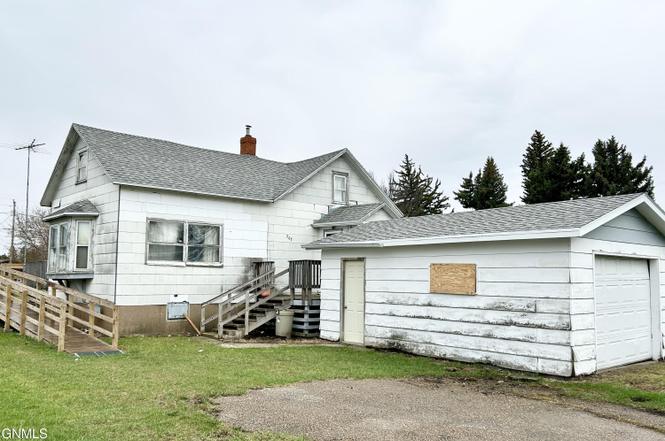
307 County Road 14 · Underwood, ND
Flood risk 6/10 · Moderate
- FEMA flood zone
- X (unshaded)
- Chance of flooding over 30 yrs
- 0.68%
- Est. flood insurance / yr
- $473 – $860
Fire risk 1/10 · Minimal
- Est. fire insurance / yr
- $1,289 – $2,393
Heat risk 2/10 · Minimal
- Hot days now (above 96°F)
- 7 days/yr
- Hot days in 30 yrs
- 13 days/yr
Wind risk 1/10 · Minimal
- Chance of severe wind over 30 yrs
- —
Air-quality risk 4/10 · Minor
- Unhealthy air days now
- 5 days/yr
- Unhealthy air days in 30 yrs
- 5 days/yr
Risk factors via First Street. Map © Google.
Why this score? — see what drove the C- grade
The composite is a weighted blend of 9 inputs, each scored 0–100. Each bar is that input's sub-score; the figure is the points it added to the 100-point composite (weight × sub-score).
- Cash flow +15.0/30.0
- ARV discount +7.5/15.0
- Appreciation +5.4/10.0
- 1% rule +5.0/10.0
- DSCR +5.0/10.0
- Schools +4.3/10.0
- Livability +3.5/5.0
- Rent growth +2.5/5.0
- Condition / age +2.5/5.0
$15,000
🖨 Deal sheet 📄 Offer letter ✓ Due diligence
Listing remarks MLS
Investment Opportunity/Handyman Special: This property presents a unique opportunity for investors or those with a vision for renovation. This property is in need of significant repair and is being sold as-is. The lot offers ample space and potential including a one stall detached garage. This is an ideal project for an experienced investor or contractor looking for a rewarding challenge.
Key facts
- Ample space
- Detached garage
- 0.32 acre lot
Tags
Property features AI
Finance
- Other: Lot is irregular with dimensions approximately 70 x 175 x 70 x 227; Road frontage on city street and county road; public maintained asphalt road; Lot size about 0.32 acres
- Financial info: Tax amount provided (financial details excluded per instructions)
- HOA & community: No HOA information provided
Exterior
- Parking: Has garage with 1 garage space
- Security: Security information not provided
- Utilities: Public water; Public sewer; Natural gas available and connected; Electricity available; Cable available; Phone available; Water available
- Home design: Single Family Residence; Residential property
- Construction: Construction materials: Other; Block foundation; Asphalt roof; Built area above grade: 1,440 (listed)
- Exterior features: Deck; No additional exterior features listed
Interior
- Kitchen: Appliances listed as 'Other'
- Bedrooms: 3 total rooms (includes bedrooms and living areas); Has basement
- Flooring: Flooring details not provided
- Bathrooms: 1 full bathroom
- Heating & cooling: Forced-air heating (natural gas); Cooling: none
- Interior features: Appliances: Other; Interior entry partial basement
- Laundry & utility: Washer/Dryer information not provided
Neighborhood map
What this means for you Summary
Snapshot
- This is a 3-bed/1.0-bath single-family listed at $15k.
Deal economics
- At list price, monthly cash flow is $749 ($9k/yr) — positive.
- The deal already cash-flows at list — no discount required.
- Meets the 1% rule at list price ($1k rent vs $15k).
Location & tenants
- Location reads 70/100 on livability (#78 in ND) — a middle-class / working-renter tenant base. Strengths: cost of living A+, housing A+, employment B; Watch: amenities F, commute F, health & safety D-.
- Underwood 8 (rural): math 40% / reading 55% proficiency, ranked #63 of 169 in ND (top 37%) — families likely to look elsewhere, expect single-tenant / working-renter base with shorter leases; only 16% free/reduced lunch — higher-income household profile.
- Market conditions: 13 active listings in the ZIP; 43 units permitted in McLean County in 2024 (0 in 5+ unit buildings).
Forward outlook
- In year one you build about $235 of equity ($104 loan paydown + $131 appreciation (0.9% local appreciation)).
- McLean County population projected at +48% by 2050 — long-run rental-demand tailwind backs the buy-and-hold thesis.
- At projected returns (0.9% appreciation + 3.0% rent growth), your $4k cash investment doubles in ~1 year — after that, you're playing with house money.
Negotiation context
- Only 3 days on market — expect competitive offers; lowballing is unlikely to land.
- 2 sale attempts with the ask held roughly flat each time — persistent listings suggest the price (not the market) is what's stuck; bring a comps-based counter.
Risks & watch-outs
- Watch-outs: built in 1920 — expect roof / HVAC / electrical / plumbing capex.
- Climate carrying-cost: major flood risk — expect insurance premiums to compound above CPI over the hold.
Questions for the listing agent
- Built in 1920 — when were the roof, HVAC, electrical panel, plumbing, and water heater last replaced?
- Is there a deadline driving the sale (1031 exchange, divorce, estate, relocation)? That informs how much negotiation room exists.
- What's the average days-on-market for RENTAL listings here right now (not sales)? A rising rental-DOM trend means longer vacancies and softer asking-rent achievability than the comps imply.
- What's the recent tenant-quality profile in this submarket — average credit score on applications, eviction rate, late-payment / NSF rate, and stable-employment percentage? A property-management company in the area should have these aggregated.
- How much new for-sale + rental construction is in the pipeline within 1–3 miles? Heavy new supply typically softens prices + rents 12–24 months out; constrained supply supports both.
Investment metrics
- 1% rule
- 7.19% ✓
- Cap rate
- 66.19%
- Cash-on-cash
- 213.92%
- DSCR
- 10.52
- GRM
- 1.2
CMA / ARV
- ARV (on-the-fly)
- $109,800
- Comps found
- 6
Show comp detail 6 sales within ~0.75 mi
| Address | Dist | Beds/Ba | Sqft | Sold | Price | $/sf | Match |
|---|---|---|---|---|---|---|---|
| 408 Sayler St | 0.33mi | 3/1.0 | 1,221 (+0%) | 1mo | $169,000 | $138 | 84 |
| 117 Summit St | 0.11mi | 2/2.0 (-1) | 1,216 (-0%) | 6mo | $109,000 | $90 | 80 |
| 501 Summit St | 0.35mi | 3/1.0 | 1,200 (-2%) | 14mo | $99,900 | $83 | 69 |
| 308 Borchardt Ave | 0.39mi | 2/1.0 (-1) | 1,200 (-2%) | 10mo | $79,900 | $67 | 66 |
| 600 2nd St | 0.36mi | 3/1.0 | 1,256 (+3%) | 19mo | $190,000 | $151 | 62 |
| 411 Mckinley Ave | 0.37mi | 3/1.5 | 1,312 (+8%) | 14mo | $79,900 | $61 | 57 |
Match score weights: distance 35% · size 25% · config 20% · recency 20%. Top-matched comps best support the ARV.
Projected returns pro-forma
0.87% appreciation · 3.0% rent growth · sell at horizon
- IRR
- —
- Equity multiple
- 12.40×
- Total profit
- $47,891
- Equity at exit
- $5,022
- IRR
- —
- Equity multiple
- 26.21×
- Total profit
- $105,877
- Equity at exit
- $6,599
Cash invested: $4,200 (down + closing). Projections, not guarantees.
Landlord ↔ Tenant lean methodology
- Overall (STATE)
- 82 Strongly Landlord-Friendly
- State North Dakota
- 82 Strongly Landlord-Friendly · R+20
- County
- — inherits STATE
- City
- — inherits STATE
ZIP-level market 58576
- Home prices YoY
- 0.5%
- Active inventory
- 13
- Price-to-rent
- 1.2×
Monthly cashflow live
- Estimated rent
- $1,079 medium interval (Pro) →
- Mortgage (P&I)
- −$79
- Tax est. 1.5%
- −$19 /mo · $225/yr
- Insurance
- −$6
- HOA
- −$0
- Vacancy / Maint / Mgmt
- −$227
- Net cashflow
- $749
Break-even live
UW: 25.0% down · 7.5% · 30yr · 1.5% tax · 5.0% vac · 8.0% maint · 8.0% mgmt
Financing live
Cash to close
- Down payment
- $3,750
- Closing costs
- $450
- Reserves months
- —
- Total cash needed
- —
Loan-product check · same deal, 3 products live
Conventional
25% down · 7.5% · 30yr
- Down + closing
- —
- Monthly P&I
- —
- Monthly cashflow
- —
- DSCR
- —
- Eligible?
- —
Personal DTI + credit; lowest rate.
DSCR
20% down · 8.5% · 30yr
- Down + closing
- —
- Monthly P&I
- —
- Monthly cashflow
- —
- DSCR
- —
- Eligible?
- —
No personal income docs; deal must DSCR.
Hard money
10% down · 12.0% · 12mo
- Down + closing
- —
- Monthly P&I
- —
- Monthly cashflow
- —
- DSCR
- —
- Eligible?
- —
Short-term bridge; refi at stabilization.
Listing history 3 events
-
2026-06-18days on market $15,000 Active 3 DOM
-
2026-06-17days on market $15,000 Active 2 DOM
-
2026-06-16$15,000 Active 1 DOM
ⓘ Source: listings_history table (triggers on properties + properties_extension) + one-shot
backfill from property_details.listing_events for pre-trigger history.
Climate risk First Street
- Flood 6/10 Major FEMA zone X (unshaded) · 68% chance over 30 yrs
- Wildfire 1/10 Low
- Heat 2/10 Low 7 d/yr ≥96°F today · 13 d/yr by 30 yrs out
- Wind 1/10 Low
- Air quality 4/10 Moderate 5 unhealthy d/yr today · 5 by 30 yrs out
Nearby sold comps map
Loading sold comps map…
Walkable amenities ~0.75 mi
Loading nearby amenities…
Taxation est. · year 1
- Rental income
- $12,948
- − Mortgage interest
- −$840
- − Property taxes
- −$225
- − Insurance
- −$75
- − Repairs & maintenance
- −$1,036
- − Management
- −$1,036
- − Depreciation
- −$436
- Taxable income
- $9,300
- Est. tax owed @ 24.0%
- −$2,232
- After-tax cash flow
- $6,753/yr
For passive investors: Depreciation is non-cash, so a rental often shows a tax loss while cash-flowing — sheltering income. Rental losses are passive: they offset passive income freely, and up to $25,000/yr can offset ordinary (W-2) income if you actively participate and your MAGI is under $100k (phasing out to $0 by $150k); unused losses carry forward. On sale, claimed depreciation is recaptured at up to 25%, and gains may owe capital-gains tax (a 1031 exchange can defer both). Figures are a year-1 estimate at your 24.0% rate — not tax advice; consult a CPA.
Schools (NCES district)
- District
- Underwood 8
- NCES district ID
- 3818660
- Math proficiency
- 40% ▼ -5.00%
- Reading proficiency
- 55% ▼ -10.00%
- Median HH income
- $54,442
- Composite
- 43.22/100
- National rank
- #6568
- State rank
- #63 of 169 in ND
Livability — Underwood
- Score
- 70/100
- State rank
- #78
- US rank
- #7630
Category grades
Schools grade is shown separately in the Schools card above.
Census & demographics
- Census place
- Underwood, ND
- Population (ZIP)
- 1,005
Population outlook (McLean County) Hauer SSP2
- Today (2025)
- 11,405 people
- By 2030
- 12,337 · +8.2%
- By 2040
- 14,426 · +26.5%
- By 2050
- 16,850 · +47.7%
- By 2075
- 24,191 · +112.1%
- By 2100
- 30,714 · +169.3%
Race, ethnicity, and origin ACS 2023
- Neighborhood character
- Predominantly White (91%)
- Race & ethnicity
- White 91% Two or more races 7%
- Common ancestry
- Portuguese 15% Scotch-Irish 2% Italian 2%
- Foreign-born
- 2% · Canada
- Languages at home
- 98% English-only · German/W. Germanic 1%
Political lean MEDSL · McLean
- 2024 margin
- Solid R (+58.1) · D 20.2% · R 78.4% · Other 1.4%
- 2008→2024 swing
- -39.1pp toward R · 2008: -19.0pp · 2024: -58.1pp
- All cycles
- 2024: R+58.1 2020: R+53.6 2016: R+53.0 2012: R+30.0 2008: R+19.0
Not yet ingested
- Civics
- —
Market trends
- HPI YoY
- ▲ 0.87%
- Current HPI
- 172.7268
- Rent YoY
- —
- Metro
- —
- State GDP YoY
- ▲ 2.09%
- F500 in state
- 2
Industry mix (Fortune 500 HQ in ND)
| Industry | F500 HQs | Revenue |
|---|---|---|
| Utilities / Construction | 1 | $6B |
|
||
Price history
-21.1% since first listed4 events — show timeline
- 2026-06-08 Listed $15,000 GNMLS
- 2025-06-11 Sold (MLS) — GNMLS
- 2025-05-01 Pending — GNMLS
- 2025-04-30 Listed $19,000 GNMLS
Property tax history
+10.3%/yrLatest (2025): $1,010 · +181.2% YoY. Source: county tax records.
Cash-flow waterfall
monthlySold comps — $/sqft
last 12 mo · ≤1 miLoading sold comps…