 Fourplex
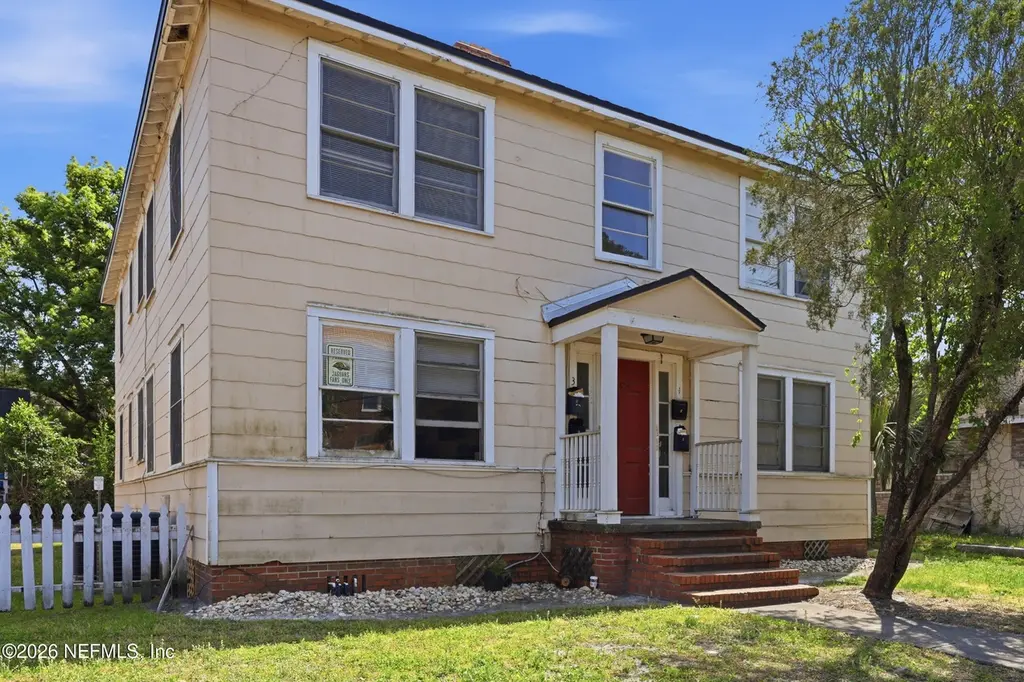
2614 College St #1-4 · Jacksonville, FL
Flood risk 1/10 · Minimal
- FEMA flood zone
- X (unshaded)
- Chance of flooding over 30 yrs
- 0.0%
- Est. flood insurance / yr
- $507 – $1,088
Fire risk 1/10 · Minimal
- Est. fire insurance / yr
- $947 – $1,759
Heat risk 9/10 · Severe
- Hot days now (above 107°F)
- 7 days/yr
- Hot days in 30 yrs
- 20 days/yr
Wind risk 9/10 · Severe
- Chance of severe wind over 30 yrs
- 99.0%
Air-quality risk 5/10 · Moderate
- Unhealthy air days now
- 7 days/yr
- Unhealthy air days in 30 yrs
- 7 days/yr
Risk factors via First Street. Map © Google.
Why this score? — see what drove the D grade
The composite is a weighted blend of 9 inputs, each scored 0–100. Each bar is that input's sub-score; the figure is the points it added to the 100-point composite (weight × sub-score).
- Cash flow +13.1/30.0
- ARV discount +7.5/15.0
- Livability +4.2/5.0
- DSCR +3.9/10.0
- Schools +3.9/10.0
- 1% rule +3.7/10.0
- Rent growth +3.7/5.0
- Condition / age +2.8/5.0
- Appreciation +0.0/10.0
$535,000
🖨 Deal sheet (PDF) 📄 Offer letter ✓ Due diligence
Multi-family units
County records classify this as Multi-Family (2-4 Unit). Listing-text estimate: 4 units. confirmed
Listing remarks
INCOME PRODUCING 4-plex in the heart of Riverside! This property offers four 1-bedroom/1 bath units. 4 units are currently occupied, with $3,050/mo rental income, . Great opportunity though to buy for rental income and live in Unit #4 if that is what you are looking for! This is an amazing opportunity to capitalize on one of the city's most desirable neighborhoods! Vibrant living scene, abundance amenities & proximity to downtown Jacksonville, the St. Johns River, and major highways makes it a convenient choice, attracting a variety of tenant options. This area consistently experiences strong rental demand, ideal for owners seeking steady rental income. On-going revitalization in the
Key facts
- Strong rental demand
- 4-plex
- Rental income
Tags
Property features AI
Exterior
- Parking: Off-street parking; On-street parking
- Utilities: Cable available; Electricity connected; Sewer connected; Water connected
- Home design: Quadruplex (residential); 2 stories; Single building
- Construction: Frame construction with wood siding; Shingle roof
- Exterior features: Cleared lot; Asphalt road access
Interior
- Kitchen: Dishwasher; Electric oven; Refrigerator
- Bedrooms: 4 bedrooms
- Flooring: Tile flooring; Wood flooring
- Bathrooms: 4 full bathrooms
- Heating & cooling: Central heating (electric); Central air conditioning (electric)
- Interior features: One fireplace (wood or gas not specified)
- Laundry & utility: In-unit laundry with washer hookup and electric dryer hookup; Dryer
Neighborhood map
What this means for you Summary
Snapshot
- This is a 4 × 1-bed/1-bath units multifamily listed at $535k. Condition is rated average.
Deal economics
- At list price, monthly cash flow is $-16 ($-190/yr) — negative. Per door: $-4/mo.
- To cash-flow at today's rent, offer at most $533k (0.4% below list).
- To meet the 1% rule (rent ≥ 1% of price), the offer needs to be $466k (12.9% below list).
- Recommended offer: $466k (12.9% below list) — sets the bar for 1% rule.
- Cap rate 6.3% vs local median 3.9% in Jacksonville — top-decile yield for the area; either an underpriced asset or a hidden risk that comps aren't pricing in. Stress-test before assuming the spread holds.
Location & tenants
- Location reads 83/100 on livability (#50 in FL, #911 nationally) — a professional / high-income tenant draw. Strengths: amenities A+, commute A+, housing A+.
- Duval (urban): math 46% / reading 45% proficiency, ranked #48 of 73 in FL (top 66%) — families likely to look elsewhere, expect single-tenant / working-renter base with shorter leases.
- Zoned schools: Central Riverside Elementary School (math 62% / reading 62%, grade B, #608 of 2,144 statewide, top 29%, 353 students, 56% FRL); Joseph Stilwell Middle School (math 31% / reading 33%, grade F, #448 of 571 statewide, top 79%, 612 students, 68% FRL); Riverside High School (math 24% / reading 39%, grade F, #424 of 667 statewide, top 64%, 1,567 students, 60% FRL).
- Market conditions: Rents rising fast (+4.7%/yr); 78 active listings in the ZIP; 6,503 units permitted in Duval County in 2024 (1,131 in 5+ unit buildings).
- At $4,660/mo this rent would consume 86% of the median local household income ($65k/yr) (locally 866% of renters already pay >50% of income on rent) — very limited rent-growth headroom before tenants either downsize or default.
Forward outlook
- Local home prices are declining (-3.0%/yr); year-one equity from $4k of loan paydown is wiped out by about $16k of value loss. Plan a longer hold.
- Duval County population projected at +19% by 2050 — long-run rental-demand tailwind backs the buy-and-hold thesis.
Negotiation context
- It's been on market 58 days — a 3% lower offer ($519k) is reasonable based on typical stale-listing flexibility.
Risks & watch-outs
- Watch-outs: built in 1942 — expect roof / HVAC / electrical / plumbing capex.
- Climate carrying-cost: severe wind risk, 99% chance of damaging wind over 30y; extreme-heat days projected 7→20/yr by 2055 (HVAC capex compounding) — expect insurance premiums to compound above CPI over the hold.
Questions for the listing agent
- What do current leases actually rent for vs. the listed asking? Can we see a recent rent roll and the last 12 months of T-12 income?
- It's been on market 58 days. Have you received any prior offers? Is the seller open to a 13% concession, seller financing, or rate buy-down credit?
- Can we see the unit-by-unit rent roll, current vacancy, and any below-market leases? What's the average tenancy length?
- What capital expenditures (roof, boiler, parking lot, exteriors) have been made in the last 5 years, and what's planned in the next 2?
- Built in 1942 — when were the roof, HVAC, electrical panel, plumbing, and water heater last replaced?
- Is there a deadline driving the sale (1031 exchange, divorce, estate, relocation)? That informs how much negotiation room exists.
- Schools are B-rated — typically a magnet for longer-tenancy family renters. What's the average tenant stay here, and is there a school-zone premium baked into asking?
- The area grade is low — what's the realistic commute time and amenity access for the typical tenant pool here? Any planned neighborhood developments (good or bad) we should know about?
- What's the average days-on-market for RENTAL listings here right now (not sales)? A rising rental-DOM trend means longer vacancies and softer asking-rent achievability than the comps imply.
- What's the recent tenant-quality profile in this submarket — average credit score on applications, eviction rate, late-payment / NSF rate, and stable-employment percentage? A property-management company in the area should have these aggregated.
- How much new apartment / multifamily construction is in the pipeline within 1–3 miles? Heavy new supply (>2% of stock underway) typically softens rents 12–24 months out; light construction supports rent growth.
Investment metrics
- 1% rule
- 0.87% ✗
- Cap rate
- 6.26%
- Cash-on-cash
- -0.13%
- DSCR
- 0.99
- GRM
- 9.6
CMA / ARV
No comps found within radius.
Projected returns pro-forma
-3.0% appreciation · 4.69% rent growth · sell at horizon
- IRR
- -14.6%
- Equity multiple
- 0.47×
- Total profit
- $-79,576
- Equity at exit
- $79,770
- IRR
- -3.4%
- Equity multiple
- 0.76×
- Total profit
- $-36,085
- Equity at exit
- $46,257
Cash invested: $149,800 (down + closing). Projections, not guarantees.
Landlord ↔ Tenant lean methodology
- Overall (STATE)
- 87 Strongly Landlord-Friendly
- State Florida
- 87 Strongly Landlord-Friendly · R+3
- County
- — inherits STATE
- City
- — inherits STATE
ZIP-level market 32204
- Home prices YoY
- -28.2%
- Rents YoY
- 4.7%
- Active inventory
- 78
- Price-to-rent
- 38.3×
Monthly cashflow live
- Estimated rent
- $4,660 high interval (Pro) →
- Mortgage (P&I)
- −$2,806
- Tax est. 1.5%
- −$669 /mo · $8,025/yr
- Insurance
- −$223
- HOA
- −$0
- Vacancy / Maint / Mgmt
- −$979
- Net cashflow
- $-16
Break-even live
Sensitivity live
| Price | -10% $354 | -5% $169 | +0% $-16 | +5% $-201 | +10% $-386 |
|---|---|---|---|---|---|
| Rent | -10% $-384 | -5% $-200 | +0% $-16 | +5% $168 | +10% $352 |
| Rate | -1.0pp $254 | -0.5pp $120 | base $-16 | +0.5pp $-154 | +1.0pp $-296 |
4-unit breakdown (identical units grouped — click to expand)
| Units | Beds | Baths | Est. rent |
|---|---|---|---|
| 4× units | 1 | 1 | $4,660 |
| #1 | 1 | 1 | $1,165 |
| #2 | 1 | 1 | $1,165 |
| #3 | 1 | 1 | $1,165 |
| #4 | 1 | 1 | $1,165 |
| Total (4 units) | $4,660 | ||
UW: 25.0% down · 7.5% · 30yr · 1.5% tax · 5.0% vac · 8.0% maint · 8.0% mgmt
Financing live
Cash to close
- Down payment
- $133,750
- Closing costs
- $16,050
- Reserves months
- —
- Total cash needed
- —
Loan-product check · same deal, 3 products live
Conventional
25% down · 7.5% · 30yr
- Down + closing
- —
- Monthly P&I
- —
- Monthly cashflow
- —
- DSCR
- —
- Eligible?
- —
Personal DTI + credit; lowest rate.
DSCR
20% down · 8.5% · 30yr
- Down + closing
- —
- Monthly P&I
- —
- Monthly cashflow
- —
- DSCR
- —
- Eligible?
- —
No personal income docs; deal must DSCR.
Hard money
10% down · 12.0% · 12mo
- Down + closing
- —
- Monthly P&I
- —
- Monthly cashflow
- —
- DSCR
- —
- Eligible?
- —
Short-term bridge; refi at stabilization.
Listing history 16 events
-
2026-06-21days on market $535,000 Active 58 DOM
-
2026-06-18days on market $535,000 Active 55 DOM
-
2026-06-17days on market $535,000 Active 54 DOM
-
2026-06-16days on market $535,000 Active 53 DOM
-
2026-06-15days on market $535,000 Active 52 DOM
-
2026-06-13days on market $535,000 Active 49 DOM
-
2026-06-10days on market $535,000 Active 46 DOM
-
2026-06-08days on market $535,000 Active 45 DOM
-
2026-06-08price $535,000 Active 44 DOM
-
2026-06-07days on market $553,000 Active 44 DOM
-
2026-06-05days on market $553,000 Active 41 DOM
-
2026-06-03days on market $553,000 Active 40 DOM
-
2026-06-02days on market $553,000 Active 39 DOM
-
2026-06-01days on market $553,000 Active 38 DOM
-
2026-05-31days on market $553,000 Active 37 DOM
-
2026-04-23$553,000 Active
ⓘ Source: listings_history table (triggers on properties + properties_extension) + one-shot
backfill from property_details.listing_events for pre-trigger history.
Climate risk First Street
- Flood 1/10 Low FEMA zone X (unshaded) · 0% chance over 30 yrs
- Wildfire 1/10 Low
- Heat 9/10 Extreme 7 d/yr ≥107°F today · 20 d/yr by 30 yrs out
- Wind 9/10 Extreme 99% chance of damaging wind over 30 yrs
- Air quality 5/10 Major 7 unhealthy d/yr today · 7 by 30 yrs out
Nearby sold comps map
Loading sold comps map…
Walkable amenities ~0.75 mi
Loading nearby amenities…
Taxation est. · year 1
- Rental income
- $55,920
- − Mortgage interest
- −$29,968
- − Property taxes
- −$8,025
- − Insurance
- −$2,675
- − Repairs & maintenance
- −$4,474
- − Management
- −$4,474
- − Depreciation
- −$15,564
- Taxable loss
- −$9,259
- Est. tax savings @ 24.0%
- +$2,222
- After-tax cash flow
- $2,032/yr
For passive investors: Depreciation is non-cash, so a rental often shows a tax loss while cash-flowing — sheltering income. Rental losses are passive: they offset passive income freely, and up to $25,000/yr can offset ordinary (W-2) income if you actively participate and your MAGI is under $100k (phasing out to $0 by $150k); unused losses carry forward. On sale, claimed depreciation is recaptured at up to 25%, and gains may owe capital-gains tax (a 1031 exchange can defer both). Figures are a year-1 estimate at your 24.0% rate — not tax advice; consult a CPA.
Condition & rehab AI · 12 photos
A moderate rehab project is needed to improve the exterior and enhance curb appeal, which will increase both resale and rental value.
Repairs flagged
- Major exterior siding — Significant wear and peeling
- Major exterior paint — Peeling and faded
Value-add opportunities
- Both paint exterior — Enhances curb appeal and value
- Both repair exterior siding — Improves property condition and value
- Both update kitchen appliances — Modernizes and increases appeal
- Both update bathrooms — Modernizes and increases appeal
Renovation cost estimate screening
| Repair item | Severity | Est. cost |
|---|---|---|
| exterior siding · Significant wear and peeling | Major | $15,000–50,000 |
| exterior paint · Peeling and faded | Major | $15,000–50,000 |
| Total estimated repair cost · 2 items | $30,000–100,000 |
Value-add ROI direction
- Both paint exterior — Enhances curb appeal and value ↑
- Both repair exterior siding — Improves property condition and value ↑
- Both update kitchen appliances — Modernizes and increases appeal ↑
- Both update bathrooms — Modernizes and increases appeal ↑
ⓘ Cost ranges are severity-bucket heuristics (US national rule-of-thumb). Get contractor quotes + a written scope before underwriting a rehab budget.
Schools (NCES district)
- District
- Duval
- NCES district ID
- 1200480
- Math proficiency
- 46% ▼ -11.00%
- Reading proficiency
- 45% ▼ -4.00%
- Median HH income
- $48,987
- Composite
- 38.97/100
- National rank
- #4076
- State rank
- #48 of 73 in FL
Livability — Jacksonville
- Score
- 83/100
- State rank
- #50
- US rank
- #911
Category grades
Schools grade is shown separately in the Schools card above.
Census & demographics
- Census place
- Jacksonville, FL
- County
- Duval County · 1,015,274 people
- City population
- 979,034
- Metro
- Jacksonville, FL
- Population (ZIP)
- 9,151
- Household income
- $65,063
- Rent vs Own
- Severe rent burden
- 866.0
Population outlook (Duval County) Hauer SSP2
- Today (2025)
- 1,013,010 people
- By 2030
- 1,059,228 · +4.6%
- By 2040
- 1,141,439 · +12.7%
- By 2050
- 1,205,258 · +19.0%
- By 2075
- 1,324,282 · +30.7%
- By 2100
- 1,319,620 · +30.3%
Race, ethnicity, and origin ACS 2023
- Neighborhood character
- Diverse neighborhood (Simpson 0.60)
- Race & ethnicity
- White 55% Black 30% Hispanic / Latino 6% Asian 6% Two or more races 6%
- Hispanic origin (detail)
- Mexican 3% Puerto Rican 1%
- Common ancestry
- Slovak 2% Lithuanian 2% Italian 1%
- Foreign-born
- 7% · China, Canada, Philippines
- Languages at home
- 92% English-only · Spanish 3% Chinese 2% Other Asian/Pacific 2%
Political lean MEDSL · Duval
- 2024 margin
- Toss-up / Even · D 48.7% · R 50.1% · Other 1.2%
- 2008→2024 swing
- +0.4pp no change · 2008: -1.9pp · 2024: -1.5pp
- All cycles
- 2024: R+1.5 2020: D+3.8 2016: R+1.5 2012: R+3.6 2008: R+1.9
Not yet ingested
- Civics
- —
Market trends
- HPI YoY
- ▼ -123.96%
- Current HPI
- 316.3185
- Rent YoY
- ▲ 4.69%
- Metro
- Jacksonville, FL
- State GDP YoY
- ▲ 3.28%
- F500 in state
- 36
Industry mix (Fortune 500 HQ in FL)
| Industry | F500 HQs | Revenue |
|---|---|---|
| Industrial Technology | 2 | $29B |
|
||
| Insurance | 2 | $17B |
|
||
| Retail | 1 | $60B |
|
||
| Technology Distribution | 1 | $58B |
|
||
| Homebuilding | 1 | $35B |
|
||
| Technology Manufacturing | 1 | $35B |
|
||
Price history
1 event — show timeline
- 2026-04-23 Listed $553,000 realMLS
Cash-flow waterfall
monthlySold comps — $/sqft
last 12 mo · ≤1 miLoading sold comps…