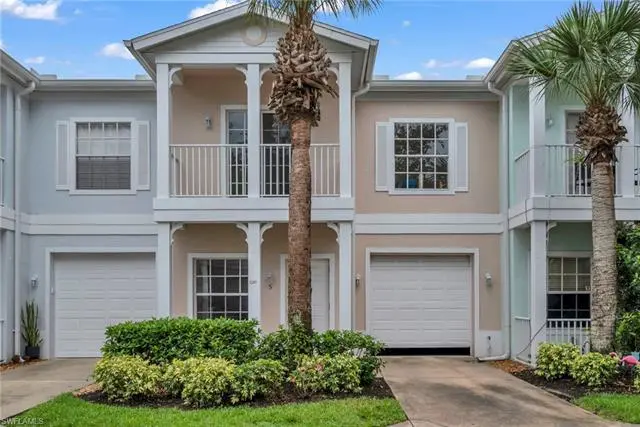
3280 Lindsey Ln #5 · Vineyards, FL
Flood risk 6/10 · Moderate
- FEMA flood zone
- X (unshaded)
- Chance of flooding over 30 yrs
- 0.72%
- Est. flood insurance / yr
- $507 – $1,088
Fire risk 1/10 · Minimal
- Est. fire insurance / yr
- $947 – $1,759
Heat risk 10/10 · Severe
- Hot days now (above 107°F)
- 7 days/yr
- Hot days in 30 yrs
- 30 days/yr
Wind risk 10/10 · Severe
- Chance of severe wind over 30 yrs
- 99.0%
Air-quality risk 2/10 · Minimal
- Unhealthy air days now
- 2 days/yr
- Unhealthy air days in 30 yrs
- 2 days/yr
Risk factors via First Street. Map © Google.
Why this score? — see what drove the D grade
The composite is a weighted blend of 9 inputs, each scored 0–100. Each bar is that input's sub-score; the figure is the points it added to the 100-point composite (weight × sub-score).
- Cash flow +9.1/30.0
- ARV discount +7.5/15.0
- Appreciation +5.1/10.0
- Schools +5.0/10.0
- 1% rule +4.3/10.0
- Livability +3.2/5.0
- Rent growth +2.7/5.0
- DSCR +2.5/10.0
- Condition / age +2.5/5.0
$320,000
🖨 Deal sheet (PDF) 📄 Offer letter ✓ Due diligence
Listing remarks MLS
This is a Fannie Mae HomePath property. Purchase this property for as little as 3% down! 3 bedroom, 2.5 bath, 2 story townhouse located in the Cypress Glen Village community of Naples. Just off Pine Ridge Rd in the heart of North Naples! This home features a laundry room in residence, 1 car attached garage, and carpet floorings throughout with ceramic tiles on the wet areas. The eat-in kitchen features a breakfast bar overlooking the living-dining area making this home perfect for entertaining! The master bath features a dual sink with shower only, and the 2nd bathroom features a combo tub and shower. Relax on the back deck or enjoy the open balcony off the front off the home. This property is approved for HomePath Mortgage Financing & HomePath Renovation Mortgage Financing. All info & property details are deemed reliable but not guaranteed & should be independently verified if any person intends to engage in a transaction based upon it.
Key facts
- Clubhouse space
- $687 HOA
- Garage
Tags
Property features AI
Finance
- Other: Part of a 40-unit complex (4 units per building); Unit is one of two floors in a building with a total of 2 floors; Development: Cypress Glen (Cypress Glen Village); Architectural restrictions apply; Central irrigation
- HOA & community: Mandatory HOA; Quarterly master HOA fee of $1,070; Quarterly condo fee of $990; Professional management; Maintenance covers cable, irrigation water, lawn/land maintenance, exterior pest control, street lights, trash removal, and water; Community amenities include clubhouse, community pool, streetlights, and underground utilities; Non-gated community; Total annual recurring fees approximately $8,240
Exterior
- Parking: Attached 1-car garage
- Utilities: Central water; Central sewer; Cable available; Central electric power
- Home design: Residential townhouse; Traditional style; 2-story floor plan; Rear exposure faces southwest; Entry possession at closing
- Construction: Built in 2004; Concrete block and wood frame construction; Stucco exterior finish; Shingle roof; Double-hung windows; Concrete foundation
- Exterior features: Patio; Landscaped area view; Cul-de-sac lot
Interior
- Kitchen: Range; Self-cleaning oven; Microwave; Dishwasher; Disposal
- Bedrooms: 3 bedrooms; Master bedroom located upstairs
- Flooring: Carpet; Tile
- Bathrooms: 2 full bathrooms; 1 half bathroom; Master bath with shower (no tub)
- Heating & cooling: Central electric heat; Central electric air conditioning; Ceiling fans
- Interior features: Cable prewired and high-speed internet available; Smoke detectors; Walk-in closet; Dining area in living room; Guest bath; Guest room; Home office; Laundry in residence; Unfurnished; Three ceiling fans
- Laundry & utility: Washer and dryer included; Auto garage door opener
Neighborhood map
What this means for you Summary
Snapshot
- This is a 3-bed/2.5-bath condo listed at $320k.
Deal economics
- At list price, monthly cash flow is $-248 ($-3k/yr) — negative.
- To cash-flow at today's rent, offer at most $276k (13.7% below list).
- To meet the 1% rule (rent ≥ 1% of price), the offer needs to be $297k (7.3% below list).
- Recommended offer: $276k (13.7% below list) — sets the bar for cash-flow.
Location & tenants
- Location reads 64/100 on livability (#679 in FL) — a middle-class / working-renter tenant base. Strengths: crime A+, employment A+, housing A-; Watch: health & safety D, amenities F, commute F.
- Collier (suburban): math 60% / reading 56% proficiency, ranked #16 of 73 in FL (top 22%) — acceptable for families but not a draw, mixed tenant base, ~2y average lease.
- Zoned schools: Osceola Elementary School (math 78% / reading 74%, grade A, #198 of 2,144 statewide, top 10%, 621 students, 32% FRL); Pine Ridge Middle School (math 74% / reading 70%, grade A, #52 of 571 statewide, top 10%, 832 students, 31% FRL); Barron Collier High School (math 62% / reading 68%, grade B, #76 of 667 statewide, top 11%, 1,650 students, 26% FRL) — zoned schools average 30% FRL vs 55% district-wide (25 pts lower); this property's tenant base skews higher-income than the district average.
- Zoned-school proficiency averages 71% at this address vs 58% district-wide (+13 pts) — the actual schools serving this property are materially stronger than the Collier average implies; a family-tenant draw the district grade alone would hide.
- Market conditions: Rents flat; 424 active listings in the ZIP; 40 comparable units currently listed for rent nearby; rentals at typical pace (median 16d on market — plan ~3-4 weeks tenant-placement turnaround); solid renter incomes; 3,520 units permitted in Collier County in 2024 (959 in 5+ unit buildings).
Forward outlook
- In year one you build about $3k of equity ($2k loan paydown + $944 appreciation (0.3% local appreciation)).
- Collier County population projected at +30% by 2050 — long-run rental-demand tailwind backs the buy-and-hold thesis.
- By year 9, paydown + projected appreciation supports a ~$34k cash-out refi (75% LTV) — recoverable capital for the next deal without selling this one.
Negotiation context
- It's been on market 33 days — a 3% lower offer ($310k) is reasonable based on typical stale-listing flexibility.
- 2 sale attempts since 14y ago with the ask held roughly flat each time — persistent listings suggest the price (not the market) is what's stuck; bring a comps-based counter.
- Current owner paid $128k; list at $320k implies a 151% gain — meaningful room to come down on a strong offer.
Risks & watch-outs
- Watch-outs: HOA is 23% of rent.
- Climate carrying-cost: major flood risk; severe wind risk, 99% chance of damaging wind over 30y; extreme-heat days projected 7→30/yr by 2055 (HVAC capex compounding) — expect insurance premiums to compound above CPI over the hold.
Questions for the listing agent
- What do current leases actually rent for vs. the listed asking? Can we see a recent rent roll and the last 12 months of T-12 income?
- It's been on market 33 days. Have you received any prior offers? Is the seller open to a 14% concession, seller financing, or rate buy-down credit?
- What does the HOA fee cover, when was the last increase, and are there any pending special assessments or reserve-fund shortfalls?
- Any open or pending special assessments — roof, HVAC, plumbing, elevator, façade? What's the per-unit balance and payoff schedule, and is the seller paying it off at close or rolling it to the buyer?
- Is there a deadline driving the sale (1031 exchange, divorce, estate, relocation)? That informs how much negotiation room exists.
- The area grade is low — what's the realistic commute time and amenity access for the typical tenant pool here? Any planned neighborhood developments (good or bad) we should know about?
- What's the average days-on-market for RENTAL listings here right now (not sales)? A rising rental-DOM trend means longer vacancies and softer asking-rent achievability than the comps imply.
- What's the recent tenant-quality profile in this submarket — average credit score on applications, eviction rate, late-payment / NSF rate, and stable-employment percentage? A property-management company in the area should have these aggregated.
- How much new apartment / multifamily construction is in the pipeline within 1–3 miles? Heavy new supply (>2% of stock underway) typically softens rents 12–24 months out; light construction supports rent growth.
Investment metrics
- 1% rule
- 0.93% ✗
- Cap rate
- 5.36%
- Cash-on-cash
- -3.32%
- DSCR
- 0.85
- GRM
- 9.0
CMA / ARV
No comps found within radius.
Projected returns pro-forma
0.29% appreciation · 0.92% rent growth · sell at horizon
- IRR
- -6.3%
- Equity multiple
- 0.70×
- Total profit
- $-26,469
- Equity at exit
- $97,664
- IRR
- -2.0%
- Equity multiple
- 0.79×
- Total profit
- $-19,069
- Equity at exit
- $121,255
Cash invested: $89,600 (down + closing). Projections, not guarantees.
Landlord ↔ Tenant lean methodology
- Overall (STATE)
- 87 Strongly Landlord-Friendly
- State Florida
- 87 Strongly Landlord-Friendly · R+3
- County
- — inherits STATE
- City
- — inherits STATE
ZIP-level market 34109
- Home prices YoY
- 0.1%
- Rents YoY
- 0.9%
- Active inventory
- 424
- Price-to-rent
- 9.0×
Monthly cashflow live
- Estimated rent
- $2,965 high interval (Pro) →
- Mortgage (P&I)
- −$1,678
- Tax from tax record
- −$92 /mo · $1,101/yr
- Insurance
- −$133
- HOA
- −$687
- Vacancy / Maint / Mgmt
- −$623
- Net cashflow
- $-248
Break-even live
Sensitivity live
| Price | -10% $-66 | -5% $-157 | +0% $-248 | +5% $-338 | +10% $-429 |
|---|---|---|---|---|---|
| Rent | -10% $-482 | -5% $-365 | +0% $-248 | +5% $-130 | +10% $-13 |
| Rate | -1.0pp $-86 | -0.5pp $-166 | base $-248 | +0.5pp $-330 | +1.0pp $-415 |
UW: 25.0% down · 7.5% · 30yr · 1.5% tax · 5.0% vac · 8.0% maint · 8.0% mgmt
Financing live
Cash to close
- Down payment
- $80,000
- Closing costs
- $9,600
- Reserves months
- —
- Total cash needed
- —
Loan-product check · same deal, 3 products live
Conventional
25% down · 7.5% · 30yr
- Down + closing
- —
- Monthly P&I
- —
- Monthly cashflow
- —
- DSCR
- —
- Eligible?
- —
Personal DTI + credit; lowest rate.
DSCR
20% down · 8.5% · 30yr
- Down + closing
- —
- Monthly P&I
- —
- Monthly cashflow
- —
- DSCR
- —
- Eligible?
- —
No personal income docs; deal must DSCR.
Hard money
10% down · 12.0% · 12mo
- Down + closing
- —
- Monthly P&I
- —
- Monthly cashflow
- —
- DSCR
- —
- Eligible?
- —
Short-term bridge; refi at stabilization.
Rent comps 40 comps
| Address | Beds | Baths | Sqft | Rent | $/sqft | DOM | Units | Dist |
|---|---|---|---|---|---|---|---|---|
| 3268 Amanda Ln #3 Naples, FL | 3.0 | 2.5 | 1437 | $2,350 | $1.64 | 15d | 1 | 0.05mi |
| 3304 Lisa Ln Unit 102 Naples, FL | 2.0 | 2.5 | 1272 | $2,350 | $1.85 | 15d | 1 | 0.08mi |
| 3250 Cypress Glen Way Naples, FL | 2.0 | 2.0 | 1191 | $3,488 | $2.93 | 25d | 2 | 0.08mi |
| 3250 Cypress Glen Way Naples, FL | 2.0 | 2.0 | 1242 | $3,300 | $2.66 | 23d | 3 | 0.08mi |
| 3225 Cypress Glen Way #105 Naples, FL | 2.0 | 2.0 | 1191 | $2,900 | $2.43 | 25d | 1 | 0.12mi |
| 3255 Tamara Dr #4 Naples, FL | 3.0 | 2.5 | 1437 | $2,500 | $1.74 | 15d | 1 | 0.13mi |
| 5301 Summerwind Dr Naples, FL | 1.0–2.0 | 1.0–2.0 | 836 | $1,864 | $2.23 | 15d | 12 | 0.35mi |
| 3105 La Costa Cir Naples, FL | 1.0–3.0 | 1.0–2.0 | 1050 | $2,235 | $2.13 | 15d | 20 | 0.37mi |
| 12832 Brynwood Way Naples, FL | 3.0 | 2.0 | 1714 | $5,250 | $3.06 | 15d | 1 | 0.72mi |
| 12914 Brynwood Preserve Ln Naples, FL | 2.0 | 2.0 | 1720 | $7,000 | $4.07 | 25d | 1 | 0.74mi |
| 13466 Sumter Ln Naples, FL | 3.0 | 2.0 | 1837 | $8,700 | $4.74 | 25d | 1 | 0.80mi |
| 13441 Coronado Dr Naples, FL | 3.0 | 2.0 | 1837 | $10,000 | $5.44 | 25d | 1 | 0.82mi |
| 13435 Silktail Dr Naples, FL | 2.0 | 2.0 | 1837 | $8,950 | $4.87 | 25d | 1 | 0.85mi |
| 13423 Silktail Dr Naples, FL | 2.0 | 2.0 | 1831 | $2,200 | $1.20 | 25d | 1 | 0.86mi |
| 13379 Silktail Dr Naples, FL | 3.0 | 2.0 | 1837 | $4,400 | $2.40 | 25d | 1 | 0.91mi |
| 6654 Tannin Ln Unit B Naples, FL | 2.0 | 2.0 | 1441 | $3,100 | $2.15 | 25d | 1 | 0.92mi |
| 1860 Bald Eagle Dr Unit 403B Naples, FL | 2.0 | 2.0 | 1325 | $3,000 | $2.26 | 15d | 1 | 0.93mi |
| 2602 Fountain View Cir Naples, FL | 1.0–2.0 | 1.0–2.0 | 995 | $2,277 | $2.29 | 15d | 41 | 0.93mi |
| 1105 Reserve Ct #206 Naples, FL | 2.0 | 2.0 | 1100 | $2,000 | $1.82 | 15d | 1 | 0.96mi |
| 1105 Reserve Ct #307 Naples, FL | 3.0 | 2.0 | 1239 | $1,995 | $1.61 | 15d | 1 | 0.96mi |
| 1115 Reserve Ct Unit 2 Naples, FL | 2.0 | 2.0 | 1100 | $1,800 | $1.64 | 15d | 1 | 0.97mi |
| 1629 Spoonbill Ln Unit 1629-A Naples, FL | 2.0 | 2.0 | 1250 | $2,000 | $1.60 | 15d | 1 | 0.99mi |
| 1554 Oyster Catcher Pt Unit C Naples, FL | 2.0 | 2.0 | 1124 | $2,900 | $2.58 | 25d | 1 | 1.04mi |
| 1256 Carpazi Ct #502 Naples, FL | 3.0 | 2.0 | 1744 | $2,495 | $1.43 | 25d | 1 | 1.05mi |
| 1256 Carpazi Ct Unit 502 Naples, FL | 3.0 | 2.0 | 1744 | $2,495 | $1.43 | 15d | 1 | 1.05mi |
| 501 Forest Lakes Blvd #111 Naples, FL | 2.0 | 2.0 | 919 | $2,300 | $2.50 | 15d | 1 | 1.08mi |
| 1545 Oyster Catcher Pt Unit A Naples, FL | 2.0 | 2.0 | 1124 | $2,200 | $1.96 | 15d | 1 | 1.09mi |
| 1170 Reserve Way #205 Naples, FL | 2.0 | 1.0 | 894 | $1,700 | $1.90 | 25d | 1 | 1.15mi |
| 3308 Europa Dr #30 Naples, FL | 2.0 | 2.0 | 1205 | $5,500 | $4.56 | 25d | 1 | 1.16mi |
| 1180 Reserve Way Naples, FL | 1.0–2.0 | 1.0–2.0 | 912 | $1,990 | $2.18 | 15d | 3 | 1.16mi |
| 1180 Reserve Way Naples, FL | 1.0–2.0 | 1.0–2.0 | 954 | $2,000 | $2.10 | 25d | 2 | 1.16mi |
| 1205 Reserve Way #302 Naples, FL | 3.0 | 2.0 | 1239 | $2,300 | $1.86 | 15d | 1 | 1.17mi |
| 6941 Hunters Rd Naples, FL | 4.0 | 2.0 | 1866 | $7,500 | $4.02 | 25d | 1 | 1.19mi |
| 1235 Reserve Way #103 Naples, FL | 2.0 | 1.0 | 894 | $1,995 | $2.23 | 15d | 1 | 1.20mi |
| 1235 Reserve Way Naples, FL | 2.0 | 1.0 | 894 | $2,300 | $2.57 | 25d | 1 | 1.20mi |
| 499 Forest Lakes Blvd #105 Naples, FL | 2.0 | 2.0 | 919 | $1,950 | $2.12 | 15d | 1 | 1.20mi |
| 1350 Misty Pines Cir Unit E-204 Naples, FL | 2.0 | 2.0 | 1200 | $7,500 | $6.25 | 15d | 1 | 1.20mi |
| 1220 Reserve Way #305 Naples, FL | 2.0 | 2.0 | 1059 | $1,950 | $1.84 | 25d | 1 | 1.21mi |
| 1190 Reserve Way #304 Naples, FL | 2.0 | 2.0 | 1059 | $2,900 | $2.74 | 25d | 1 | 1.21mi |
| 1299 Verde Dr Unit 1503 Naples, FL | 3.0 | 2.0 | 1744 | $4,200 | $2.41 | 15d | 1 | 1.23mi |
HOA detail condo
- Monthly dues
- $687 · $8,244/yr
- Assessments
- None detected in remarks — confirm with the listing agent.
Listing history 13 events
-
2026-06-21days on market $320,000 Active 33 DOM
-
2026-06-18days on market $320,000 Active 30 DOM
-
2026-06-17days on market $320,000 Active 29 DOM
-
2026-06-16days on market $320,000 Active 28 DOM
-
2026-06-15days on market $320,000 Active 27 DOM
-
2026-06-14days on market $320,000 Active 25 DOM
-
2026-06-10days on market $320,000 Active 22 DOM
-
2026-06-09days on market $320,000 Active 21 DOM
-
2026-06-08days on market $320,000 Active 20 DOM
-
2026-06-07days on market $320,000 Active 19 DOM
-
2026-06-03days on market $320,000 Active 15 DOM
-
2026-06-03remarks 600-char remark
-
2026-06-03$320,000 Active 14 DOM
ⓘ Source: listings_history table (triggers on properties + properties_extension) + one-shot
backfill from property_details.listing_events for pre-trigger history.
Tax reassessment forecast FL · Resets to sale price
- Current annual tax
- $1,101 · $92/mo
- Projected year-2 tax
- $2,656 · $221/mo
- Expected delta
- +$1,555/yr (+$130/mo · 141.2%)
ⓘ Screening estimate from a state-policy table — verify with the county assessor before closing.
Climate risk First Street
- Flood 6/10 Major FEMA zone X (unshaded) · 72% chance over 30 yrs
- Wildfire 1/10 Low
- Heat 10/10 Extreme 7 d/yr ≥107°F today · 30 d/yr by 30 yrs out
- Wind 10/10 Extreme 99% chance of damaging wind over 30 yrs
- Air quality 2/10 Low 2 unhealthy d/yr today · 2 by 30 yrs out
Nearby sold comps map
Loading sold comps map…
Walkable amenities ~0.75 mi
Loading nearby amenities…
Taxation est. · year 1
- Rental income
- $35,585
- − Mortgage interest
- −$17,925
- − Property taxes
- −$1,101
- − Insurance
- −$1,600
- − Repairs & maintenance
- −$2,847
- − Management
- −$2,847
- − HOA
- −$8,244
- − Depreciation
- −$9,309
- Taxable loss
- −$8,288
- Est. tax savings @ 24.0%
- +$1,989
- After-tax cash flow
- $-982/yr
For passive investors: Depreciation is non-cash, so a rental often shows a tax loss while cash-flowing — sheltering income. Rental losses are passive: they offset passive income freely, and up to $25,000/yr can offset ordinary (W-2) income if you actively participate and your MAGI is under $100k (phasing out to $0 by $150k); unused losses carry forward. On sale, claimed depreciation is recaptured at up to 25%, and gains may owe capital-gains tax (a 1031 exchange can defer both). Figures are a year-1 estimate at your 24.0% rate — not tax advice; consult a CPA.
Schools (NCES district)
- District
- Collier
- NCES district ID
- 1200330
- Math proficiency
- 60% ▼ -4.00%
- Reading proficiency
- 56% ▼ -2.00%
- Median HH income
- $58,275
- Composite
- 50.23/100
- National rank
- #1892
- State rank
- #16 of 73 in FL
Livability — Vineyards
- Score
- 64/100
- State rank
- #679
- US rank
- #14101
Category grades
Schools grade is shown separately in the Schools card above.
Census & demographics
- County
- Collier County · 396,295 people
- Metro
- Naples-Marco Island, FL
- Population (ZIP)
- 27,273
- Household income
- $92,259
- Rent vs Own
- Severe rent burden
- 1712.0
Population outlook (Collier County) Hauer SSP2
- Today (2025)
- 420,858 people
- By 2030
- 450,054 · +6.9%
- By 2040
- 502,232 · +19.3%
- By 2050
- 544,932 · +29.5%
- By 2075
- 627,203 · +49.0%
- By 2100
- 659,015 · +56.6%
Race, ethnicity, and origin ACS 2023
- Neighborhood character
- Predominantly White (78%)
- Race & ethnicity
- White 78% Hispanic / Latino 11% Two or more races 9% Black 4% Asian 4%
- Hispanic origin (detail)
- Mexican 1% Puerto Rican 1% Cuban 3%
- Common ancestry
- Romanian 5% Scotch-Irish 3% Lithuanian 2%
- Foreign-born
- 20% · Canada, Jamaica, Vietnam
- Languages at home
- 77% English-only · Spanish 10% Other Indo-European 5% Russian/Polish/Slavic 3%
Political lean MEDSL · Collier
- 2024 margin
- Solid R (+33.1) · D 33.1% · R 66.2%
- 2008→2024 swing
- -10.6pp toward R · 2008: -22.5pp · 2024: -33.1pp
- All cycles
- 2024: R+33.1 2020: R+24.7 2016: R+26.0 2012: R+30.1 2008: R+22.5
Not yet ingested
- Civics
- —
Market trends
- HPI YoY
- ▲ 0.29%
- Current HPI
- 279.357
- Rent YoY
- ▲ 0.92%
- Metro
- Naples-Marco Island, FL
- State GDP YoY
- ▲ 3.28%
- F500 in state
- 36
Industry mix (Fortune 500 HQ in FL)
| Industry | F500 HQs | Revenue |
|---|---|---|
| Industrial Technology | 2 | $29B |
|
||
| Insurance | 2 | $17B |
|
||
| Retail | 1 | $60B |
|
||
| Technology Distribution | 1 | $58B |
|
||
| Homebuilding | 1 | $35B |
|
||
| Technology Manufacturing | 1 | $35B |
|
||
Price history
+151.0% since first listed3 events — show timeline
- 2026-05-19 Listed $320,000 NAPLESMLS
- 2013-04-29 Sold (MLS) $127,500 NAPLESMLS
- 2012-12-20 Listed $127,500 NAPLESMLS
Property tax history
+4.0%/yrLatest (2025): $1,101 · +2.8% YoY. Source: county tax records.
Cash-flow waterfall
monthlySold comps — $/sqft
last 12 mo · ≤1 miLoading sold comps…