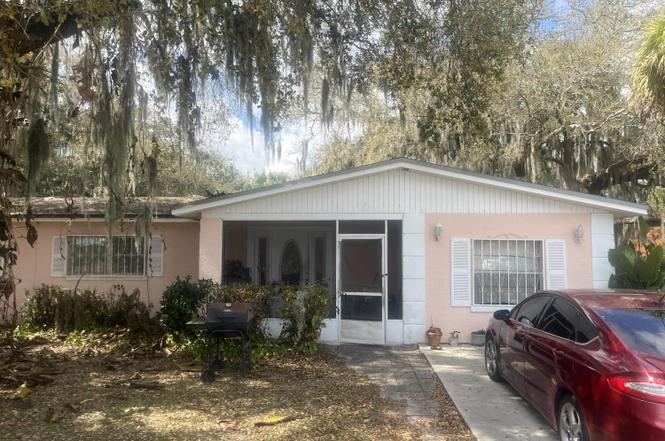
2307 N 45th St · Fort Pierce North, FL
Flood risk 1/10 · Minimal
- FEMA flood zone
- X (unshaded)
- Chance of flooding over 30 yrs
- 0.0%
- Est. flood insurance / yr
- $507 – $1,088
Fire risk 3/10 · Minor
- Est. fire insurance / yr
- $947 – $1,759
Heat risk 10/10 · Severe
- Hot days now (above 107°F)
- 7 days/yr
- Hot days in 30 yrs
- 24 days/yr
Wind risk 10/10 · Severe
- Chance of severe wind over 30 yrs
- 99.0%
Air-quality risk 1/10 · Minimal
- Unhealthy air days now
- 0 days/yr
- Unhealthy air days in 30 yrs
- 0 days/yr
Risk factors via First Street. Map © Google.
Why this score? — see what drove the C grade
The composite is a weighted blend of 9 inputs, each scored 0–100. Each bar is that input's sub-score; the figure is the points it added to the 100-point composite (weight × sub-score).
- Cash flow +14.6/30.0
- ARV discount +13.6/15.0
- Appreciation +8.0/10.0
- DSCR +4.5/10.0
- 1% rule +3.9/10.0
- Schools +3.7/10.0
- Livability +3.5/5.0
- Rent growth +2.5/5.0
- Condition / age +2.5/5.0
$239,000
🖨 Deal sheet 📄 Offer letter ✓ Due diligence
Listing remarks
This home features 3 bedrooms, 1 full bathroom, and 1 half bathroom. It is vacant and on lockbox, Perfect for handyman and or investors alike. Great location, just minutes from Fort Pierce Beach and excellent local restaurants.
Key facts
- 0.29 acre lot
- Built 1973
- Listed 119 days
Tags
Property features AI
Finance
- Other: Resale condition; Pets allowed with no restrictions
Exterior
- Utilities: Three-phase electric
- Home design: Single-family residence; One story; Faces northeast
- Construction: Concrete/CBS construction
- Exterior features: Not waterfront
Interior
- Bedrooms: One bedroom on the main level
- Bathrooms: One full bathroom; One half bathroom; Two total bathrooms
- Heating & cooling: Central heating
- Interior features: Unfurnished
Neighborhood map
What this means for you Summary
Snapshot
- This is a 3-bed/1.5-bath single-family listed at $239k.
Deal economics
- At list price, monthly cash flow is $58 ($699/yr) — positive.
- The deal already cash-flows at list — no discount required.
- To meet the 1% rule (rent ≥ 1% of price), the offer needs to be $212k (11.4% below list).
- Recommended offer: $212k (11.4% below list) — sets the bar for 1% rule.
- Cap rate 6.6% vs local median 5.1% in Fort Pierce North — meaningfully above typical; check what's discounted (condition, days-on-market, listing class) to confirm the premium yield is real.
Location & tenants
- Location reads 69/100 on livability (#480 in FL) — a middle-class / working-renter tenant base. Strengths: commute A+, cost of living A+, housing A+; Watch: schools F, amenities F, employment F.
- St. Lucie (urban): math 40% / reading 48% proficiency, ranked #51 of 73 in FL (top 70%) — families likely to look elsewhere, expect single-tenant / working-renter base with shorter leases.
- Market conditions: 133 active listings in the ZIP; 7 comparable units currently listed for rent nearby; rentals at typical pace (median 24d on market — plan ~3-4 weeks tenant-placement turnaround); 4,868 units permitted in St. Lucie County in 2024 (268 in 5+ unit buildings).
Forward outlook
- In year one you build about $16k of equity ($2k loan paydown + $14k appreciation (5.9% local appreciation)).
- St. Lucie County population projected at +20% by 2050 — long-run rental-demand tailwind backs the buy-and-hold thesis.
- At projected returns (5.9% appreciation + 3.0% rent growth), your $67k cash investment doubles in ~4 years — after that, you're playing with house money.
- By year 3, paydown + projected appreciation supports a ~$39k cash-out refi (75% LTV) — recoverable capital for the next deal without selling this one.
Negotiation context
- It's been on market 119 days — a 9% lower offer ($217k) is reasonable based on typical stale-listing flexibility.
- Current owner paid $35k; list at $239k implies a 585% gain — meaningful room to come down on a strong offer.
Risks & watch-outs
- Climate carrying-cost: severe wind risk, 99% chance of damaging wind over 30y; extreme-heat days projected 7→24/yr by 2055 (HVAC capex compounding) — expect insurance premiums to compound above CPI over the hold.
Questions for the listing agent
- It's been on market 119 days. Have you received any prior offers? Is the seller open to a 11% concession, seller financing, or rate buy-down credit?
- Built in 1973 — when were the roof, HVAC, electrical panel, plumbing, and water heater last replaced?
- Why hasn't it sold? Are there any deal-killer items the seller is aware of (foundation, flood, title, zoning, code violations)?
- Is there a deadline driving the sale (1031 exchange, divorce, estate, relocation)? That informs how much negotiation room exists.
- Schools are F-rated, which usually means shorter tenancies and higher turnover. Who's the typical renter profile here, and what's been the actual vacancy rate?
- What's the average days-on-market for RENTAL listings here right now (not sales)? A rising rental-DOM trend means longer vacancies and softer asking-rent achievability than the comps imply.
- What's the recent tenant-quality profile in this submarket — average credit score on applications, eviction rate, late-payment / NSF rate, and stable-employment percentage? A property-management company in the area should have these aggregated.
- How much new for-sale + rental construction is in the pipeline within 1–3 miles? Heavy new supply typically softens prices + rents 12–24 months out; constrained supply supports both.
Investment metrics
- 1% rule
- 0.89% ✗
- Cap rate
- 6.59%
- Cash-on-cash
- 1.04%
- DSCR
- 1.05
- GRM
- 9.4
CMA / ARV
- ARV (on-the-fly)
- $276,800
- Comps found
- 3
Show comp detail 3 sales within ~0.75 mi
| Address | Dist | Beds/Ba | Sqft | Sold | Price | $/sf | Match |
|---|---|---|---|---|---|---|---|
| 2311 N 42nd St | 0.19mi | 3/1.5 | 1,455 (+5%) | 23mo | $175,300 | $120 | 63 |
| 4504 Matanzas Ave | 0.13mi | 2/2.0 (-1) | 1,292 (-7%) | 21mo | $294,000 | $228 | 59 |
| 2011 N 51st Ct | 0.53mi | 3/2.0 | 1,248 (-10%) | 7mo | $250,000 | $200 | 51 |
Match score weights: distance 35% · size 25% · config 20% · recency 20%. Top-matched comps best support the ARV.
Projected returns pro-forma
5.92% appreciation · 3.0% rent growth · sell at horizon
- IRR
- 16.0%
- Equity multiple
- 2.07×
- Total profit
- $71,599
- Equity at exit
- $149,049
- IRR
- 16.0%
- Equity multiple
- 4.11×
- Total profit
- $208,015
- Equity at exit
- $269,265
Cash invested: $66,920 (down + closing). Projections, not guarantees.
Landlord ↔ Tenant lean methodology
- Overall (STATE)
- 87 Strongly Landlord-Friendly
- State Florida
- 87 Strongly Landlord-Friendly · R+3
- County
- — inherits STATE
- City
- — inherits STATE
ZIP-level market 34946
- Home prices YoY
- 1.7%
- Active inventory
- 133
- Price-to-rent
- 9.4×
Monthly cashflow live
- Estimated rent
- $2,118 high interval (Pro) →
- Mortgage (P&I)
- −$1,253
- Tax from tax record
- −$262 /mo · $3,142/yr
- Insurance
- −$100
- HOA
- −$0
- Vacancy / Maint / Mgmt
- −$445
- Net cashflow
- $58
Break-even live
UW: 25.0% down · 7.5% · 30yr · 1.5% tax · 5.0% vac · 8.0% maint · 8.0% mgmt
Financing live
Cash to close
- Down payment
- $59,750
- Closing costs
- $7,170
- Reserves months
- —
- Total cash needed
- —
Loan-product check · same deal, 3 products live
Conventional
25% down · 7.5% · 30yr
- Down + closing
- —
- Monthly P&I
- —
- Monthly cashflow
- —
- DSCR
- —
- Eligible?
- —
Personal DTI + credit; lowest rate.
DSCR
20% down · 8.5% · 30yr
- Down + closing
- —
- Monthly P&I
- —
- Monthly cashflow
- —
- DSCR
- —
- Eligible?
- —
No personal income docs; deal must DSCR.
Hard money
10% down · 12.0% · 12mo
- Down + closing
- —
- Monthly P&I
- —
- Monthly cashflow
- —
- DSCR
- —
- Eligible?
- —
Short-term bridge; refi at stabilization.
Rent comps 7 comps
| Address | Beds | Baths | Sqft | Rent | $/sqft | DOM | Units | Dist |
|---|---|---|---|---|---|---|---|---|
| 2007 N 49th St Fort Pierce, FL | 4.0 | 2.5 | 1450 | $2,399 | $1.65 | 14d | 1 | 0.45mi |
| 113 Hilton Dr Fort Pierce, FL | 4.0 | 1.0 | 1160 | $2,000 | $1.72 | 23d | 1 | 0.78mi |
| 3101 Avenue T Fort Pierce, FL | 2.0 | 2.0 | 1064 | $1,980 | $1.86 | 23d | 1 | 0.94mi |
| 4005 Avenue I Unit A Fort Pierce, FL | 2.0 | 1.0 | 880 | $1,600 | $1.82 | 23d | 1 | 1.12mi |
| 4005 Avenue I Unit A Fort Pierce, FL | 2.0 | 1.0 | 880 | $1,600 | $1.82 | 14d | 1 | 1.12mi |
| 107 Bedford Dr Fort Pierce, FL | 4.0 | 1.5 | 1362 | $2,400 | $1.76 | 23d | 1 | 1.15mi |
| 2809 Jefferson Pkwy Unit A Fort Pierce, FL | 3.0 | 1.0 | 1350 | $2,100 | $1.56 | 14d | 1 | 1.36mi |
Listing history 18 events
-
2026-06-18days on market $239,000 Active 119 DOM
-
2026-06-17days on market $239,000 Active 118 DOM
-
2026-06-16days on market $239,000 Active 117 DOM
-
2026-06-15days on market $239,000 Active 116 DOM
-
2026-06-14days on market $239,000 Active 114 DOM
-
2026-06-13days on market $239,000 Active 113 DOM
-
2026-06-10days on market $239,000 Active 111 DOM
-
2026-06-09days on market $239,000 Active 110 DOM
-
2026-06-08days on market $239,000 Active 109 DOM
-
2026-06-07days on market $239,000 Active 108 DOM
-
2026-06-05days on market $239,000 Active 105 DOM
-
2026-06-03days on market $239,000 Active 104 DOM
-
2026-06-02days on market $239,000 Active 103 DOM
-
2026-06-01days on market $239,000 Active 102 DOM
-
2026-05-31days on market $239,000 Active 101 DOM
-
2026-05-30days on market $239,000 Active 100 DOM
-
2026-02-19$239,000 Active
-
1980-12-01soldstatus $34,900
ⓘ Source: listings_history table (triggers on properties + properties_extension) + one-shot
backfill from property_details.listing_events for pre-trigger history.
Tax reassessment forecast FL · Resets to sale price
- Current annual tax
- $3,142 · $262/mo
- Projected year-2 tax
- $3,142 · $262/mo
- Expected delta
- $0/yr ($0/mo · 0.0%)
ⓘ Screening estimate from a state-policy table — verify with the county assessor before closing.
Climate risk First Street
- Flood 1/10 Low FEMA zone X (unshaded) · 0% chance over 30 yrs
- Wildfire 3/10 Moderate
- Heat 10/10 Extreme 7 d/yr ≥107°F today · 24 d/yr by 30 yrs out
- Wind 10/10 Extreme 99% chance of damaging wind over 30 yrs
- Air quality 1/10 Low 0 unhealthy d/yr today · 0 by 30 yrs out
Nearby sold comps map
Loading sold comps map…
Walkable amenities ~0.75 mi
Loading nearby amenities…
Taxation est. · year 1
- Rental income
- $25,412
- − Mortgage interest
- −$13,388
- − Property taxes
- −$3,142
- − Insurance
- −$1,195
- − Repairs & maintenance
- −$2,033
- − Management
- −$2,033
- − Depreciation
- −$6,953
- Taxable loss
- −$3,331
- Est. tax savings @ 24.0%
- +$799
- After-tax cash flow
- $1,498/yr
For passive investors: Depreciation is non-cash, so a rental often shows a tax loss while cash-flowing — sheltering income. Rental losses are passive: they offset passive income freely, and up to $25,000/yr can offset ordinary (W-2) income if you actively participate and your MAGI is under $100k (phasing out to $0 by $150k); unused losses carry forward. On sale, claimed depreciation is recaptured at up to 25%, and gains may owe capital-gains tax (a 1031 exchange can defer both). Figures are a year-1 estimate at your 24.0% rate — not tax advice; consult a CPA.
Schools (NCES district)
- District
- St. Lucie
- NCES district ID
- 1201770
- Math proficiency
- 40% ▼ -11.00%
- Reading proficiency
- 48% ▼ -4.00%
- Median HH income
- $44,737
- Composite
- 37.28/100
- National rank
- #4449
- State rank
- #51 of 73 in FL
Livability — Fort Pierce North
- Score
- 69/100
- State rank
- #480
- US rank
- #8764
Category grades
Schools grade is shown separately in the Schools card above.
Census & demographics
- Census place
- Fort Pierce North, FL
- Population (ZIP)
- 6,588
Population outlook (St. Lucie County) Hauer SSP2
- Today (2025)
- 338,016 people
- By 2030
- 355,687 · +5.2%
- By 2040
- 385,521 · +14.1%
- By 2050
- 406,106 · +20.1%
- By 2075
- 441,054 · +30.5%
- By 2100
- 436,885 · +29.2%
Race, ethnicity, and origin ACS 2023
- Neighborhood character
- Diverse neighborhood (Simpson 0.68)
- Race & ethnicity
- Black 36% Hispanic / Latino 34% White 26% Two or more races 18% Native American 4% Asian 1%
- Hispanic origin (detail)
- Mexican 16% Puerto Rican 2% Cuban 2% Salvadoran 1%
- Common ancestry
- Lithuanian 1% Slovak 1% Portuguese 1%
- Foreign-born
- 25% · Canada, Dominican Republic
- Languages at home
- 70% English-only · Spanish 28% Other Indo-European 1%
Political lean MEDSL · St. Lucie
- 2024 margin
- Lean R (+9.1) · D 45.1% · R 54.2%
- 2008→2024 swing
- -21.2pp toward R · 2008: 12.1pp · 2024: -9.1pp
- All cycles
- 2024: R+9.1 2020: R+1.6 2016: R+2.5 2012: D+7.9 2008: D+12.1
Not yet ingested
- Civics
- —
Market trends
- HPI YoY
- ▲ 5.92%
- Current HPI
- 351.3324
- Rent YoY
- —
- Metro
- —
- State GDP YoY
- ▲ 3.28%
- F500 in state
- 36
Industry mix (Fortune 500 HQ in FL)
| Industry | F500 HQs | Revenue |
|---|---|---|
| Industrial Technology | 2 | $29B |
|
||
| Insurance | 2 | $17B |
|
||
| Retail | 1 | $60B |
|
||
| Technology Distribution | 1 | $58B |
|
||
| Homebuilding | 1 | $35B |
|
||
| Technology Manufacturing | 1 | $35B |
|
||
Price history
+584.8% since first listed2 events — show timeline
- 2026-02-19 Listed $239,000 Beaches MLS
- 1980-12-01 Sold (Public Records) $34,900 Public Records
Property tax history
+7.4%/yrLatest (2025): $3,142 · +15.7% YoY. Source: county tax records.
Cash-flow waterfall
monthlySold comps — $/sqft
last 12 mo · ≤1 miLoading sold comps…