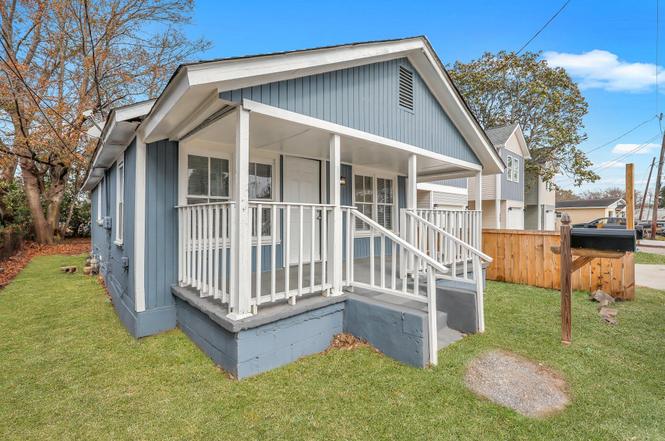
1984 Hugo Ave · North Charleston, SC
Flood risk 5/10 · Moderate
- FEMA flood zone
- X (shaded)
- Chance of flooding over 30 yrs
- 0.24%
- Est. flood insurance / yr
- $507 – $1,088
Fire risk 3/10 · Minor
- Est. fire insurance / yr
- $783 – $1,453
Heat risk 10/10 · Severe
- Hot days now (above 105°F)
- 7 days/yr
- Hot days in 30 yrs
- 18 days/yr
Wind risk 9/10 · Severe
- Chance of severe wind over 30 yrs
- 99.0%
Air-quality risk 3/10 · Minor
- Unhealthy air days now
- 3 days/yr
- Unhealthy air days in 30 yrs
- 3 days/yr
Risk factors via First Street. Map © Google.
Why this score? — see what drove the C grade
The composite is a weighted blend of 9 inputs, each scored 0–100. Each bar is that input's sub-score; the figure is the points it added to the 100-point composite (weight × sub-score).
- Cash flow +18.4/30.0
- ARV discount +15.0/15.0
- DSCR +5.8/10.0
- Schools +4.3/10.0
- Rent growth +4.1/5.0
- 1% rule +3.8/10.0
- Livability +3.3/5.0
- Condition / age +2.5/5.0
- Appreciation +0.0/10.0
$209,000
🖨 Deal sheet (PDF) 📄 Offer letter ✓ Due diligence
Listing remarks
Welcome home to this recently updated 3-bedroom, 1-bathroom home, conveniently located near major highways, I-526 and I-26, for easy commuting, dining, and local activities. Step inside to a bright and inviting living room that seamlessly flows into the kitchen and bedroom areas. The updated kitchen features sleek stainless steel appliances, granite countertops, stylish tile backsplash, and modern lighting. The bathroom has been refreshed with a new vanity and upgraded plumbing fixtures. With thoughtful updates throughout, this home is move-in ready. Don't miss this opportunity--schedule your showing today!
Key facts
- New vanity
- Updated kitchen
- Granite countertops
Tags
Property features AI
Exterior
- Parking: Off-street parking
- Utilities: Public sewer; Charleston Water Service; Dominion Energy
- Home design: Single-family detached; One level
- Construction: Residential property
- Exterior features: Asphalt roof
Interior
- Kitchen: Dishwasher; Electric range; Microwave
- Bedrooms: 3 bedrooms; Master bedroom with ceiling fan
- Flooring: Luxury vinyl
- Bathrooms: 1 bathroom
- Interior features: Ceiling fan(s); Family room; Formal living; See remarks
- Laundry & utility: Washer hookup
Neighborhood map
What this means for you Summary
Snapshot
- This is a 3-bed/1.0-bath single-family listed at $209k.
Deal economics
- At list price, monthly cash flow is $194 ($2k/yr) — positive.
- The deal already cash-flows at list — no discount required.
- To meet the 1% rule (rent ≥ 1% of price), the offer needs to be $185k (11.6% below list).
- Recommended offer: $184k (12.0% below list) — sets the bar for market timing.
- Cap rate 7.4% vs local median 4.0% in North Charleston — top-decile yield for the area; either an underpriced asset or a hidden risk that comps aren't pricing in. Stress-test before assuming the spread holds.
Location & tenants
- Location reads 66/100 on livability (#122 in SC) — a middle-class / working-renter tenant base. Strengths: housing A+, health & safety A+, cost of living A; Watch: employment C-, crime F, amenities F.
- Charleston 01 (urban): math 48% / reading 53% proficiency, ranked #7 of 80 in SC (top 9%) — acceptable for families but not a draw, mixed tenant base, ~2y average lease.
- Zoned schools: Chicora Elementary (math 9% / reading 5%, grade F, #596 of 597 statewide, top 100%, 320 students, 100% FRL); Morningside Middle (math 4% / reading 12%, grade F, #226 of 229 statewide, top 99%, 567 students, 100% FRL); North Charleston High (math 27% / reading 57%, grade F, #174 of 196 statewide, top 90%, 768 students, 100% FRL) — zoned schools average 100% FRL vs 44% district-wide (56 pts higher); higher-poverty schools than district average — tighter screening recommended.
- Zoned-school proficiency averages 19% at this address vs 50% district-wide (-32 pts) — the specific schools serving this property underperform the Charleston 01 average; the district grade overstates school quality for this exact location.
- Market conditions: Rents rising fast (+6.4%/yr); 205 active listings in the ZIP; 17 comparable units currently listed for rent nearby; rentals at typical pace (median 21d on market — plan ~3-4 weeks tenant-placement turnaround); 4,156 units permitted in Charleston County in 2024 (857 in 5+ unit buildings).
- This rent runs 39% of the median local income ($57k/yr) — at the standard rent-burdened threshold; future hikes will face affordability resistance.
Forward outlook
- Local home prices are declining (-3.0%/yr); year-one equity from $1k of loan paydown is wiped out by about $6k of value loss. Plan a longer hold.
- Charleston County population projected at +44% by 2050 — long-run rental-demand tailwind backs the buy-and-hold thesis.
Negotiation context
- It's been on market 490 days — a 12% lower offer ($184k) is reasonable based on typical stale-listing flexibility.
- 4 sale attempts; this cycle's ask has dropped $18k (8%) from the opening price — seller is motivated, your offer sets the floor, not the list.
Risks & watch-outs
- Watch-outs: built in 1934 — expect roof / HVAC / electrical / plumbing capex.
- Climate carrying-cost: moderate flood risk; severe wind risk, 99% chance of damaging wind over 30y; extreme-heat days projected 7→18/yr by 2055 (HVAC capex compounding) — expect insurance premiums to compound above CPI over the hold.
Questions for the listing agent
- It's been on market 490 days. Have you received any prior offers? Is the seller open to a 12% concession, seller financing, or rate buy-down credit?
- Built in 1934 — when were the roof, HVAC, electrical panel, plumbing, and water heater last replaced?
- Why hasn't it sold? Are there any deal-killer items the seller is aware of (foundation, flood, title, zoning, code violations)?
- Is there a deadline driving the sale (1031 exchange, divorce, estate, relocation)? That informs how much negotiation room exists.
- Crime grade is F in this area — have there been break-ins, vandalism, or insurance claims at this property in the last 3 years? What carrier currently insures it and at what premium?
- What's the average days-on-market for RENTAL listings here right now (not sales)? A rising rental-DOM trend means longer vacancies and softer asking-rent achievability than the comps imply.
- What's the recent tenant-quality profile in this submarket — average credit score on applications, eviction rate, late-payment / NSF rate, and stable-employment percentage? A property-management company in the area should have these aggregated.
- How much new for-sale + rental construction is in the pipeline within 1–3 miles? Heavy new supply typically softens prices + rents 12–24 months out; constrained supply supports both.
Investment metrics
- 1% rule
- 0.88% ✗
- Cap rate
- 7.41%
- Cash-on-cash
- 3.97%
- DSCR
- 1.18
- GRM
- 9.4
CMA / ARV
- ARV (on-the-fly)
- $299,460
- Comps found
- 12
Show comp detail 12 sales within ~0.75 mi
| Address | Dist | Beds/Ba | Sqft | Sold | Price | $/sf | Match |
|---|---|---|---|---|---|---|---|
| 2021 Comstock Ave | 0.21mi | 2/2.5 (-1) | 952 (-1%) | 3mo | $295,000 | $310 | 74 |
| 2042 Arbutus Ave | 0.29mi | 2/2.5 (-1) | 952 (-1%) | 6mo | $295,000 | $310 | 68 |
| 2023 Comstock Ave | 0.21mi | 2/2.5 (-1) | 952 (-1%) | 13mo | $270,000 | $284 | 66 |
| 1990 Comstock Ave | 0.20mi | 2/2.5 (-1) | 1,050 (+9%) | 2mo | $195,000 | $186 | 64 |
| 2021 Arbutus Ave | 0.26mi | 2/2.5 (-1) | 952 (-1%) | 13mo | $290,000 | $305 | 64 |
| 2011 Hugo Ave | 0.08mi | 2/2.0 (-1) | 861 (-11%) | 10mo | $290,000 | $337 | 61 |
| 2037 Arbutus Ave | 0.27mi | 2/2.5 (-1) | 952 (-1%) | 16mo | $300,000 | $315 | 60 |
| 1995 Forest Ave | 0.08mi | 3/2.5 | 1,040 (+8%) | 21mo | $327,000 | $314 | 60 |
| 2045 Arbutus Ave | 0.28mi | 2/2.5 (-1) | 952 (-1%) | 19mo | $295,000 | $310 | 57 |
| 2025 Forest Ave | 0.13mi | 4/1.5 (+1) | 1,056 (+9%) | 18mo | $262,000 | $248 | 56 |
| 1912 Doscher Ave | 0.51mi | 3/2.0 | 1,050 (+9%) | 15mo | $355,000 | $338 | 45 |
| 1850 Meeting St Rd Unit C | 0.62mi | 2/1.0 (-1) | 840 (-13%) | 2mo | $150,000 | $179 | 42 |
Match score weights: distance 35% · size 25% · config 20% · recency 20%. Top-matched comps best support the ARV.
Projected returns pro-forma
-3.0% appreciation · 6.36% rent growth · sell at horizon
- IRR
- -6.8%
- Equity multiple
- 0.74×
- Total profit
- $-15,160
- Equity at exit
- $31,163
- IRR
- 6.2%
- Equity multiple
- 1.53×
- Total profit
- $30,724
- Equity at exit
- $18,071
Cash invested: $58,520 (down + closing). Projections, not guarantees.
Landlord ↔ Tenant lean methodology
- Overall (STATE)
- 90 Strongly Landlord-Friendly
- State South Carolina
- 90 Strongly Landlord-Friendly · R+6
- County
- — inherits STATE
- City
- — inherits STATE
ZIP-level market 29405
- Home prices YoY
- -29.0%
- Rents YoY
- 6.4%
- Active inventory
- 205
- Price-to-rent
- 9.4×
Monthly cashflow live
- Estimated rent
- $1,847 high interval (Pro) →
- Mortgage (P&I)
- −$1,096
- Tax from tax record
- −$82 /mo · $984/yr
- Insurance
- −$87
- HOA
- −$0
- Vacancy / Maint / Mgmt
- −$388
- Net cashflow
- $194
Break-even live
Sensitivity live
| Price | -10% $312 | -5% $253 | +0% $194 | +5% $135 | +10% $75 |
|---|---|---|---|---|---|
| Rent | -10% $48 | -5% $121 | +0% $194 | +5% $267 | +10% $340 |
| Rate | -1.0pp $299 | -0.5pp $247 | base $194 | +0.5pp $140 | +1.0pp $84 |
UW: 25.0% down · 7.5% · 30yr · 1.5% tax · 5.0% vac · 8.0% maint · 8.0% mgmt
Financing live
Cash to close
- Down payment
- $52,250
- Closing costs
- $6,270
- Reserves months
- —
- Total cash needed
- —
Loan-product check · same deal, 3 products live
Conventional
25% down · 7.5% · 30yr
- Down + closing
- —
- Monthly P&I
- —
- Monthly cashflow
- —
- DSCR
- —
- Eligible?
- —
Personal DTI + credit; lowest rate.
DSCR
20% down · 8.5% · 30yr
- Down + closing
- —
- Monthly P&I
- —
- Monthly cashflow
- —
- DSCR
- —
- Eligible?
- —
No personal income docs; deal must DSCR.
Hard money
10% down · 12.0% · 12mo
- Down + closing
- —
- Monthly P&I
- —
- Monthly cashflow
- —
- DSCR
- —
- Eligible?
- —
Short-term bridge; refi at stabilization.
Rent comps 17 comps
| Address | Beds | Baths | Sqft | Rent | $/sqft | DOM | Units | Dist |
|---|---|---|---|---|---|---|---|---|
| 2041 Groveland Ave North Charleston, SC | 2.0 | 1.0 | 1080 | $2,200 | $2.04 | 16d | 1 | 0.19mi |
| 1971 Beech Ave North Charleston, SC | 2.0 | 1.0 | 738 | $1,500 | $2.03 | 22d | 1 | 0.20mi |
| 1969 Beech Ave North Charleston, SC | 2.0 | 1.0 | 759 | $1,500 | $1.98 | 4d | 1 | 0.20mi |
| 2229 Delano St Unit B Charleston, SC | 2.0 | 1.0 | 750 | $1,250 | $1.67 | 13d | 1 | 0.57mi |
| 2023 Four Mile Ln North Charleston, SC | 3.0 | 2.0 | 1104 | $2,300 | $2.08 | 16d | 1 | 0.62mi |
| 2716 Sunrise St Unit 2 North Charleston, SC | 2.0 | 1.0 | 750 | $1,500 | $2.00 | 25d | 1 | 0.77mi |
| 1941 Clements Ave North Charleston, SC | 4.0 | 2.0 | 984 | $2,200 | $2.24 | 25d | 1 | 0.83mi |
| 1819 English St Unit A North Charleston, SC | 2.0 | 1.0 | 900 | $1,250 | $1.39 | 16d | 1 | 0.96mi |
| 1920 Token St Unit D North Charleston, SC | 2.0 | 1.0 | 637 | $975 | $1.53 | 25d | 1 | 1.08mi |
| 2150 Becker St North Charleston, SC | 3.0 | 1.5 | 1104 | $2,000 | $1.81 | 25d | 1 | 1.08mi |
| 1931 Baxter St North Charleston, SC | 3.0 | 1.0 | 984 | $1,550 | $1.58 | 4d | 1 | 1.10mi |
| 2245 Garfield St North Charleston, SC | 3.0 | 1.0 | 1035 | $1,700 | $1.64 | 25d | 1 | 1.30mi |
| 3119 Azalea Dr Unit N North Charleston, SC | 2.0 | 1.0 | 900 | $1,550 | $1.72 | 13d | 1 | 1.32mi |
| 3119 Azalea Dr North Charleston, SC | 2.0 | 1.0 | 900 | $1,550 | $1.72 | 25d | 1 | 1.33mi |
| 1914 Carlton St North Charleston, SC | 2.0 | 1.0 | 760 | $1,350 | $1.78 | 13d | 1 | 1.37mi |
| 1901 Success St North Charleston, SC | 3.0 | 2.0 | 1000 | $1,650 | $1.65 | 20d | 1 | 1.41mi |
| 1818 Leland St Unit A North Charleston, SC | 3.0 | 2.0 | 750 | $1,700 | $2.27 | 25d | 1 | 1.49mi |
Listing history 23 events
-
2026-06-22days on market $209,000 Active 490 DOM
-
2026-06-18days on market $209,000 Active 487 DOM
-
2026-06-17days on market $209,000 Active 486 DOM
-
2026-06-16days on market $209,000 Active 485 DOM
-
2026-06-15days on market $209,000 Active 484 DOM
-
2026-06-10days on market $209,000 Active 479 DOM
-
2026-06-09days on market $209,000 Active 478 DOM
-
2026-06-08days on market $209,000 Active 477 DOM
-
2026-06-07days on market $209,000 Active 476 DOM
-
2026-06-05days on market $209,000 Active 473 DOM
-
2026-06-03days on market $209,000 Active 472 DOM
-
2026-06-01days on market $209,000 Active 470 DOM
-
2026-05-31days on market $209,000 Active 469 DOM
-
2026-01-02status Active
-
2026-01-01historical
-
2025-11-04price $209,000
-
2025-07-25price $215,000
-
2025-05-23price $219,900
-
2025-03-24status Active
-
2025-03-12historical Active Under Contract
-
2025-03-12status Active
-
2025-02-05$227,500 Active
-
2019-01-30soldstatus $1,084,571
ⓘ Source: listings_history table (triggers on properties + properties_extension) + one-shot
backfill from property_details.listing_events for pre-trigger history.
Tax reassessment forecast SC · Resets to sale price
- Current annual tax
- $984 · $82/mo
- Projected year-2 tax
- $1,191 · $99/mo
- Expected delta
- +$207/yr (+$17/mo · 21.0%)
ⓘ Screening estimate from a state-policy table — verify with the county assessor before closing.
Climate risk First Street
- Flood 5/10 Major FEMA zone X (shaded) · 24% chance over 30 yrs
- Wildfire 3/10 Moderate
- Heat 10/10 Extreme 7 d/yr ≥105°F today · 18 d/yr by 30 yrs out
- Wind 9/10 Extreme 99% chance of damaging wind over 30 yrs
- Air quality 3/10 Moderate 3 unhealthy d/yr today · 3 by 30 yrs out
Nearby sold comps map
Loading sold comps map…
Walkable amenities ~0.75 mi
Loading nearby amenities…
Taxation est. · year 1
- Rental income
- $22,159
- − Mortgage interest
- −$11,707
- − Property taxes
- −$984
- − Insurance
- −$1,045
- − Repairs & maintenance
- −$1,773
- − Management
- −$1,773
- − Depreciation
- −$6,080
- Taxable loss
- −$1,203
- Est. tax savings @ 24.0%
- +$289
- After-tax cash flow
- $2,613/yr
For passive investors: Depreciation is non-cash, so a rental often shows a tax loss while cash-flowing — sheltering income. Rental losses are passive: they offset passive income freely, and up to $25,000/yr can offset ordinary (W-2) income if you actively participate and your MAGI is under $100k (phasing out to $0 by $150k); unused losses carry forward. On sale, claimed depreciation is recaptured at up to 25%, and gains may owe capital-gains tax (a 1031 exchange can defer both). Figures are a year-1 estimate at your 24.0% rate — not tax advice; consult a CPA.
Schools (NCES district)
- District
- Charleston 01
- NCES district ID
- 4501440
- Math proficiency
- 48% ▼ -2.00%
- Reading proficiency
- 53% ▬ 0.00%
- Median HH income
- $52,376
- Composite
- 43.41/100
- National rank
- #3018
- State rank
- #7 of 80 in SC
Livability — North Charleston
- Score
- 66/100
- State rank
- #122
- US rank
- #12222
Category grades
Schools grade is shown separately in the Schools card above.
Census & demographics
- Census place
- North Charleston, SC
- County
- Charleston County · 366,793 people
- City population
- 108,266
- Metro
- Charleston-North Charleston, SC
- Population (ZIP)
- 26,254
- Household income
- $56,600
- Rent vs Own
- Severe rent burden
- 1564.0
Population outlook (Charleston County) Hauer SSP2
- Today (2025)
- 480,562 people
- By 2030
- 525,921 · +9.4%
- By 2040
- 612,189 · +27.4%
- By 2050
- 691,627 · +43.9%
- By 2075
- 847,979 · +76.5%
- By 2100
- 926,482 · +92.8%
Race, ethnicity, and origin ACS 2023
- Neighborhood character
- Majority Black (57%)
- Race & ethnicity
- Black 57% White 34% Hispanic / Latino 5% Two or more races 4%
- Hispanic origin (detail)
- Mexican 2%
- Common ancestry
- Slovak 1% Lithuanian 1% Italian 1%
- Foreign-born
- 4% · Canada
- Languages at home
- 93% English-only · Spanish 5%
Political lean MEDSL · Charleston
- 2024 margin
- Lean D (+5.7) · D 51.9% · R 46.3% · Other 1.8%
- 2008→2024 swing
- -2.7pp toward R · 2008: 8.3pp · 2024: 5.7pp
- All cycles
- 2024: D+5.7 2020: D+12.9 2016: D+7.9 2012: D+2.4 2008: D+8.3
Not yet ingested
- Civics
- —
Market trends
- HPI YoY
- ▼ -152.19%
- Current HPI
- 372.8886
- Rent YoY
- ▲ 6.36%
- Metro
- Charleston-North Charleston, SC
- State GDP YoY
- ▲ 4.51%
- F500 in state
- 2
Industry mix (Fortune 500 HQ in SC)
| Industry | F500 HQs | Revenue |
|---|---|---|
| Packaging | 1 | $7B |
|
||
Price history
-80.7% since first listed10 events — show timeline
- 2026-01-02 Relisted — Charleston Trident MLS
- 2026-01-01 Listing Removed — Charleston Trident MLS
- 2025-11-04 Price Changed $209,000 Charleston Trident MLS
- 2025-07-25 Price Changed $215,000 Charleston Trident MLS
- 2025-05-23 Price Changed $219,900 Charleston Trident MLS
- 2025-03-24 Relisted — Charleston Trident MLS
- 2025-03-12 Contingent — Charleston Trident MLS
- 2025-03-12 Relisted — Charleston Trident MLS
- 2025-02-05 Listed $227,500 Charleston Trident MLS
- 2019-01-30 Sold (Public Records) $1,084,571 Public Records
Property tax history
+10.0%/yrLatest (2022): $984 · +0.7% YoY. Source: county tax records.
Cash-flow waterfall
monthlySold comps — $/sqft
last 12 mo · ≤1 miLoading sold comps…