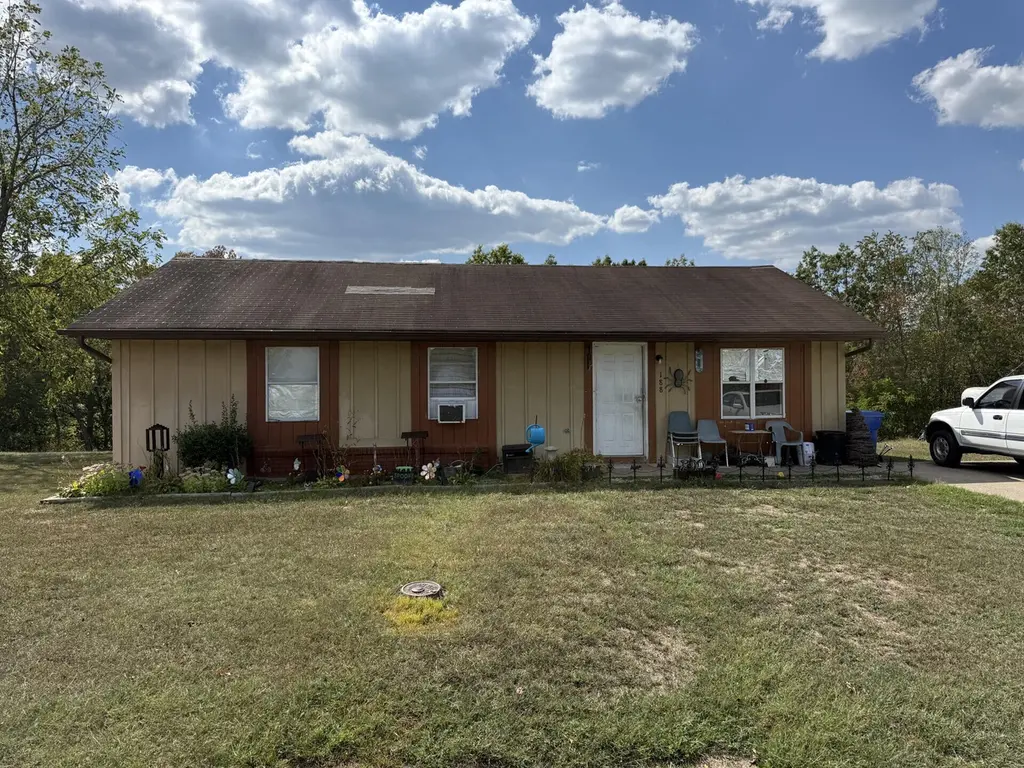
188 Strawberry Ln · Olive Hill, KY
Flood risk 1/10 · Minimal
- FEMA flood zone
- X (unshaded)
- Chance of flooding over 30 yrs
- 0.0%
- Est. flood insurance / yr
- $507 – $1,088
Fire risk 8/10 · Major
- Est. fire insurance / yr
- $839 – $1,559
Heat risk 3/10 · Minor
- Hot days now (above 100°F)
- 7 days/yr
- Hot days in 30 yrs
- 19 days/yr
Wind risk 2/10 · Minimal
- Chance of severe wind over 30 yrs
- 2.0%
Air-quality risk 1/10 · Minimal
- Unhealthy air days now
- 0 days/yr
- Unhealthy air days in 30 yrs
- 0 days/yr
Risk factors via First Street. Map © Google.
Why this score? — see what drove the A- grade
The composite is a weighted blend of 9 inputs, each scored 0–100. Each bar is that input's sub-score; the figure is the points it added to the 100-point composite (weight × sub-score).
- Cash flow +30.0/30.0
- ARV discount +15.0/15.0
- 1% rule +10.0/10.0
- DSCR +10.0/10.0
- Appreciation +5.5/10.0
- Livability +3.5/5.0
- Schools +2.9/10.0
- Rent growth +2.5/5.0
- Condition / age +2.5/5.0
$69,900
🖨 Deal sheet (PDF) 📄 Offer letter ✓ Due diligence
Listing remarks
ATTENTION INVESTORS! Expand your real estate portfolio with this three-bedroom, brick home in Olive Hill, Ky. Increase your market rent exponentially with a little TLC or fix and flip! Property features: three bedrooms, one bath, a large front and back yard, and a beautiful wood line. It has baseboard heat and window air. Make improvements and increase your Return on Investment. Being sold as is, buyer to satisfy himself. Buyer to verify square footage and acreage. City water and septic.
Key facts
- Window air
- Septic
- City water
Tags
Property features AI
Exterior
- Utilities: Public water; Public sewer
- Home design: House; One story
- Construction: Vinyl siding; Wood siding; Block foundation; Shingle roof; Built area approximately 960
- Exterior features: Rural, trees/woods and neighborhood views
Interior
- Kitchen: Eat-in kitchen
- Bedrooms: 4 total rooms
- Flooring: Carpet; Vinyl
- Bathrooms: 1 full bathroom
- Heating & cooling: Baseboard heating; Attic fan for cooling
- Interior features: Eat-in kitchen; Other
- Laundry & utility: Washer hookup; Electric dryer hookup
Neighborhood map
What this means for you Summary
Snapshot
- This is a 3-bed/1.0-bath single-family listed at $70k.
Deal economics
- At list price, monthly cash flow is $405 ($5k/yr) — positive.
- The deal already cash-flows at list — no discount required.
- Meets the 1% rule at list price ($1k rent vs $70k).
- Recommended offer: $68k (3.0% below list) — sets the bar for market timing.
- Cap rate 13.3% vs local median 4.8% in Olive Hill — top-decile yield for the area; either an underpriced asset or a hidden risk that comps aren't pricing in. Stress-test before assuming the spread holds.
Location & tenants
- Location reads 70/100 on livability (#160 in KY) — a middle-class / working-renter tenant base. Strengths: crime A+, cost of living A+, housing A+; Watch: employment C-, health & safety C-, amenities F.
- Carter County (rural): math 27% / reading 43% proficiency, ranked #70 of 165 in KY (top 42%) — families likely to look elsewhere, expect single-tenant / working-renter base with shorter leases.
- Zoned schools: Olive Hill Elementary School (math 32% / reading 47%, grade F, #208 of 676 statewide, top 34%, 381 students, 65% FRL); West Carter Middle School (math 23% / reading 43%, grade F, #112 of 217 statewide, top 53%, 366 students, 65% FRL); West Carter County High School (math 27% / reading 37%, grade F, #97 of 254 statewide, top 46%, 522 students, 59% FRL).
- Market conditions: 47 active listings in the ZIP; 1 units permitted in Carter County in 2024 (0 in 5+ unit buildings).
Forward outlook
- In year one you build about $1k of equity ($483 loan paydown + $684 appreciation (1.0% local appreciation)).
- Carter County population projected at -21% by 2050 — secular population decline; favor cash flow + early exit over multi-decade hold.
- At projected returns (1.0% appreciation + 3.0% rent growth), your $20k cash investment doubles in ~4 years — after that, you're playing with house money.
Negotiation context
- It's been on market 31 days — a 3% lower offer ($68k) is reasonable based on typical stale-listing flexibility.
- 2 sale attempts with the ask held roughly flat each time — persistent listings suggest the price (not the market) is what's stuck; bring a comps-based counter.
Risks & watch-outs
- Climate carrying-cost: severe wildfire risk — expect insurance premiums to compound above CPI over the hold.
Questions for the listing agent
- It's been on market 31 days. Have you received any prior offers? Is the seller open to a 3% concession, seller financing, or rate buy-down credit?
- Is there a deadline driving the sale (1031 exchange, divorce, estate, relocation)? That informs how much negotiation room exists.
- Schools are D-rated, which usually means shorter tenancies and higher turnover. Who's the typical renter profile here, and what's been the actual vacancy rate?
- What's the average days-on-market for RENTAL listings here right now (not sales)? A rising rental-DOM trend means longer vacancies and softer asking-rent achievability than the comps imply.
- What's the recent tenant-quality profile in this submarket — average credit score on applications, eviction rate, late-payment / NSF rate, and stable-employment percentage? A property-management company in the area should have these aggregated.
- How much new for-sale + rental construction is in the pipeline within 1–3 miles? Heavy new supply typically softens prices + rents 12–24 months out; constrained supply supports both.
Investment metrics
- 1% rule
- 1.50% ✓
- Cap rate
- 13.25%
- Cash-on-cash
- 24.86%
- DSCR
- 2.11
- GRM
- 5.6
CMA / ARV
- ARV (on-the-fly)
- $108,416
- Comps found
- 3
Show comp detail 3 sales within ~0.75 mi
| Address | Dist | Beds/Ba | Sqft | Sold | Price | $/sf | Match |
|---|---|---|---|---|---|---|---|
| 133 Kelli St | 0.52mi | 3/1.0 | 1,200 (-3%) | 3mo | $105,000 | $88 | 69 |
| 143 Morgan Ave | 0.62mi | 3/2.0 | 1,272 (+3%) | 13mo | $229,900 | $181 | 51 |
| 190 Mills Br | 0.74mi | 2/1.0 (-1) | 1,282 (+4%) | 22mo | $89,500 | $70 | 35 |
Match score weights: distance 35% · size 25% · config 20% · recency 20%. Top-matched comps best support the ARV.
Projected returns pro-forma
0.98% appreciation · 3.0% rent growth · sell at horizon
- IRR
- 27.0%
- Equity multiple
- 2.38×
- Total profit
- $27,035
- Equity at exit
- $23,783
- IRR
- 29.7%
- Equity multiple
- 4.56×
- Total profit
- $69,739
- Equity at exit
- $31,544
Cash invested: $19,572 (down + closing). Projections, not guarantees.
Landlord ↔ Tenant lean methodology
- Overall (STATE)
- 83 Strongly Landlord-Friendly
- State Kentucky
- 83 Strongly Landlord-Friendly · R+16
- County
- — inherits STATE
- City
- — inherits STATE
ZIP-level market 41164
- Home prices YoY
- 0.3%
- Active inventory
- 47
- Price-to-rent
- 5.6×
Monthly cashflow live
- Estimated rent
- $1,047 medium interval (Pro) →
- Mortgage (P&I)
- −$367
- Tax from tax record
- −$26 /mo · $307/yr
- Insurance
- −$29
- HOA
- −$0
- Vacancy / Maint / Mgmt
- −$220
- Net cashflow
- $405
Break-even live
Sensitivity live
| Price | -10% $445 | -5% $425 | +0% $405 | +5% $386 | +10% $366 |
|---|---|---|---|---|---|
| Rent | -10% $323 | -5% $364 | +0% $405 | +5% $447 | +10% $488 |
| Rate | -1.0pp $441 | -0.5pp $423 | base $405 | +0.5pp $387 | +1.0pp $369 |
UW: 25.0% down · 7.5% · 30yr · 1.5% tax · 5.0% vac · 8.0% maint · 8.0% mgmt
Financing live
Cash to close
- Down payment
- $17,475
- Closing costs
- $2,097
- Reserves months
- —
- Total cash needed
- —
Loan-product check · same deal, 3 products live
Conventional
25% down · 7.5% · 30yr
- Down + closing
- —
- Monthly P&I
- —
- Monthly cashflow
- —
- DSCR
- —
- Eligible?
- —
Personal DTI + credit; lowest rate.
DSCR
20% down · 8.5% · 30yr
- Down + closing
- —
- Monthly P&I
- —
- Monthly cashflow
- —
- DSCR
- —
- Eligible?
- —
No personal income docs; deal must DSCR.
Hard money
10% down · 12.0% · 12mo
- Down + closing
- —
- Monthly P&I
- —
- Monthly cashflow
- —
- DSCR
- —
- Eligible?
- —
Short-term bridge; refi at stabilization.
Listing history 24 events
-
2026-06-18days on market $69,900 Active 31 DOM
-
2026-06-17days on market $69,900 Active 30 DOM
-
2026-06-16days on market $69,900 Active 29 DOM
-
2026-06-15days on market $69,900 Active 28 DOM
-
2026-06-14days on market $69,900 Active 26 DOM
-
2026-06-13days on market $69,900 Active 25 DOM
-
2026-06-10days on market $69,900 Active 23 DOM
-
2026-06-09days on market $69,900 Active 22 DOM
-
2026-06-08days on market $69,900 Active 21 DOM
-
2026-06-07days on market $69,900 Active 20 DOM
-
2026-06-05days on market $69,900 Active 17 DOM
-
2026-06-03days on market $69,900 Active 16 DOM
-
2026-06-02days on market $69,900 Active 15 DOM
-
2026-06-01days on market $69,900 Active 14 DOM
-
2026-05-31days on market $69,900 Active 13 DOM
-
2026-05-31days on market $69,900 Active 12 DOM
-
2026-05-18$69,900 Active
-
2026-03-24historical
-
2026-01-20price $79,950
-
2025-11-20price $89,850
-
2025-10-11price $94,850
-
2025-09-24$99,850 Active
-
2025-09-08soldstatus $90,000
-
2013-10-04soldstatus $54,857
ⓘ Source: listings_history table (triggers on properties + properties_extension) + one-shot
backfill from property_details.listing_events for pre-trigger history.
Tax reassessment forecast KY · Resets to sale price
- Current annual tax
- $307 · $26/mo
- Projected year-2 tax
- $601 · $50/mo
- Expected delta
- +$294/yr (+$24/mo · 95.7%)
ⓘ Screening estimate from a state-policy table — verify with the county assessor before closing.
Climate risk First Street
- Flood 1/10 Low FEMA zone X (unshaded) · 0% chance over 30 yrs
- Wildfire 8/10 Severe
- Heat 3/10 Moderate 7 d/yr ≥100°F today · 19 d/yr by 30 yrs out
- Wind 2/10 Low 2% chance of damaging wind over 30 yrs
- Air quality 1/10 Low 0 unhealthy d/yr today · 0 by 30 yrs out
Nearby sold comps map
Loading sold comps map…
Walkable amenities ~0.75 mi
Loading nearby amenities…
Taxation est. · year 1
- Rental income
- $12,558
- − Mortgage interest
- −$3,915
- − Property taxes
- −$307
- − Insurance
- −$350
- − Repairs & maintenance
- −$1,005
- − Management
- −$1,005
- − Depreciation
- −$2,033
- Taxable income
- $3,943
- Est. tax owed @ 24.0%
- −$946
- After-tax cash flow
- $3,919/yr
For passive investors: Depreciation is non-cash, so a rental often shows a tax loss while cash-flowing — sheltering income. Rental losses are passive: they offset passive income freely, and up to $25,000/yr can offset ordinary (W-2) income if you actively participate and your MAGI is under $100k (phasing out to $0 by $150k); unused losses carry forward. On sale, claimed depreciation is recaptured at up to 25%, and gains may owe capital-gains tax (a 1031 exchange can defer both). Figures are a year-1 estimate at your 24.0% rate — not tax advice; consult a CPA.
Schools (NCES district)
- District
- Carter County
- NCES district ID
- 2101020
- Math proficiency
- 27% ▼ -29.00%
- Reading proficiency
- 43% ▼ -16.00%
- Median HH income
- $34,662
- Composite
- 28.82/100
- National rank
- #6656
- State rank
- #70 of 165 in KY
Livability — Olive Hill
- Score
- 70/100
- State rank
- #160
- US rank
- #8044
Category grades
Schools grade is shown separately in the Schools card above.
Census & demographics
- Census place
- Olive Hill, KY
- Population (ZIP)
- 12,372
Population outlook (Carter County) Hauer SSP2
- Today (2025)
- 25,627 people
- By 2030
- 24,598 · -4.0%
- By 2040
- 22,429 · -12.5%
- By 2050
- 20,217 · -21.1%
- By 2075
- 15,274 · -40.4%
- By 2100
- 10,545 · -58.9%
Race, ethnicity, and origin ACS 2023
- Neighborhood character
- Predominantly White (96%)
- Race & ethnicity
- White 96% Two or more races 3% Hispanic / Latino 2%
- Common ancestry
- Slovak 2% Serbian 1% Iranian 1%
- Foreign-born
- 0%
Political lean MEDSL · Carter
- 2024 margin
- Solid R (+58.5) · D 20.2% · R 78.6% · Other 1.2%
- 2008→2024 swing
- -48.9pp toward R · 2008: -9.5pp · 2024: -58.5pp
- All cycles
- 2024: R+58.5 2020: R+52.9 2016: R+51.7 2012: R+21.3 2008: R+9.5
Not yet ingested
- Civics
- —
Market trends
- HPI YoY
- ▲ 0.98%
- Current HPI
- 288.8744
- Rent YoY
- —
- Metro
- —
- State GDP YoY
- ▲ 1.81%
- F500 in state
- 4
Industry mix (Fortune 500 HQ in KY)
| Industry | F500 HQs | Revenue |
|---|---|---|
| Healthcare | 1 | $118B |
|
||
| Food / Beverage | 1 | $7B |
|
||
Price history
+27.4% since first listed8 events — show timeline
- 2026-05-18 Listed $69,900 ImagineMLS
- 2026-03-24 Listing Removed — ImagineMLS
- 2026-01-20 Price Changed $79,950 ImagineMLS
- 2025-11-20 Price Changed $89,850 ImagineMLS
- 2025-10-11 Price Changed $94,850 ImagineMLS
- 2025-09-24 Listed $99,850 ImagineMLS
- 2025-09-08 Sold (Public Records) $90,000 Public Records
- 2013-10-04 Sold (Public Records) $54,857 Public Records
Property tax history
+8.6%/yrLatest (2024): $307 · +42.5% YoY. Source: county tax records.
Cash-flow waterfall
monthlySold comps — $/sqft
last 12 mo · ≤1 miLoading sold comps…