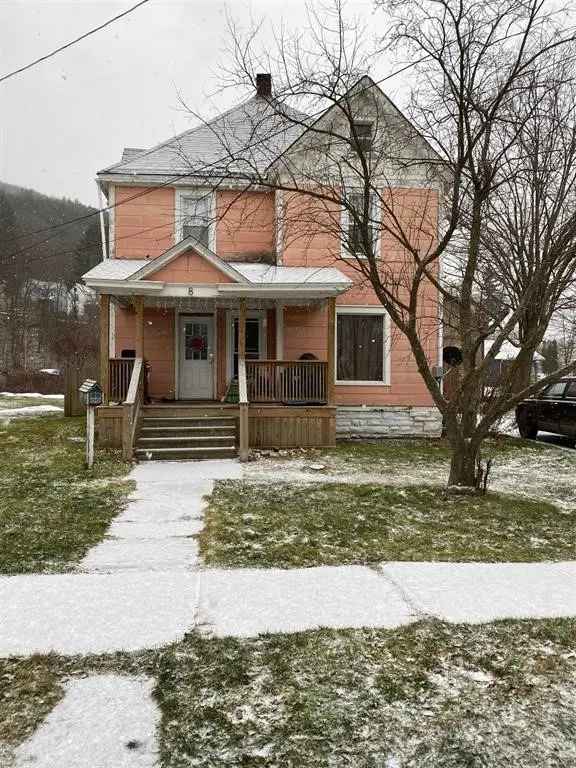
8 Griswold St · Walton, NY
Flood risk 6/10 · Moderate
- FEMA flood zone
- AE
- Chance of flooding over 30 yrs
- 0.48%
- Est. flood insurance / yr
- $2,026 – $9,024
Fire risk 1/10 · Minimal
- Est. fire insurance / yr
- $691 – $1,283
Heat risk 2/10 · Minimal
- Hot days now (above 90°F)
- 8 days/yr
- Hot days in 30 yrs
- 18 days/yr
Wind risk 2/10 · Minimal
- Chance of severe wind over 30 yrs
- 1.0%
Air-quality risk 2/10 · Minimal
- Unhealthy air days now
- 0 days/yr
- Unhealthy air days in 30 yrs
- 1 days/yr
Risk factors via First Street. Map © Google.
Why this score? — see what drove the A- grade
The composite is a weighted blend of 9 inputs, each scored 0–100. Each bar is that input's sub-score; the figure is the points it added to the 100-point composite (weight × sub-score).
- Cash flow +30.0/30.0
- ARV discount +12.3/15.0
- 1% rule +10.0/10.0
- DSCR +10.0/10.0
- Appreciation +7.9/10.0
- Schools +3.5/10.0
- Livability +3.5/5.0
- Rent growth +2.5/5.0
- Condition / age +2.5/5.0
$144,500
🖨 Deal sheet (PDF) 📄 Offer letter ✓ Due diligence
Listing remarks MLS
Village home that boasts 4 bedrooms, 1.5 baths and sits on a quarter acre lot. A lot of upgrades inside the home have been done. Walking distance to downtown shopping, schools, parks and more. For your viewing, call today.
Key facts
- Quarter acre lot
- 0.25 acre lot
- 2 garage spots
Tags
Neighborhood map
What this means for you Summary
Snapshot
- This is a 4-bed/1.5-bath single-family listed at $144k.
Deal economics
- At list price, monthly cash flow is $786 ($9k/yr) — positive.
- The deal already cash-flows at list — no discount required.
- Meets the 1% rule at list price ($3k rent vs $144k).
- Recommended offer: $127k (12.0% below list) — sets the bar for market timing.
Location & tenants
- Location reads 70/100 on livability (#443 in NY) — a middle-class / working-renter tenant base. Strengths: cost of living A+, health & safety A+; Watch: amenities F, commute F, employment F.
- Walton Central School District (town): math 36% / reading 47% proficiency, ranked #510 of 590 in NY (top 86%) — families likely to look elsewhere, expect single-tenant / working-renter base with shorter leases.
- Zoned schools: Townsend Elementary School (math 32% / reading 42%, grade F, #1,519 of 2,108 statewide, top 74%, 367 students, 47% FRL); Walton Middle School (math 17% / reading 42%, grade F, #550 of 729 statewide, top 77%, 189 students, 54% FRL); Walton High School (math 84% / reading 90%, grade A, #308 of 1,100 statewide, top 28%, 283 students, 50% FRL) — zoned schools at 51% FRL track the district average.
- Market conditions: 56 active listings in the ZIP; 66 units permitted in Delaware County in 2024 (0 in 5+ unit buildings).
Forward outlook
- In year one you build about $9k of equity ($999 loan paydown + $8k appreciation (5.8% local appreciation)).
- Delaware County population projected at -27% by 2050 — secular population decline; favor cash flow + early exit over multi-decade hold.
- At projected returns (5.8% appreciation + 3.0% rent growth), your $40k cash investment doubles in ~3 years — after that, you're playing with house money.
- By year 4, paydown + projected appreciation supports a ~$32k cash-out refi (75% LTV) — recoverable capital for the next deal without selling this one.
Negotiation context
- It's been on market 142 days — a 12% lower offer ($127k) is reasonable based on typical stale-listing flexibility.
- 2 sale attempts since 5y ago with the ask held roughly flat each time — persistent listings suggest the price (not the market) is what's stuck; bring a comps-based counter.
- Current owner paid $75k; list at $144k implies a 93% gain — meaningful room to come down on a strong offer.
Risks & watch-outs
- Watch-outs: flood insurance adds $460/mo; built in 1900 — expect roof / HVAC / electrical / plumbing capex.
- Climate carrying-cost: in FEMA flood zone AE (mandatory federal flood insurance) — expect insurance premiums to compound above CPI over the hold.
Questions for the listing agent
- It's been on market 142 days. Have you received any prior offers? Is the seller open to a 12% concession, seller financing, or rate buy-down credit?
- Built in 1900 — when were the roof, HVAC, electrical panel, plumbing, and water heater last replaced?
- What's the actual annual flood-insurance premium (NFIP or private), and is the property in a SFHA with mandatory coverage?
- Why hasn't it sold? Are there any deal-killer items the seller is aware of (foundation, flood, title, zoning, code violations)?
- Is there a deadline driving the sale (1031 exchange, divorce, estate, relocation)? That informs how much negotiation room exists.
- Schools are D-rated, which usually means shorter tenancies and higher turnover. Who's the typical renter profile here, and what's been the actual vacancy rate?
- What's the average days-on-market for RENTAL listings here right now (not sales)? A rising rental-DOM trend means longer vacancies and softer asking-rent achievability than the comps imply.
- What's the recent tenant-quality profile in this submarket — average credit score on applications, eviction rate, late-payment / NSF rate, and stable-employment percentage? A property-management company in the area should have these aggregated.
- How much new for-sale + rental construction is in the pipeline within 1–3 miles? Heavy new supply typically softens prices + rents 12–24 months out; constrained supply supports both.
Investment metrics
- 1% rule
- 1.96% ✓
- Cap rate
- 16.65%
- Cash-on-cash
- 36.97%
- DSCR
- 2.65
- GRM
- 4.2
CMA / ARV
- ARV (median comp)
- $161,602
- List price
- $144,500
- Delta
- -10.58%
- Verdict
- UNDERPRICED
- Comps
- 20 within 1.0 mi
Show comp detail 12 sales within ~0.75 mi
| Address | Dist | Beds/Ba | Sqft | Sold | Price | $/sf | Match |
|---|---|---|---|---|---|---|---|
| 49 North St | 0.24mi | 4/1.5 | 1,560 (-3%) | 10mo | $180,000 | $115 | 76 |
| 58 1/2 High St | 0.26mi | 3/2.0 (-1) | 1,810 (+13%) | 1mo | $230,000 | $127 | 58 |
| 42 Delaware St | 0.13mi | 3/1.0 (-1) | 1,390 (-13%) | 8mo | $100,000 | $72 | 58 |
| 26 Saint John St | 0.55mi | 3/1.5 (-1) | 1,688 (+5%) | 9mo | $225,000 | $133 | 53 |
| — | 0.38mi | 3/1.0 (-1) | 1,700 (+6%) | 17mo | $110,000 | $65 | 52 |
| 79 Liberty St | 0.51mi | 3/2.0 (-1) | 1,440 (-10%) | 1mo | $267,500 | $186 | 51 |
| 57 Liberty St | 0.43mi | 4/2.0 | 1,431 (-11%) | 14mo | $65,000 | $45 | 48 |
| 81 Park St | 0.57mi | 3/1.5 (-1) | 1,536 (-4%) | 19mo | $230,000 | $150 | 46 |
| 13 Liberty St | 0.34mi | 3/1.0 (-1) | 1,400 (-13%) | 14mo | $37,000 | $26 | 44 |
| 82 Saint John St | 0.69mi | 4/2.0 | 1,408 (-12%) | 3mo | $110,000 | $78 | 43 |
| 47 Shepard St | 0.58mi | 4/1.5 | 1,764 (+10%) | 23mo | $181,500 | $103 | 37 |
| 85 Saint John St | 0.71mi | 4/2.0 | 1,750 (+9%) | 21mo | $210,000 | $120 | 32 |
Match score weights: distance 35% · size 25% · config 20% · recency 20%. Top-matched comps best support the ARV.
Projected returns pro-forma
5.79% appreciation · 3.0% rent growth · sell at horizon
- IRR
- 34.7%
- Equity multiple
- 3.23×
- Total profit
- $90,355
- Equity at exit
- $88,965
- IRR
- 32.5%
- Equity multiple
- 6.63×
- Total profit
- $227,694
- Equity at exit
- $159,740
Cash invested: $40,460 (down + closing). Projections, not guarantees.
Landlord ↔ Tenant lean methodology
- Overall (STATE)
- 15 Strongly Tenant-Friendly
- State New York
- 15 Strongly Tenant-Friendly · D+10
- County
- — inherits STATE
- City
- — inherits STATE
ZIP-level market 13856
- Home prices YoY
- 1.8%
- Active inventory
- 56
- Price-to-rent
- 4.2×
Monthly cashflow live
- Estimated rent
- $2,835 medium interval (Pro) →
- Mortgage (P&I)
- −$758
- Tax from tax record
- −$175 /mo · $2,101/yr
- Insurance
- −$60
- Flood insurance flood zone
- −$460 /mo · $5,525/yr
- HOA
- −$0
- Vacancy / Maint / Mgmt
- −$595
- Net cashflow
- $786
Break-even live
Sensitivity live
| Price | -10% $868 | -5% $827 | +0% $786 | +5% $745 | +10% $704 |
|---|---|---|---|---|---|
| Rent | -10% $562 | -5% $674 | +0% $786 | +5% $898 | +10% $1,010 |
| Rate | -1.0pp $859 | -0.5pp $823 | base $786 | +0.5pp $749 | +1.0pp $711 |
UW: 25.0% down · 7.5% · 30yr · 1.5% tax · 5.0% vac · 8.0% maint · 8.0% mgmt
Financing live
Cash to close
- Down payment
- $36,125
- Closing costs
- $4,335
- Reserves months
- —
- Total cash needed
- —
Loan-product check · same deal, 3 products live
Conventional
25% down · 7.5% · 30yr
- Down + closing
- —
- Monthly P&I
- —
- Monthly cashflow
- —
- DSCR
- —
- Eligible?
- —
Personal DTI + credit; lowest rate.
DSCR
20% down · 8.5% · 30yr
- Down + closing
- —
- Monthly P&I
- —
- Monthly cashflow
- —
- DSCR
- —
- Eligible?
- —
No personal income docs; deal must DSCR.
Hard money
10% down · 12.0% · 12mo
- Down + closing
- —
- Monthly P&I
- —
- Monthly cashflow
- —
- DSCR
- —
- Eligible?
- —
Short-term bridge; refi at stabilization.
Listing history 23 events
-
2026-06-22days on market $144,500 Active 142 DOM
-
2026-06-21days on market $144,500 Active 141 DOM
-
2026-06-21days on market $144,500 Active 140 DOM
-
2026-06-18days on market $144,500 Active 138 DOM
-
2026-06-17days on market $144,500 Active 137 DOM
-
2026-06-16days on market $144,500 Active 136 DOM
-
2026-06-15days on market $144,500 Active 135 DOM
-
2026-06-13days on market $144,500 Active 133 DOM
-
2026-06-12days on market $144,500 Active 132 DOM
-
2026-06-09days on market $144,500 Active 129 DOM
-
2026-06-08days on market $144,500 Active 128 DOM
-
2026-06-07days on market $144,500 Active 127 DOM
-
2026-06-07days on market $144,500 Active 126 DOM
-
2026-06-04days on market $144,500 Active 123 DOM
-
2026-06-02days on market $144,500 Active 122 DOM
-
2026-06-01days on market $144,500 Active 121 DOM
-
2026-05-31days on market $144,500 Active 120 DOM
-
2026-04-08price $144,500 222-char remark
Show marketing remark (222 chars)
Village home that boasts 4 bedrooms, 1.5 baths and sits on a quarter acre lot. A lot of upgrades inside the home have been done. Walking distance to downtown shopping, schools, parks and more. For your viewing, call today.
-
2026-01-30$149,500 Active 222-char remark
Show marketing remark (222 chars)
Village home that boasts 4 bedrooms, 1.5 baths and sits on a quarter acre lot. A lot of upgrades inside the home have been done. Walking distance to downtown shopping, schools, parks and more. For your viewing, call today.
-
2021-06-22historical
-
2021-01-21$72,500
-
2007-08-31soldstatus $75,000
-
1993-12-22soldstatus $45,000
ⓘ Source: listings_history table (triggers on properties + properties_extension) + one-shot
backfill from property_details.listing_events for pre-trigger history.
Tax reassessment forecast NY · Partial reset (capped growth)
- Current annual tax
- $2,101 · $175/mo
- Projected year-2 tax
- $2,272 · $189/mo
- Expected delta
- +$170/yr (+$14/mo · 8.1%)
ⓘ Screening estimate from a state-policy table — verify with the county assessor before closing.
Climate risk First Street
- Flood 6/10 Major FEMA zone AE · 48% chance over 30 yrs
- Wildfire 1/10 Low
- Heat 2/10 Low 8 d/yr ≥90°F today · 18 d/yr by 30 yrs out
- Wind 2/10 Low 100% chance of damaging wind over 30 yrs
- Air quality 2/10 Low 0 unhealthy d/yr today · 1 by 30 yrs out
Nearby sold comps map
Loading sold comps map…
Walkable amenities ~0.75 mi
Loading nearby amenities…
Taxation est. · year 1
- Rental income
- $34,021
- − Mortgage interest
- −$8,094
- − Property taxes
- −$2,101
- − Insurance
- −$6,248
- − Repairs & maintenance
- −$2,722
- − Management
- −$2,722
- − Depreciation
- −$4,204
- Taxable income
- $7,931
- Est. tax owed @ 24.0%
- −$1,903
- After-tax cash flow
- $7,531/yr
For passive investors: Depreciation is non-cash, so a rental often shows a tax loss while cash-flowing — sheltering income. Rental losses are passive: they offset passive income freely, and up to $25,000/yr can offset ordinary (W-2) income if you actively participate and your MAGI is under $100k (phasing out to $0 by $150k); unused losses carry forward. On sale, claimed depreciation is recaptured at up to 25%, and gains may owe capital-gains tax (a 1031 exchange can defer both). Figures are a year-1 estimate at your 24.0% rate — not tax advice; consult a CPA.
Schools (NCES district)
- District
- Walton Central School District
- NCES district ID
- 3629820
- Math proficiency
- 36% ▬ 0.00%
- Reading proficiency
- 47% ▲ 3.00%
- Median HH income
- $41,231
- Composite
- 34.86/100
- National rank
- #5088
- State rank
- #510 of 590 in NY
Livability — Walton
- Score
- 70/100
- State rank
- #443
- US rank
- #7789
Category grades
Schools grade is shown separately in the Schools card above.
Census & demographics
- Census place
- Walton, NY
- Population (ZIP)
- 5,915
Population outlook (Delaware County) Hauer SSP2
- Today (2025)
- 42,668 people
- By 2030
- 40,337 · -5.5%
- By 2040
- 35,514 · -16.8%
- By 2050
- 31,265 · -26.7%
- By 2075
- 24,455 · -42.7%
- By 2100
- 19,529 · -54.2%
Race, ethnicity, and origin ACS 2023
- Neighborhood character
- Predominantly White (90%)
- Race & ethnicity
- White 90% Black 5% Two or more races 5% Hispanic / Latino 2%
- Common ancestry
- Iranian 7% Slovak 3% Lithuanian 3%
- Foreign-born
- 3% · Canada, Philippines
- Languages at home
- 94% English-only · Spanish 2% Other Indo-European 1% French/Haitian/Cajun 1%
Political lean MEDSL · Delaware
- 2024 margin
- R (+19.8) · D 40.1% · R 59.9%
- 2008→2024 swing
- -14.6pp toward R · 2008: -5.2pp · 2024: -19.8pp
- All cycles
- 2024: R+19.8 2020: R+18.4 2016: R+29.2 2012: R+9.6 2008: R+5.2
Not yet ingested
- Civics
- —
Market trends
- HPI YoY
- ▲ 5.79%
- Current HPI
- 331.9799
- Rent YoY
- —
- Metro
- —
- State GDP YoY
- ▲ 2.60%
- F500 in state
- 92
Industry mix (Fortune 500 HQ in NY)
| Industry | F500 HQs | Revenue |
|---|---|---|
| Financial Services | 10 | $950B |
|
||
| Consumer Goods | 9 | $162B |
|
||
| Insurance | 4 | $225B |
|
||
| Telecommunications | 2 | $144B |
|
||
| Pharmaceuticals | 2 | $112B |
|
||
| Media / Entertainment | 2 | $69B |
|
||
Price history
+221.1% since first listed6 events — show timeline
- 2026-04-08 Price Changed $144,500 UNYREIS
- 2026-01-30 Listed $149,500 UNYREIS
- 2021-06-22 Listing Removed — UNYREIS
- 2021-01-21 Listed $72,500 UNYREIS
- 2007-08-31 Sold (Public Records) $75,000 Public Records
- 1993-12-22 Sold (Public Records) $45,000 Public Records
Property tax history
-1.0%/yrLatest (2025): $2,101 · -13.5% YoY. Source: county tax records.
Cash-flow waterfall
monthlySold comps — $/sqft
last 12 mo · ≤1 miLoading sold comps…