3185 Highway 45 · Russellville, SC
Flood risk No data
- FEMA flood zone
- —
- Chance of flooding over 30 yrs
- —
- Est. flood insurance / yr
- —
Fire risk No data
- Est. fire insurance / yr
- —
Heat risk No data
- Hot days now (above threshold)
- —
- Hot days in 30 yrs
- —
Wind risk No data
- Chance of severe wind over 30 yrs
- —
Air-quality risk No data
- Unhealthy air days now
- —
- Unhealthy air days in 30 yrs
- —
Risk factors via First Street. Map © Google.
Why this score? — see what drove the B+ grade
The composite is a weighted blend of 9 inputs, each scored 0–100. Each bar is that input's sub-score; the figure is the points it added to the 100-point composite (weight × sub-score).
- Cash flow +30.0/30.0
- 1% rule +10.0/10.0
- DSCR +10.0/10.0
- ARV discount +7.5/15.0
- Appreciation +6.8/10.0
- Schools +3.6/10.0
- Rent growth +2.5/5.0
- Condition / age +2.5/5.0
- Livability +2.2/5.0
$35,000
🖨 Deal sheet (PDF) 📄 Offer letter ✓ Due diligence
Listing remarks
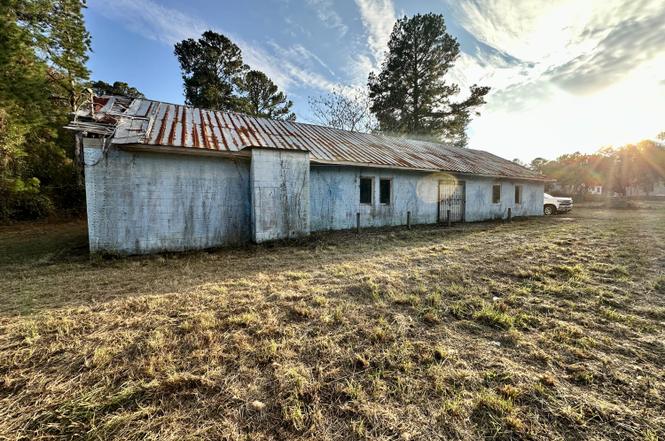
SELLER FINANCING AVAILABLE!2,576 SqFt Block Warehouse in Berkeley County on 1/3 of an Acre Lot. Zoned RNC (rural and neighborhood commercial) which allows for both commercial and residential development. Septic and well on site. Condition is unknown. X flood zone. Property is being sold as is. This area is exploding with development and industry. This would make an excellent addition to your portfolio as Berkeley County continues to grow.
Key facts
- Septic and well
- Zoned rnc
- X flood zone
Tags
Property features AI
Exterior
- Utilities: Septic tank
- Home design: Single-family detached residence; Fee simple ownership
- Construction: One-story structure
- Exterior features: Metal roof; Lot size between 0 and 0.5 acre; Rural northern Berkeley County location
Interior
- Bedrooms: 1 bedroom
- Bathrooms: 1 bathroom (includes a half bath)
- Interior features: One-level floor plan
Neighborhood map
What this means for you Summary
Snapshot
- This is a 1-bed/0.5-bath single-family listed at $35k.
Deal economics
- At list price, monthly cash flow is $577 ($7k/yr) — positive.
- The deal already cash-flows at list — no discount required.
- Meets the 1% rule at list price ($1k rent vs $35k).
- Recommended offer: $31k (12.0% below list) — sets the bar for market timing.
Location & tenants
- Location reads 44/100 on livability (#383 in SC) — a working-class tenant base; expect higher turnover. Strengths: cost of living A+, crime A; Watch: health & safety C-, amenities F, commute F.
- Berkeley 01 (suburban): math 35% / reading 48% proficiency, ranked #30 of 80 in SC (top 38%) — families likely to look elsewhere, expect single-tenant / working-renter base with shorter leases.
- Zoned schools: J. K. Gourdin Elementary (math 24% / reading 34%, grade F, #399 of 597 statewide, top 69%, 119 students, 100% FRL); St. Stephen Middle (math 2% / reading 22%, grade F, #216 of 229 statewide, top 96%, 209 students, 100% FRL); Timberland High (math 17% / reading 72%, grade F, #166 of 196 statewide, top 87%, 704 students, 100% FRL) — zoned schools average 100% FRL vs 48% district-wide (52 pts higher); higher-poverty schools than district average — tighter screening recommended.
- Zoned-school proficiency averages 29% at this address vs 42% district-wide (-13 pts) — the specific schools serving this property underperform the Berkeley 01 average; the district grade overstates school quality for this exact location.
- Market conditions: 19 active listings in the ZIP; 3,183 units permitted in Berkeley County in 2024 (580 in 5+ unit buildings).
Forward outlook
- In year one you build about $1k of equity ($242 loan paydown + $1k appreciation (3.6% local appreciation)).
- Berkeley County population projected at +48% by 2050 — long-run rental-demand tailwind backs the buy-and-hold thesis.
- At projected returns (3.6% appreciation + 3.0% rent growth), your $10k cash investment doubles in ~2 years — after that, you're playing with house money.
Negotiation context
- It's been on market 228 days — a 12% lower offer ($31k) is reasonable based on typical stale-listing flexibility.
Questions for the listing agent
- It's been on market 228 days. Have you received any prior offers? Is the seller open to a 12% concession, seller financing, or rate buy-down credit?
- Built in 1975 — when were the roof, HVAC, electrical panel, plumbing, and water heater last replaced?
- Why hasn't it sold? Are there any deal-killer items the seller is aware of (foundation, flood, title, zoning, code violations)?
- Is there a deadline driving the sale (1031 exchange, divorce, estate, relocation)? That informs how much negotiation room exists.
- Schools are D-rated, which usually means shorter tenancies and higher turnover. Who's the typical renter profile here, and what's been the actual vacancy rate?
- What's the average days-on-market for RENTAL listings here right now (not sales)? A rising rental-DOM trend means longer vacancies and softer asking-rent achievability than the comps imply.
- What's the recent tenant-quality profile in this submarket — average credit score on applications, eviction rate, late-payment / NSF rate, and stable-employment percentage? A property-management company in the area should have these aggregated.
- How much new for-sale + rental construction is in the pipeline within 1–3 miles? Heavy new supply typically softens prices + rents 12–24 months out; constrained supply supports both.
Investment metrics
- 1% rule
- 2.96% ✓
- Cap rate
- 26.07%
- Cash-on-cash
- 70.64%
- DSCR
- 4.14
- GRM
- 2.8
CMA / ARV
No comps found within radius.
Projected returns pro-forma
3.56% appreciation · 3.0% rent growth · sell at horizon
- IRR
- 75.8%
- Equity multiple
- 5.29×
- Total profit
- $42,031
- Equity at exit
- $16,859
- IRR
- 74.9%
- Equity multiple
- 10.89×
- Total profit
- $96,881
- Equity at exit
- $26,891
Cash invested: $9,800 (down + closing). Projections, not guarantees.
Landlord ↔ Tenant lean methodology
- Overall (STATE)
- 90 Strongly Landlord-Friendly
- State South Carolina
- 90 Strongly Landlord-Friendly · R+6
- County
- — inherits STATE
- City
- — inherits STATE
ZIP-level market 29468
- Home prices YoY
- 2.2%
- Active inventory
- 19
- Price-to-rent
- 2.8×
Monthly cashflow live
- Estimated rent
- $1,036 medium interval (Pro) →
- Mortgage (P&I)
- −$184
- Tax est. 1.5%
- −$44 /mo · $525/yr
- Insurance
- −$15
- HOA
- −$0
- Lot rent
- −$0
- Vacancy / Maint / Mgmt
- −$218
- Net cashflow
- $577
Break-even live
Sensitivity live
| Price | -10% $601 | -5% $589 | +0% $577 | +5% $565 | +10% $553 |
|---|---|---|---|---|---|
| Rent | -10% $495 | -5% $536 | +0% $577 | +5% $618 | +10% $659 |
| Rate | -1.0pp $595 | -0.5pp $586 | base $577 | +0.5pp $568 | +1.0pp $559 |
UW: 25.0% down · 7.5% · 30yr · 1.5% tax · 5.0% vac · 8.0% maint · 8.0% mgmt
Financing live
Cash to close
- Down payment
- $8,750
- Closing costs
- $1,050
- Reserves months
- —
- Total cash needed
- —
Loan-product check · same deal, 3 products live
Conventional
25% down · 7.5% · 30yr
- Down + closing
- —
- Monthly P&I
- —
- Monthly cashflow
- —
- DSCR
- —
- Eligible?
- —
Personal DTI + credit; lowest rate.
DSCR
20% down · 8.5% · 30yr
- Down + closing
- —
- Monthly P&I
- —
- Monthly cashflow
- —
- DSCR
- —
- Eligible?
- —
No personal income docs; deal must DSCR.
Hard money
10% down · 12.0% · 12mo
- Down + closing
- —
- Monthly P&I
- —
- Monthly cashflow
- —
- DSCR
- —
- Eligible?
- —
Short-term bridge; refi at stabilization.
Listing history 20 events
-
2026-06-21days on market $35,000 Active 228 DOM
-
2026-06-18days on market $35,000 Active 225 DOM
-
2026-06-17days on market $35,000 Active 224 DOM
-
2026-06-16days on market $35,000 Active 223 DOM
-
2026-06-15days on market $35,000 Active 222 DOM
-
2026-06-13days on market $35,000 Active 220 DOM
-
2026-06-13days on market $35,000 Active 219 DOM
-
2026-06-10days on market $35,000 Active 217 DOM
-
2026-06-09days on market $35,000 Active 216 DOM
-
2026-06-08days on market $35,000 Active 215 DOM
-
2026-06-07days on market $35,000 Active 214 DOM
-
2026-06-05days on market $35,000 Active 211 DOM
-
2026-06-03days on market $35,000 Active 210 DOM
-
2026-06-03days on market $35,000 Active 209 DOM
-
2026-06-01days on market $35,000 Active 208 DOM
-
2026-05-31days on market $35,000 Active 207 DOM
-
2026-04-27price $35,000
-
2026-02-16price $40,000
-
2026-01-12price $49,000
-
2025-11-04$50,000 Active
ⓘ Source: listings_history table (triggers on properties + properties_extension) + one-shot
backfill from property_details.listing_events for pre-trigger history.
Nearby sold comps map
Loading sold comps map…
Walkable amenities ~0.75 mi
Loading nearby amenities…
Taxation est. · year 1
- Rental income
- $12,437
- − Mortgage interest
- −$1,961
- − Property taxes
- −$525
- − Insurance
- −$175
- − Repairs & maintenance
- −$995
- − Management
- −$995
- − Depreciation
- −$1,018
- Taxable income
- $6,769
- Est. tax owed @ 24.0%
- −$1,624
- After-tax cash flow
- $5,299/yr
For passive investors: Depreciation is non-cash, so a rental often shows a tax loss while cash-flowing — sheltering income. Rental losses are passive: they offset passive income freely, and up to $25,000/yr can offset ordinary (W-2) income if you actively participate and your MAGI is under $100k (phasing out to $0 by $150k); unused losses carry forward. On sale, claimed depreciation is recaptured at up to 25%, and gains may owe capital-gains tax (a 1031 exchange can defer both). Figures are a year-1 estimate at your 24.0% rate — not tax advice; consult a CPA.
Schools (NCES district)
- District
- Berkeley 01
- NCES district ID
- 4501170
- Math proficiency
- 35% ▼ -8.00%
- Reading proficiency
- 48% ▼ -2.00%
- Median HH income
- $52,724
- Composite
- 35.95/100
- National rank
- #4799
- State rank
- #30 of 80 in SC
Livability — Russellville
- Score
- 44/100
- State rank
- #383
- US rank
- #26736
Category grades
Schools grade is shown separately in the Schools card above.
Census & demographics
- Population (ZIP)
- 2,319
Population outlook (Berkeley County) Hauer SSP2
- Today (2025)
- 254,184 people
- By 2030
- 279,677 · +10.0%
- By 2040
- 329,379 · +29.6%
- By 2050
- 375,557 · +47.8%
- By 2075
- 476,740 · +87.6%
- By 2100
- 535,945 · +110.8%
Race, ethnicity, and origin ACS 2023
- Neighborhood character
- Predominantly Black (81%)
- Race & ethnicity
- Black 81% White 19%
- Languages at home
- 99% English-only · Spanish 1%
Political lean MEDSL · Berkeley
- 2024 margin
- R (+16.3) · D 41.1% · R 57.4% · Other 1.4%
- 2008→2024 swing
- -3.2pp toward R · 2008: -13.1pp · 2024: -16.3pp
- All cycles
- 2024: R+16.3 2020: R+11.7 2016: R+17.4 2012: R+18.9 2008: R+13.1
Not yet ingested
- Civics
- —
Market trends
- HPI YoY
- ▲ 3.56%
- Current HPI
- 164.0164
- Rent YoY
- —
- Metro
- —
- State GDP YoY
- ▲ 4.51%
- F500 in state
- 2
Industry mix (Fortune 500 HQ in SC)
| Industry | F500 HQs | Revenue |
|---|---|---|
| Packaging | 1 | $7B |
|
||
Price history
-30.0% since first listed4 events — show timeline
- 2026-04-27 Price Changed $35,000 Charleston Trident MLS
- 2026-02-16 Price Changed $40,000 Charleston Trident MLS
- 2026-01-12 Price Changed $49,000 Charleston Trident MLS
- 2025-11-04 Listed $50,000 Charleston Trident MLS
Cash-flow waterfall
monthlySold comps — $/sqft
last 12 mo · ≤1 miLoading sold comps…