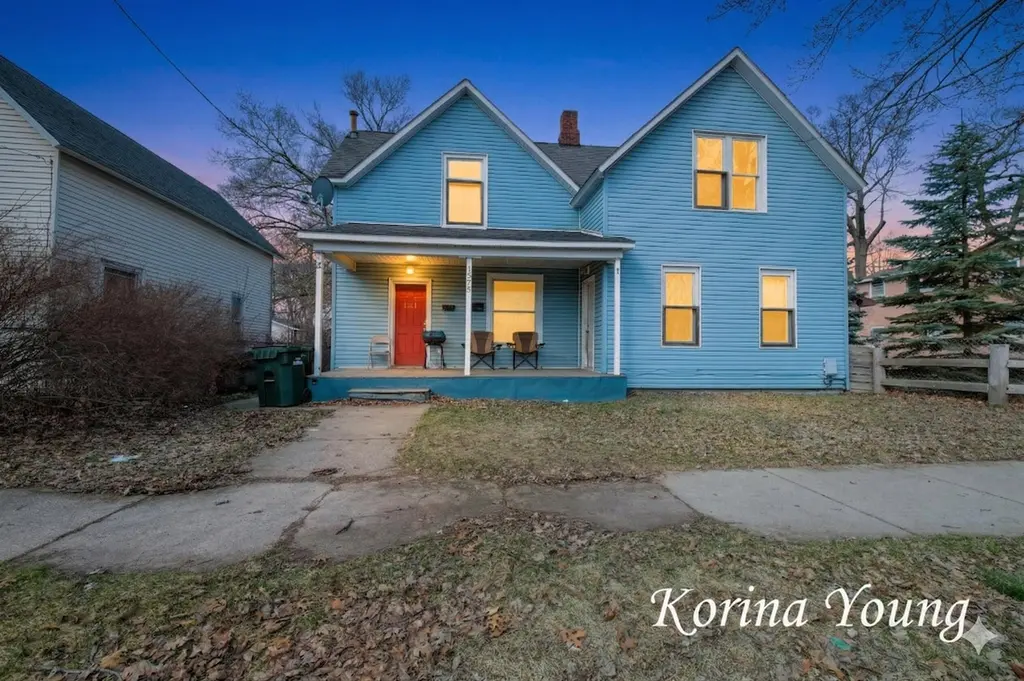
1575 Park St · Muskegon, MI
Flood risk 1/10 · Minimal
- FEMA flood zone
- X (unshaded)
- Chance of flooding over 30 yrs
- 0.0%
- Est. flood insurance / yr
- $473 – $860
Fire risk 1/10 · Minimal
- Est. fire insurance / yr
- $784 – $1,456
Heat risk 2/10 · Minimal
- Hot days now (above 93°F)
- 7 days/yr
- Hot days in 30 yrs
- 15 days/yr
Wind risk 1/10 · Minimal
- Chance of severe wind over 30 yrs
- —
Air-quality risk 4/10 · Minor
- Unhealthy air days now
- 5 days/yr
- Unhealthy air days in 30 yrs
- 7 days/yr
Risk factors via First Street. Map © Google.
Why this score? — see what drove the B- grade
The composite is a weighted blend of 9 inputs, each scored 0–100. Each bar is that input's sub-score; the figure is the points it added to the 100-point composite (weight × sub-score).
- Cash flow +25.8/30.0
- ARV discount +15.0/15.0
- DSCR +8.6/10.0
- 1% rule +7.3/10.0
- Rent growth +5.0/5.0
- Livability +4.0/5.0
- Condition / age +2.5/5.0
- Schools +0.6/10.0
- Appreciation +0.0/10.0
$129,900
🖨 Deal sheet (PDF) 📄 Offer letter ✓ Due diligence
Listing remarks MLS
Nice investment opportunity in the City of Muskegon. Larger unit has 3 bedrooms and 1 bath and the lower unit has 2 bedrooms and 1 bath. Whether you're looking to launch your next venture or invest in a property with long-term upside, this site is ready for your vision. Buyer to verify all information.
Key facts
- 6,534 sq ft lot
- 2 parking spots
- Built 1800
Property features AI
Exterior
- Parking: 2 parking spaces
- Utilities: Public water; Public sewer; Electricity connected; Natural gas connected; Cable connected; Phone available/connected; Sewer available
- Home design: Residential income property (multi-family)
- Construction: Wood siding exterior; Composition roof
- Exterior features: Paved road access
Interior
- Heating & cooling: Forced air heating; Natural gas heating
- Interior features: Partial basement
Neighborhood map
What this means for you Summary
Snapshot
- This is a 3-bed/2.0-bath single-family listed at $130k.
Deal economics
- At list price, monthly cash flow is $316 ($4k/yr) — positive.
- The deal already cash-flows at list — no discount required.
- Meets the 1% rule at list price ($2k rent vs $130k).
- Recommended offer: $122k (6.0% below list) — sets the bar for market timing.
- Cap rate 9.2% vs local median 4.7% in Muskegon — top-decile yield for the area; either an underpriced asset or a hidden risk that comps aren't pricing in. Stress-test before assuming the spread holds.
Location & tenants
- Location reads 79/100 on livability (#92 in MI, #2,096 nationally) — a middle-class / working-renter tenant base. Strengths: amenities A+, commute A+, cost of living A+; Watch: crime F, employment F.
- Muskegon Public Schools Of The City Of (urban): math 4% / reading 12% proficiency, ranked #534 of 540 in MI (top 99%) — low school quality limits family demand, transient renter base, plan for 1-2y turnover; 81% free/reduced lunch — lower-income household profile, screen leases tightly.
- Zoned schools: Muskegon Middle School (math 4% / reading 13%, grade F, #480 of 493 statewide, top 97%, 755 students, 87% FRL); Muskegon High School (math 8% / reading 27%, grade F, #632 of 713 statewide, top 89%, 1,039 students, 84% FRL) — zoned schools at 85% FRL track the district average.
- Market conditions: Rents rising fast (+18.1%/yr); 271 active listings in the ZIP; 13 comparable units currently listed for rent nearby; rentals at typical pace (median 23d on market — plan ~3-4 weeks tenant-placement turnaround); 438 units permitted in Muskegon County in 2024 (115 in 5+ unit buildings).
Forward outlook
- Local home prices are declining (-3.0%/yr); year-one equity from $898 of loan paydown is wiped out by about $4k of value loss. Plan a longer hold.
- Muskegon County population projected to shrink 8% by 2050 — rents likely to lag national; underwrite the cash flow, not the appreciation.
- At projected returns (-3.0% appreciation + 8.0% rent growth), your $36k cash investment doubles in ~7 years — after that, you're playing with house money.
Negotiation context
- It's been on market 79 days — a 6% lower offer ($122k) is reasonable based on typical stale-listing flexibility.
- 8 sale attempts since 23y ago with the ask held roughly flat each time — persistent listings suggest the price (not the market) is what's stuck; bring a comps-based counter.
- Current owner paid $83k; list at $130k implies a 56% gain — meaningful room to come down on a strong offer.
Risks & watch-outs
- Watch-outs: built in 1800 — expect roof / HVAC / electrical / plumbing capex.
Questions for the listing agent
- It's been on market 79 days. Have you received any prior offers? Is the seller open to a 6% concession, seller financing, or rate buy-down credit?
- Built in 1800 — when were the roof, HVAC, electrical panel, plumbing, and water heater last replaced?
- Why hasn't it sold? Are there any deal-killer items the seller is aware of (foundation, flood, title, zoning, code violations)?
- Is there a deadline driving the sale (1031 exchange, divorce, estate, relocation)? That informs how much negotiation room exists.
- Schools are D-rated, which usually means shorter tenancies and higher turnover. Who's the typical renter profile here, and what's been the actual vacancy rate?
- Crime grade is F in this area — have there been break-ins, vandalism, or insurance claims at this property in the last 3 years? What carrier currently insures it and at what premium?
- What's the average days-on-market for RENTAL listings here right now (not sales)? A rising rental-DOM trend means longer vacancies and softer asking-rent achievability than the comps imply.
- What's the recent tenant-quality profile in this submarket — average credit score on applications, eviction rate, late-payment / NSF rate, and stable-employment percentage? A property-management company in the area should have these aggregated.
- How much new for-sale + rental construction is in the pipeline within 1–3 miles? Heavy new supply typically softens prices + rents 12–24 months out; constrained supply supports both.
Investment metrics
- 1% rule
- 1.23% ✓
- Cap rate
- 9.21%
- Cash-on-cash
- 10.41%
- DSCR
- 1.46
- GRM
- 6.8
CMA / ARV
- ARV (on-the-fly)
- $238,278
- Comps found
- 12
Show comp detail 12 sales within ~0.75 mi
| Address | Dist | Beds/Ba | Sqft | Sold | Price | $/sf | Match |
|---|---|---|---|---|---|---|---|
| 314 W Southern Ave | 0.16mi | 4/1.5 (+1) | 1,558 (-1%) | 2mo | $141,400 | $91 | 82 |
| 352 Mason Ave | 0.25mi | 3/2.5 | 1,456 (-8%) | 2mo | $255,000 | $175 | 72 |
| 817 W Dale Ave | 0.45mi | 3/1.0 | 1,672 (+6%) | 1mo | $210,000 | $126 | 64 |
| 213 Merrill Ave | 0.52mi | 3/2.5 | 1,482 (-6%) | 3mo | $265,000 | $179 | 61 |
| 209 Merrill Ave | 0.52mi | 3/2.5 | 1,482 (-6%) | 6mo | $249,900 | $169 | 58 |
| 593 W Webster Ave | 0.43mi | 2/2.5 (-1) | 1,760 (+12%) | 1mo | $356,000 | $202 | 53 |
| 213 Washington Ave | 0.32mi | 4/1.0 (+1) | 1,807 (+14%) | 2mo | $149,000 | $82 | 50 |
| 905 W Forest Ave | 0.55mi | 4/2.0 (+1) | 1,414 (-10%) | 5mo | $169,000 | $120 | 48 |
| 2111 6th St | 0.72mi | 4/2.0 (+1) | 1,452 (-8%) | 4mo | $62,000 | $43 | 45 |
| 1138 Sanford St | 0.72mi | 3/2.0 | 1,364 (-14%) | 2mo | $215,000 | $158 | 42 |
| 1936 Crowley St | 0.64mi | 3/1.0 | 1,388 (-12%) | 6mo | $210,000 | $151 | 41 |
| 1532 Leahy St | 0.72mi | 3/1.0 | 1,376 (-13%) | 3mo | $118,850 | $86 | 38 |
Match score weights: distance 35% · size 25% · config 20% · recency 20%. Top-matched comps best support the ARV.
Projected returns pro-forma
-3.0% appreciation · 8.0% rent growth · sell at horizon
- IRR
- 5.0%
- Equity multiple
- 1.21×
- Total profit
- $7,514
- Equity at exit
- $19,369
- IRR
- 18.8%
- Equity multiple
- 2.95×
- Total profit
- $70,923
- Equity at exit
- $11,231
Cash invested: $36,372 (down + closing). Projections, not guarantees.
Landlord ↔ Tenant lean methodology
- Overall (STATE)
- 62 Landlord-Friendly
- State Michigan
- 62 Landlord-Friendly · EVEN
- County
- — inherits STATE
- City
- — inherits STATE
ZIP-level market 49441
- Rents YoY
- 18.1%
- Active inventory
- 271
- Price-to-rent
- 6.8×
Monthly cashflow live
- Estimated rent
- $1,592 high interval (Pro) →
- Mortgage (P&I)
- −$681
- Tax from tax record
- −$207 /mo · $2,480/yr
- Insurance
- −$54
- HOA
- −$0
- Vacancy / Maint / Mgmt
- −$334
- Net cashflow
- $316
Break-even live
Sensitivity live
| Price | -10% $389 | -5% $352 | +0% $316 | +5% $279 | +10% $242 |
|---|---|---|---|---|---|
| Rent | -10% $190 | -5% $253 | +0% $316 | +5% $378 | +10% $441 |
| Rate | -1.0pp $381 | -0.5pp $349 | base $316 | +0.5pp $282 | +1.0pp $248 |
UW: 25.0% down · 7.5% · 30yr · 1.5% tax · 5.0% vac · 8.0% maint · 8.0% mgmt
Financing live
Cash to close
- Down payment
- $32,475
- Closing costs
- $3,897
- Reserves months
- —
- Total cash needed
- —
Loan-product check · same deal, 3 products live
Conventional
25% down · 7.5% · 30yr
- Down + closing
- —
- Monthly P&I
- —
- Monthly cashflow
- —
- DSCR
- —
- Eligible?
- —
Personal DTI + credit; lowest rate.
DSCR
20% down · 8.5% · 30yr
- Down + closing
- —
- Monthly P&I
- —
- Monthly cashflow
- —
- DSCR
- —
- Eligible?
- —
No personal income docs; deal must DSCR.
Hard money
10% down · 12.0% · 12mo
- Down + closing
- —
- Monthly P&I
- —
- Monthly cashflow
- —
- DSCR
- —
- Eligible?
- —
Short-term bridge; refi at stabilization.
Rent comps 13 comps
| Address | Beds | Baths | Sqft | Rent | $/sqft | DOM | Units | Dist |
|---|---|---|---|---|---|---|---|---|
| 449 Washington Ave Muskegon, MI | 3.0 | 2.0 | 1152 | $1,695 | $1.47 | 23d | 1 | 0.16mi |
| 1644 Beidler St Muskegon, MI | 3.0 | 2.0 | 1228 | $1,700 | $1.38 | 23d | 1 | 0.30mi |
| 1633 Peck St Unit 1 Muskegon, MI | 2.0 | 1.0 | 1184 | $1,150 | $0.97 | 23d | 1 | 0.53mi |
| 80 E Grand Ave Muskegon, MI | 3.0 | 1.5 | 1200 | $1,300 | $1.08 | 23d | 1 | 0.65mi |
| 1206 Terrace St Unit 1 Muskegon, MI | 2.0 | 1.0 | 1200 | $1,975 | $1.65 | 23d | 1 | 0.85mi |
| 2065 Dowd St Muskegon, MI | 3.0 | 2.0 | 1228 | $1,695 | $1.38 | 23d | 1 | 0.88mi |
| 2073 Dowd St Muskegon, MI | 3.0 | 2.5 | 1228 | $1,750 | $1.43 | 23d | 1 | 0.90mi |
| 292 W Western Ave Muskegon, MI | 1.0–2.0 | 1.0–2.0 | 1062 | $2,450 | $2.31 | 23d | 1 | 0.93mi |
| 1188 Spring St Muskegon, MI | 3.0 | 1.0 | 1443 | $1,500 | $1.04 | 23d | 1 | 1.02mi |
| 384 Iona Ave Muskegon, MI | 3.0 | 1.0 | 1194 | $1,275 | $1.07 | 23d | 1 | 1.22mi |
| 310 Allen Ave Unit 2 Muskegon, MI | 3.0 | 3.0 | 1100 | $1,490 | $1.35 | 23d | 1 | 1.24mi |
| 313 Orchard Ave Unit 1 Muskegon, MI | 3.0 | 3.0 | 1121 | $1,575 | $1.40 | 23d | 1 | 1.31mi |
| 313 Orchard Ave Unit 2 Muskegon, MI | 3.0 | 3.0 | 1279 | $1,475 | $1.15 | 23d | 1 | 1.31mi |
Listing history 38 events
-
2026-06-21days on market $129,900 Active 79 DOM
-
2026-06-19days on market $129,900 Active 77 DOM
-
2026-06-18days on market $129,900 Active 76 DOM
-
2026-06-17days on market $129,900 Active 75 DOM
-
2026-06-16days on market $129,900 Active 74 DOM
-
2026-06-15days on market $129,900 Active 73 DOM
-
2026-06-14days on market $129,900 Active 71 DOM
-
2026-06-13days on market $129,900 Active 70 DOM
-
2026-06-10days on market $129,900 Active 68 DOM
-
2026-06-09days on market $129,900 Active 67 DOM
-
2026-06-08days on market $129,900 Active 66 DOM
-
2026-06-07days on market $129,900 Active 65 DOM
-
2026-06-05days on market $129,900 Active 62 DOM
-
2026-06-03days on market $129,900 Active 61 DOM
-
2026-06-02days on market $129,900 Active 60 DOM
-
2026-06-01days on market $129,900 Active 59 DOM
-
2026-05-31days on market $129,900 Active 58 DOM
-
2026-05-30days on market $129,900 Active 57 DOM
-
2026-05-01price $129,900 303-char remark
Show marketing remark (303 chars)
Nice investment opportunity in the City of Muskegon. Larger unit has 3 bedrooms and 1 bath and the lower unit has 2 bedrooms and 1 bath. Whether you're looking to launch your next venture or invest in a property with long-term upside, this site is ready for your vision. Buyer to verify all information.
-
2026-05-01price $129,900
Show marketing remark (303 chars)
Nice investment opportunity in the City of Muskegon. Larger unit has 3 bedrooms and 1 bath and the lower unit has 2 bedrooms and 1 bath. Whether you're looking to launch your next venture or invest in a property with long-term upside, this site is ready for your vision. Buyer to verify all information.
-
2026-04-21status Active
Show marketing remark (303 chars)
Nice investment opportunity in the City of Muskegon. Larger unit has 3 bedrooms and 1 bath and the lower unit has 2 bedrooms and 1 bath. Whether you're looking to launch your next venture or invest in a property with long-term upside, this site is ready for your vision. Buyer to verify all information.
-
2026-04-21status Active 303-char remark
Show marketing remark (303 chars)
Nice investment opportunity in the City of Muskegon. Larger unit has 3 bedrooms and 1 bath and the lower unit has 2 bedrooms and 1 bath. Whether you're looking to launch your next venture or invest in a property with long-term upside, this site is ready for your vision. Buyer to verify all information.
-
2026-04-07historical 303-char remark
Show marketing remark (303 chars)
Nice investment opportunity in the City of Muskegon. Larger unit has 3 bedrooms and 1 bath and the lower unit has 2 bedrooms and 1 bath. Whether you're looking to launch your next venture or invest in a property with long-term upside, this site is ready for your vision. Buyer to verify all information.
-
2026-04-07historical
Show marketing remark (303 chars)
Nice investment opportunity in the City of Muskegon. Larger unit has 3 bedrooms and 1 bath and the lower unit has 2 bedrooms and 1 bath. Whether you're looking to launch your next venture or invest in a property with long-term upside, this site is ready for your vision. Buyer to verify all information.
-
2026-03-20$134,000 Active 303-char remark
Show marketing remark (303 chars)
Nice investment opportunity in the City of Muskegon. Larger unit has 3 bedrooms and 1 bath and the lower unit has 2 bedrooms and 1 bath. Whether you're looking to launch your next venture or invest in a property with long-term upside, this site is ready for your vision. Buyer to verify all information.
-
2026-03-20$134,000 Active
Show marketing remark (303 chars)
Nice investment opportunity in the City of Muskegon. Larger unit has 3 bedrooms and 1 bath and the lower unit has 2 bedrooms and 1 bath. Whether you're looking to launch your next venture or invest in a property with long-term upside, this site is ready for your vision. Buyer to verify all information.
-
2026-03-13historical
-
2025-10-14price $134,000
-
2025-10-14price $134,000
-
2025-09-04$148,000 Active
-
2025-09-04$148,000 Active
-
2021-02-16soldstatus $83,400
-
2020-10-29soldstatus $57,620
-
2013-06-06historical
-
2013-02-22$9,900
-
2004-11-23soldstatus $45,000
-
2003-04-23soldstatus $19,000
-
2003-03-20$18,900
ⓘ Source: listings_history table (triggers on properties + properties_extension) + one-shot
backfill from property_details.listing_events for pre-trigger history.
Tax reassessment forecast MI · Partial reset (capped growth)
- Current annual tax
- $2,480 · $207/mo
- Projected year-2 tax
- $2,480 · $207/mo
- Expected delta
- $0/yr ($0/mo · 0.0%)
ⓘ Screening estimate from a state-policy table — verify with the county assessor before closing.
Climate risk First Street
- Flood 1/10 Low FEMA zone X (unshaded) · 0% chance over 30 yrs
- Wildfire 1/10 Low
- Heat 2/10 Low 7 d/yr ≥93°F today · 15 d/yr by 30 yrs out
- Wind 1/10 Low
- Air quality 4/10 Moderate 5 unhealthy d/yr today · 7 by 30 yrs out
Nearby sold comps map
Loading sold comps map…
Walkable amenities ~0.75 mi
Loading nearby amenities…
Taxation est. · year 1
- Rental income
- $19,103
- − Mortgage interest
- −$7,276
- − Property taxes
- −$2,480
- − Insurance
- −$650
- − Repairs & maintenance
- −$1,528
- − Management
- −$1,528
- − Depreciation
- −$3,779
- Taxable income
- $1,861
- Est. tax owed @ 24.0%
- −$447
- After-tax cash flow
- $3,340/yr
For passive investors: Depreciation is non-cash, so a rental often shows a tax loss while cash-flowing — sheltering income. Rental losses are passive: they offset passive income freely, and up to $25,000/yr can offset ordinary (W-2) income if you actively participate and your MAGI is under $100k (phasing out to $0 by $150k); unused losses carry forward. On sale, claimed depreciation is recaptured at up to 25%, and gains may owe capital-gains tax (a 1031 exchange can defer both). Figures are a year-1 estimate at your 24.0% rate — not tax advice; consult a CPA.
Schools (NCES district)
- District
- Muskegon Public Schools Of The City Of
- NCES district ID
- 2624840
- Math proficiency
- 4% ▼ -9.00%
- Reading proficiency
- 12% ▼ -9.00%
- Median HH income
- $27,622
- Composite
- 5.8/100
- National rank
- #10017
- State rank
- #534 of 540 in MI
Livability — Muskegon
- Score
- 79/100
- State rank
- #92
- US rank
- #2096
Category grades
Schools grade is shown separately in the Schools card above.
Census & demographics
- Census place
- Muskegon, MI
- County
- Muskegon County · 107,917 people
- City population
- 26,372
- Metro
- Muskegon, MI
- Population (ZIP)
- 36,779
- Household income
- $67,427
- Rent vs Own
- Severe rent burden
- 938.0
Population outlook (Muskegon County) Hauer SSP2
- Today (2025)
- 174,032 people
- By 2030
- 173,365 · -0.4%
- By 2040
- 168,877 · -3.0%
- By 2050
- 160,306 · -7.9%
- By 2075
- 134,426 · -22.8%
- By 2100
- 98,836 · -43.2%
Race, ethnicity, and origin ACS 2023
- Neighborhood character
- Predominantly White (79%)
- Race & ethnicity
- White 79% Black 9% Two or more races 8% Hispanic / Latino 7%
- Hispanic origin (detail)
- Mexican 5%
- Common ancestry
- Iranian 8% Romanian 5% Lithuanian 2%
- Foreign-born
- 3% · Canada
- Languages at home
- 94% English-only · Spanish 4% German/W. Germanic 1%
Political lean MEDSL · Muskegon
- 2024 margin
- Toss-up / Even · D 48.4% · R 50.2% · Other 1.5%
- 2008→2024 swing
- -31.1pp toward R · 2008: 29.3pp · 2024: -1.8pp
- All cycles
- 2024: R+1.8 2020: D+0.6 2016: D+0.9 2012: D+17.8 2008: D+29.3
Not yet ingested
- Civics
- —
Market trends
- HPI YoY
- ▼ -448.86%
- Current HPI
- 263.8317
- Rent YoY
- ▲ 18.11%
- Metro
- Muskegon, MI
- State GDP YoY
- ▲ 1.37%
- F500 in state
- 28
Industry mix (Fortune 500 HQ in MI)
| Industry | F500 HQs | Revenue |
|---|---|---|
| Automotive Parts | 3 | $48B |
|
||
| Automotive | 2 | $372B |
|
||
| Chemicals | 1 | $45B |
|
||
| Automotive Retail | 1 | $29B |
|
||
| Healthcare / Medical Devices | 1 | $23B |
|
||
| Automotive Technology | 1 | $20B |
|
||
Price history
+587.3% since first listed20 events — show timeline
- 2026-05-01 Price Changed $129,900 MiRealSource-MiMLS
- 2026-05-01 Price Changed $129,900 REALCOMP
- 2026-04-21 Relisted — REALCOMP
- 2026-04-21 Relisted — MiRealSource-MiMLS
- 2026-04-07 Listing Removed — REALCOMP
- 2026-04-07 Listing Removed — MiRealSource-MiMLS
- 2026-03-20 Listed $134,000 REALCOMP
- 2026-03-20 Listed $134,000 MiRealSource-MiMLS
- 2026-03-13 Listing Removed — MiRealSource-MiMLS
- 2025-10-14 Price Changed $134,000 MiRealSource-MiMLS
- 2025-10-14 Price Changed $134,000 REALCOMP
- 2025-09-04 Listed $148,000 REALCOMP
- 2025-09-04 Listed $148,000 MiRealSource-MiMLS
- 2021-02-16 Sold (Public Records) $83,400 Public Records
- 2020-10-29 Sold (Public Records) $57,620 Public Records
- 2013-06-06 Listing Removed — SW Michigan MLS
- 2013-02-22 Listed $9,900 SW Michigan MLS
- 2004-11-23 Sold (Public Records) $45,000 Public Records
- 2003-04-23 Sold (MLS) $19,000 SW Michigan MLS
- 2003-03-20 Listed $18,900 SW Michigan MLS
Property tax history
+4.7%/yrLatest (2025): $2,480 · +2.2% YoY. Source: county tax records.
Cash-flow waterfall
monthlySold comps — $/sqft
last 12 mo · ≤1 miLoading sold comps…