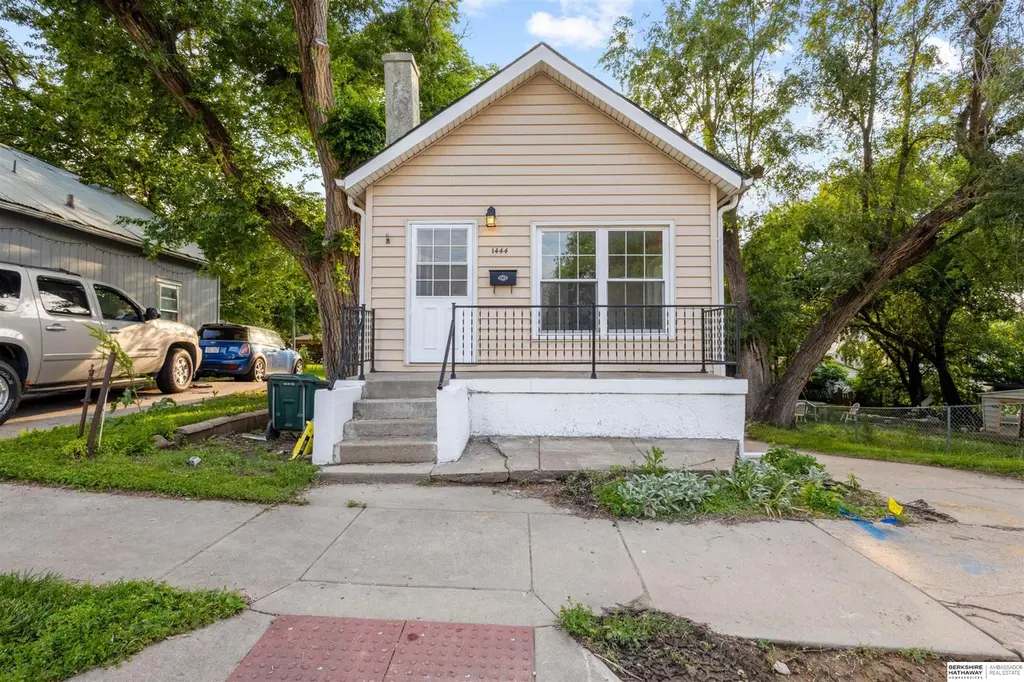
1444 S 16th St · Omaha, NE
Flood risk 1/10 · Minimal
- FEMA flood zone
- X (unshaded)
- Chance of flooding over 30 yrs
- 0.0%
- Est. flood insurance / yr
- $473 – $860
Fire risk 1/10 · Minimal
- Est. fire insurance / yr
- $1,161 – $2,155
Heat risk 3/10 · Minor
- Hot days now (above 103°F)
- 7 days/yr
- Hot days in 30 yrs
- 15 days/yr
Wind risk 2/10 · Minimal
- Chance of severe wind over 30 yrs
- —
Air-quality risk 1/10 · Minimal
- Unhealthy air days now
- 0 days/yr
- Unhealthy air days in 30 yrs
- 0 days/yr
Risk factors via First Street. Map © Google.
Why this score? — see what drove the D grade
The composite is a weighted blend of 9 inputs, each scored 0–100. Each bar is that input's sub-score; the figure is the points it added to the 100-point composite (weight × sub-score).
- Cash flow +13.4/30.0
- ARV discount +9.8/15.0
- Livability +4.2/5.0
- DSCR +4.0/10.0
- 1% rule +3.3/10.0
- Rent growth +2.7/5.0
- Condition / age +2.5/5.0
- Schools +2.1/10.0
- Appreciation +0.0/10.0
$154,900
🖨 Deal sheet (PDF) 📄 Offer letter ✓ Due diligence
Listing remarks
Beautifully updated two bedroom house updated throughout! This house has brand-new roof, furnace, AC, & water heater along with new floors, paint, kitchen, & bathrooms. As you enter, you're greeted with a spacious living room leading into the kitchen. This leads you into a bedroom with 3/4 bathroom. In the basement is an additional bedroom & full bathroom. There is a large laundry & utility room for extra storage space. Outside is a detached garage at the end of the long driveway. Check out this amazing home today!
Key facts
- Brand-new ac
- New floors
- New paint
Tags
Property features AI
Exterior
- Parking: Detached garage (1 covered space, 1 total parking space)
- Utilities: Public water; Public sewer
- Home design: Single-family residence; Residential property; Built in 1891; Total living area reported as 1058 (including finished below-grade area of 450 and above-grade area of 608)
- Construction: Block foundation
- Exterior features: Lot up to 1/4 acre; Lot dimensions approximately 98 x 42
Interior
- Bedrooms: Master bedroom on main floor; Second bedroom in basement
- Bathrooms: 2 total bathrooms (includes 1 full and 1 three-quarter)
- Heating & cooling: Natural gas forced air heating; Central air conditioning
- Interior features: Walk-out basement; No fireplaces
Neighborhood map
What this means for you Summary
Snapshot
- This is a 2-bed/1.5-bath single-family listed at $155k.
Deal economics
- At list price, monthly cash flow is $2 ($22/yr) — positive.
- The deal already cash-flows at list — no discount required.
- To meet the 1% rule (rent ≥ 1% of price), the offer needs to be $128k (17.4% below list).
- Recommended offer: $128k (17.4% below list) — sets the bar for 1% rule.
- Cap rate 6.3% vs local median 3.6% in Omaha — top-decile yield for the area; either an underpriced asset or a hidden risk that comps aren't pricing in. Stress-test before assuming the spread holds.
Location & tenants
- Location reads 84/100 on livability (#7 in NE, #663 nationally) — a professional / high-income tenant draw. Strengths: amenities A+, commute A+, cost of living A+; Watch: crime F.
- Omaha Public Schools (urban): math 20% / reading 28% proficiency, ranked #110 of 111 in NE (top 99%) — low school quality limits family demand, transient renter base, plan for 1-2y turnover; 62% free/reduced lunch — lower-income household profile, screen leases tightly.
- Zoned schools: Bancroft Elementary School (math 10% / reading 17%, grade F, #486 of 502 statewide, top 97%, 496 students, 0% FRL); Norris Middle School (math 11% / reading 16%, grade F, #126 of 128 statewide, top 98%, 1,187 students, 0% FRL); Central High School (math 29% / reading 40%, grade F, #208 of 261 statewide, top 86%, 2,738 students, 0% FRL) — zoned schools average 0% FRL vs 62% district-wide (62 pts lower); this property's tenant base skews higher-income than the district average.
- Market conditions: Rents flat; 74 active listings in the ZIP; 40 comparable units currently listed for rent nearby; rentals at typical pace (median 16d on market — plan ~3-4 weeks tenant-placement turnaround); 4,539 units permitted in Douglas County in 2024 (2,583 in 5+ unit buildings).
Forward outlook
- Local home prices are declining (-3.0%/yr); year-one equity from $1k of loan paydown is wiped out by about $5k of value loss. Plan a longer hold.
- Douglas County population projected at +28% by 2050 — long-run rental-demand tailwind backs the buy-and-hold thesis.
Negotiation context
- It's been on market 39 days — a 3% lower offer ($150k) is reasonable based on typical stale-listing flexibility.
- 15 sale attempts with the ask held roughly flat each time — persistent listings suggest the price (not the market) is what's stuck; bring a comps-based counter.
- Current owner paid $70k; list at $155k implies a 121% gain — meaningful room to come down on a strong offer.
Risks & watch-outs
- Watch-outs: built in 1891 — expect roof / HVAC / electrical / plumbing capex.
Questions for the listing agent
- It's been on market 39 days. Have you received any prior offers? Is the seller open to a 17% concession, seller financing, or rate buy-down credit?
- Built in 1891 — when were the roof, HVAC, electrical panel, plumbing, and water heater last replaced?
- Is there a deadline driving the sale (1031 exchange, divorce, estate, relocation)? That informs how much negotiation room exists.
- Crime grade is F in this area — have there been break-ins, vandalism, or insurance claims at this property in the last 3 years? What carrier currently insures it and at what premium?
- The area grade is low — what's the realistic commute time and amenity access for the typical tenant pool here? Any planned neighborhood developments (good or bad) we should know about?
- What's the average days-on-market for RENTAL listings here right now (not sales)? A rising rental-DOM trend means longer vacancies and softer asking-rent achievability than the comps imply.
- What's the recent tenant-quality profile in this submarket — average credit score on applications, eviction rate, late-payment / NSF rate, and stable-employment percentage? A property-management company in the area should have these aggregated.
- How much new for-sale + rental construction is in the pipeline within 1–3 miles? Heavy new supply typically softens prices + rents 12–24 months out; constrained supply supports both.
Investment metrics
- 1% rule
- 0.83% ✗
- Cap rate
- 6.31%
- Cash-on-cash
- 0.05%
- DSCR
- 1.00
- GRM
- 10.1
CMA / ARV
- ARV (median comp)
- $163,123
- List price
- $154,900
- Delta
- -5.04%
- Verdict
- FAIR
- Comps
- 20 within 1.0 mi
Show comp detail 12 sales within ~0.75 mi
| Address | Dist | Beds/Ba | Sqft | Sold | Price | $/sf | Match |
|---|---|---|---|---|---|---|---|
| 1416 Dorcas St | 0.32mi | 2/1.0 | 987 (+3%) | 3mo | $92,500 | $94 | 75 |
| 1715 S 18th St | 0.14mi | 3/1.0 (+1) | 956 (-0%) | 15mo | $170,000 | $178 | 74 |
| 1902 S 14th St | 0.24mi | 2/1.0 | 872 (-9%) | 1mo | $185,000 | $212 | 71 |
| 2428 S 19th St | 0.59mi | 2/1.5 | 952 (-1%) | 6mo | $105,000 | $110 | 66 |
| 2328 S 10 St | 0.62mi | 2/1.0 | 942 (-2%) | 6mo | $145,000 | $154 | 61 |
| 2329 S 11th St | 0.60mi | 2/1.0 | 988 (+3%) | 12mo | $135,000 | $137 | 55 |
| 1411 S 6th St | 0.72mi | 3/1.0 (+1) | 963 (+0%) | 5mo | $150,000 | $156 | 54 |
| 2502 Pierce St | 0.63mi | 3/1.0 (+1) | 1,008 (+5%) | 2mo | $193,000 | $191 | 53 |
| 1914 Bancroft St | 0.70mi | 2/1.5 | 900 (-6%) | 6mo | $98,000 | $109 | 52 |
| 2222 & 2220 S 15th St | 0.38mi | 3/1.0 (+1) | 900 (-6%) | 18mo | $97,000 | $108 | 50 |
| 2329 S 23 St | 0.63mi | 3/2.0 (+1) | 1,006 (+5%) | 21mo | $175,000 | $174 | 38 |
| 808 Hickory St | 0.54mi | 3/1.0 (+1) | 880 (-8%) | 21mo | $195,000 | $222 | 37 |
Match score weights: distance 35% · size 25% · config 20% · recency 20%. Top-matched comps best support the ARV.
Projected returns pro-forma
-3.0% appreciation · 0.85% rent growth · sell at horizon
- IRR
- -18.5%
- Equity multiple
- 0.36×
- Total profit
- $-27,711
- Equity at exit
- $23,096
- IRR
- -15.6%
- Equity multiple
- 0.20×
- Total profit
- $-34,703
- Equity at exit
- $13,393
Cash invested: $43,372 (down + closing). Projections, not guarantees.
Landlord ↔ Tenant lean methodology
- Overall (STATE)
- 83 Strongly Landlord-Friendly
- State Nebraska
- 83 Strongly Landlord-Friendly · R+13
- County
- — inherits STATE
- City
- — inherits STATE
ZIP-level market 68108
- Home prices YoY
- -19.0%
- Rents YoY
- 0.8%
- Active inventory
- 74
- Price-to-rent
- 10.1×
Monthly cashflow live
- Estimated rent
- $1,279 high interval (Pro) →
- Mortgage (P&I)
- −$812
- Tax from tax record
- −$132 /mo · $1,582/yr
- Insurance
- −$65
- HOA
- −$0
- Vacancy / Maint / Mgmt
- −$269
- Net cashflow
- $2
Break-even live
Sensitivity live
| Price | -10% $90 | -5% $46 | +0% $2 | +5% $-42 | +10% $-86 |
|---|---|---|---|---|---|
| Rent | -10% $-99 | -5% $-49 | +0% $2 | +5% $52 | +10% $103 |
| Rate | -1.0pp $80 | -0.5pp $41 | base $2 | +0.5pp $-38 | +1.0pp $-79 |
UW: 25.0% down · 7.5% · 30yr · 1.5% tax · 5.0% vac · 8.0% maint · 8.0% mgmt
Financing live
Cash to close
- Down payment
- $38,725
- Closing costs
- $4,647
- Reserves months
- —
- Total cash needed
- —
Loan-product check · same deal, 3 products live
Conventional
25% down · 7.5% · 30yr
- Down + closing
- —
- Monthly P&I
- —
- Monthly cashflow
- —
- DSCR
- —
- Eligible?
- —
Personal DTI + credit; lowest rate.
DSCR
20% down · 8.5% · 30yr
- Down + closing
- —
- Monthly P&I
- —
- Monthly cashflow
- —
- DSCR
- —
- Eligible?
- —
No personal income docs; deal must DSCR.
Hard money
10% down · 12.0% · 12mo
- Down + closing
- —
- Monthly P&I
- —
- Monthly cashflow
- —
- DSCR
- —
- Eligible?
- —
Short-term bridge; refi at stabilization.
Rent comps 40 comps
| Address | Beds | Baths | Sqft | Rent | $/sqft | DOM | Units | Dist |
|---|---|---|---|---|---|---|---|---|
| 1416 S 16th St Unit 105 Omaha, NE | 1.0 | 1.0 | 900 | $925 | $1.03 | 4d | 1 | 0.07mi |
| 1440 S 13th St Omaha, NE | 2.0 | 1.0–2.0 | 707 | $1,860 | $2.63 | 45d | 6 | 0.23mi |
| 1440 S 13th St Unit 205 Omaha, NE | 1.0 | 1.0 | 650 | $1,300 | $2.00 | 25d | 1 | 0.23mi |
| 1440 S 13th St Unit 203 Omaha, NE | 1.0 | 1.0 | 641 | $1,290 | $2.01 | 25d | 1 | 0.23mi |
| 1440 S 13th St Omaha, NE | 1.0 | 1.0 | 645 | $1,295 | $2.01 | 12d | 2 | 0.23mi |
| 1402 S 13th St Unit 2 Omaha, NE | 1.0 | 1.0 | 589 | $725 | $1.23 | 45d | 1 | 0.25mi |
| 1233 1/2 S 14th St Omaha, NE | 1.0 | 1.0 | 576 | $1,000 | $1.74 | 45d | 1 | 0.28mi |
| 1911 S 14th St Unit 1 Omaha, NE | 2.0 | 1.0 | 836 | $1,000 | $1.20 | 45d | 1 | 0.28mi |
| 1323 S 12th St Omaha, NE | 1.0–2.0 | 1.0–2.0 | 958 | $2,100 | $2.19 | 3d | 1 | 0.35mi |
| 1618 Martha St Unit 2 (Top) Omaha, NE | 3.0 | 1.0 | 1117 | $1,150 | $1.03 | 45d | 1 | 0.39mi |
| 1730 S 11th St Unit 22 Omaha, NE | 1.0 | 1.0 | 610 | $1,075 | $1.76 | 4d | 1 | 0.39mi |
| 1730 S 11th St Unit 35 Omaha, NE | 1.0 | 1.0 | 610 | $1,075 | $1.76 | 45d | 1 | 0.39mi |
| 1937 S 12th St Unit 3 Omaha, NE | 1.0 | 1.0 | 700 | $620 | $0.89 | 4d | 1 | 0.43mi |
| 1109 S 22nd St Omaha, NE | 1.0 | 1.0 | 800 | $1,100 | $1.38 | 45d | 1 | 0.46mi |
| 2416 S 16th St Unit 2426 Omaha, NE | 1.0 | 1.0 | 1005 | $850 | $0.85 | 25d | 1 | 0.53mi |
| 1508 Marcy St Omaha, NE | 1.0 | 1.0–1.5 | 839 | $1,595 | $1.90 | 23d | 4 | 0.53mi |
| 913 Forest Ave Unit 913-1 Omaha, NE | 2.0 | 2.0 | 1100 | $1,695 | $1.54 | 16d | 1 | 0.53mi |
| 925 Pierce St Apt 219 Omaha, NE | 1.0 | 1.0 | 715 | $1,395 | $1.95 | 4d | 1 | 0.54mi |
| 925 Pierce St Unit 112 Omaha, NE | 2.0 | 2.0 | 1086 | $1,795 | $1.65 | 4d | 1 | 0.54mi |
| 925 Pierce St Unit 123 Omaha, NE | 2.0 | 1.0 | 1056 | $1,895 | $1.79 | 45d | 1 | 0.54mi |
| 925 Pierce St Unit 223 Omaha, NE | 2.0 | 1.0 | 1056 | $1,600 | $1.52 | 25d | 1 | 0.54mi |
| 802 S 14th St Omaha, NE | 1.0–2.0 | 1.0–1.5 | 779 | $1,132 | $1.45 | 4d | 3 | 0.58mi |
| 1311 S 9th St Omaha, NE | 1.0 | 1.0 | 743 | $1,350 | $1.82 | 3d | 37 | 0.59mi |
| 1910 1/2 S 8th St Omaha, NE | 2.0 | 1.0 | 1116 | $1,350 | $1.21 | 4d | 1 | 0.59mi |
| 1517 S 8th St Omaha, NE | 1.0–2.0 | 1.0–2.0 | 865 | $2,000 | $2.31 | 3d | 90 | 0.59mi |
| 815 Pierce St Omaha, NE | 3.0 | 1.0 | 968 | $1,500 | $1.55 | 45d | 1 | 0.61mi |
| 815 Pierce St Omaha, NE | 3.0 | 1.0 | 968 | $1,500 | $1.55 | 25d | 1 | 0.61mi |
| 815 Pierce St Omaha, NE | 3.0 | 1.0 | 968 | $1,500 | $1.55 | 16d | 1 | 0.61mi |
| 1012 S 24th St Omaha, NE | 1.0–3.0 | 1.0 | 918 | $1,050 | $1.14 | 4d | 5 | 0.66mi |
| 2116 Leavenworth St Omaha, NE | 1.0–3.0 | 1.0–2.0 | 911 | $1,180 | $1.29 | 16d | 11 | 0.68mi |
| 1318 Jones St Unit 204 Omaha, NE | 1.0 | 1.0 | 1066 | $1,300 | $1.22 | 16d | 1 | 0.69mi |
| 601 S 16th St Omaha, NE | 1.0–2.0 | 1.0 | 750 | $975 | $1.30 | 4d | 2 | 0.70mi |
| 1501 Jackson St Omaha, NE | 1.0–2.0 | 1.0–2.0 | 975 | $1,799 | $1.84 | 4d | 9 | 0.71mi |
| 1009 Leavenworth St Omaha, NE | 1.0–2.0 | 1.0 | 875 | $1,200 | $1.37 | 4d | 3 | 0.71mi |
| 2612 S 12th St Omaha, NE | 3.0 | 2.0 | 1100 | $2,100 | $1.91 | 16d | 1 | 0.72mi |
| 2011 S 7th St Omaha, NE | 2.0 | 1.0 | 750 | $975 | $1.30 | 16d | 1 | 0.72mi |
| 907 S 25th St Omaha, NE | 2.0 | 1.0–2.0 | 930 | $1,360 | $1.46 | 16d | 6 | 0.73mi |
| 1323 Jackson St Omaha, NE | 1.0–2.0 | 1.0–2.0 | 1169 | $1,545 | $1.32 | 4d | 3 | 0.73mi |
| 1213 Jackson St Omaha, NE | 1.0 | 1.0 | 600 | $839 | $1.40 | 16d | 1 | 0.76mi |
| 505 S 16th St Omaha, NE | 1.0 | 1.0 | 500 | $895 | $1.79 | 4d | 6 | 0.77mi |
Listing history 44 events
-
2026-06-21days on market $154,900 Active 39 DOM
-
2026-06-18days on market $154,900 Active 36 DOM
-
2026-06-17days on market $154,900 Active 35 DOM
-
2026-06-16days on market $154,900 Active 34 DOM
-
2026-06-15days on market $154,900 Active 33 DOM
-
2026-06-13days on market $154,900 Active 31 DOM
-
2026-06-10days on market $154,900 Active 28 DOM
-
2026-06-09days on market $154,900 Active 27 DOM
-
2026-06-08days on market $154,900 Active 26 DOM
-
2026-06-07days on market $154,900 Active 25 DOM
-
2026-06-03days on market $154,900 Active 21 DOM
-
2026-06-03days on market $154,900 Active 20 DOM
-
2026-06-01days on market $154,900 Active 19 DOM
-
2026-06-01days on market $154,900 Active 18 DOM
-
2026-05-13historical
-
2026-05-12$154,900 New 536-char remark
-
2026-04-16historical
-
2026-04-15$155,900 New
-
2026-03-30status Back On Market
-
2026-03-23status Pending
-
2026-03-13$156,900 New
-
2026-03-13historical
-
2026-03-07$157,900 New
-
2026-03-07historical
-
2026-02-19$158,900 New
-
2026-02-19historical
-
2026-02-05$159,900 New
-
2026-02-05historical
-
2026-01-12$162,900 New
-
2026-01-04historical
-
2025-12-03$163,500 New
-
2025-12-03historical
-
2025-11-26$164,000 New
-
2025-11-26historical
-
2025-11-18historical
-
2025-11-17$164,500 New
-
2025-10-10$165,000 New
-
2025-08-22historical
-
2025-07-07$166,900 New
-
2025-07-07historical
-
2025-06-27historical
-
2025-06-26$169,800 New
-
2025-06-05$169,900 New
-
2025-01-02soldstatus $70,000
ⓘ Source: listings_history table (triggers on properties + properties_extension) + one-shot
backfill from property_details.listing_events for pre-trigger history.
Tax reassessment forecast NE · Resets to sale price
- Current annual tax
- $1,582 · $132/mo
- Projected year-2 tax
- $2,680 · $223/mo
- Expected delta
- +$1,098/yr (+$91/mo · 69.4%)
ⓘ Screening estimate from a state-policy table — verify with the county assessor before closing.
Climate risk First Street
- Flood 1/10 Low FEMA zone X (unshaded) · 0% chance over 30 yrs
- Wildfire 1/10 Low
- Heat 3/10 Moderate 7 d/yr ≥103°F today · 15 d/yr by 30 yrs out
- Wind 2/10 Low
- Air quality 1/10 Low 0 unhealthy d/yr today · 0 by 30 yrs out
Nearby sold comps map
Loading sold comps map…
Walkable amenities ~0.75 mi
Loading nearby amenities…
Taxation est. · year 1
- Rental income
- $15,350
- − Mortgage interest
- −$8,677
- − Property taxes
- −$1,582
- − Insurance
- −$774
- − Repairs & maintenance
- −$1,228
- − Management
- −$1,228
- − Depreciation
- −$4,506
- Taxable loss
- −$2,646
- Est. tax savings @ 24.0%
- +$635
- After-tax cash flow
- $657/yr
For passive investors: Depreciation is non-cash, so a rental often shows a tax loss while cash-flowing — sheltering income. Rental losses are passive: they offset passive income freely, and up to $25,000/yr can offset ordinary (W-2) income if you actively participate and your MAGI is under $100k (phasing out to $0 by $150k); unused losses carry forward. On sale, claimed depreciation is recaptured at up to 25%, and gains may owe capital-gains tax (a 1031 exchange can defer both). Figures are a year-1 estimate at your 24.0% rate — not tax advice; consult a CPA.
Schools (NCES district)
- District
- Omaha Public Schools
- NCES district ID
- 3174820
- Math proficiency
- 20% ▼ -10.00%
- Reading proficiency
- 28% ▼ -5.00%
- Median HH income
- $46,039
- Composite
- 20.83/100
- National rank
- #8502
- State rank
- #110 of 111 in NE
Livability — Omaha
- Score
- 84/100
- State rank
- #7
- US rank
- #663
Category grades
Schools grade is shown separately in the Schools card above.
Census & demographics
- Census place
- Omaha, NE
- County
- Douglas County · 538,646 people
- City population
- 552,986
- Metro
- Omaha-Council Bluffs, NE-IA
- Population (ZIP)
- 14,578
- Household income
- $53,609
- Rent vs Own
- Severe rent burden
- 511.0
Population outlook (Douglas County) Hauer SSP2
- Today (2025)
- 625,245 people
- By 2030
- 661,613 · +5.8%
- By 2040
- 732,395 · +17.1%
- By 2050
- 801,988 · +28.3%
- By 2075
- 968,637 · +54.9%
- By 2100
- 1,101,871 · +76.2%
Race, ethnicity, and origin ACS 2023
- Neighborhood character
- Diverse neighborhood (Simpson 0.57)
- Race & ethnicity
- Hispanic / Latino 47% White 45% Two or more races 18% Black 2% Native American 2% Asian 1%
- Hispanic origin (detail)
- Mexican 33%
- Common ancestry
- Romanian 3% Lithuanian 2% Portuguese 2%
- Foreign-born
- 21% · Canada
- Languages at home
- 57% English-only · Spanish 40% Korean 2%
Political lean MEDSL · Douglas
- 2024 margin
- D (+10.2) · D 54.4% · R 44.2% · Other 1.4%
- 2008→2024 swing
- +5.5pp toward D · 2008: 4.6pp · 2024: 10.2pp
- All cycles
- 2024: D+10.2 2020: D+11.3 2016: D+1.4 2012: R+4.3 2008: D+4.6
Not yet ingested
- Civics
- —
Market trends
- HPI YoY
- ▼ -75.17%
- Current HPI
- 320.3596
- Rent YoY
- ▲ 0.85%
- Metro
- Omaha-Council Bluffs, NE-IA
- State GDP YoY
- ▲ 0.68%
- F500 in state
- 2
Industry mix (Fortune 500 HQ in NE)
| Industry | F500 HQs | Revenue |
|---|---|---|
| Conglomerate | 1 | $371B |
|
||
Price history
+121.3% since first listed30 events — show timeline
- 2026-05-13 Listing Removed — GPRMLS
- 2026-05-12 Listed $154,900 GPRMLS
- 2026-04-16 Listing Removed — GPRMLS
- 2026-04-15 Listed $155,900 GPRMLS
- 2026-03-30 Relisted — GPRMLS
- 2026-03-23 Pending — GPRMLS
- 2026-03-13 Listing Removed — GPRMLS
- 2026-03-13 Listed $156,900 GPRMLS
- 2026-03-07 Listing Removed — GPRMLS
- 2026-03-07 Listed $157,900 GPRMLS
- 2026-02-19 Listing Removed — GPRMLS
- 2026-02-19 Listed $158,900 GPRMLS
- 2026-02-05 Listing Removed — GPRMLS
- 2026-02-05 Listed $159,900 GPRMLS
- 2026-01-12 Listed $162,900 GPRMLS
- 2026-01-04 Listing Removed — GPRMLS
- 2025-12-03 Listing Removed — GPRMLS
- 2025-12-03 Listed $163,500 GPRMLS
- 2025-11-26 Listing Removed — GPRMLS
- 2025-11-26 Listed $164,000 GPRMLS
- 2025-11-18 Listing Removed — GPRMLS
- 2025-11-17 Listed $164,500 GPRMLS
- 2025-10-10 Listed $165,000 GPRMLS
- 2025-08-22 Listing Removed — GPRMLS
- 2025-07-07 Listing Removed — GPRMLS
- 2025-07-07 Listed $166,900 GPRMLS
- 2025-06-27 Listing Removed — GPRMLS
- 2025-06-26 Listed $169,800 GPRMLS
- 2025-06-05 Listed $169,900 GPRMLS
- 2025-01-02 Sold (Public Records) $70,000 Public Records
Property tax history
+4.9%/yrLatest (2025): $1,582 · +34.4% YoY. Source: county tax records.
Cash-flow waterfall
monthlySold comps — $/sqft
last 12 mo · ≤1 miLoading sold comps…