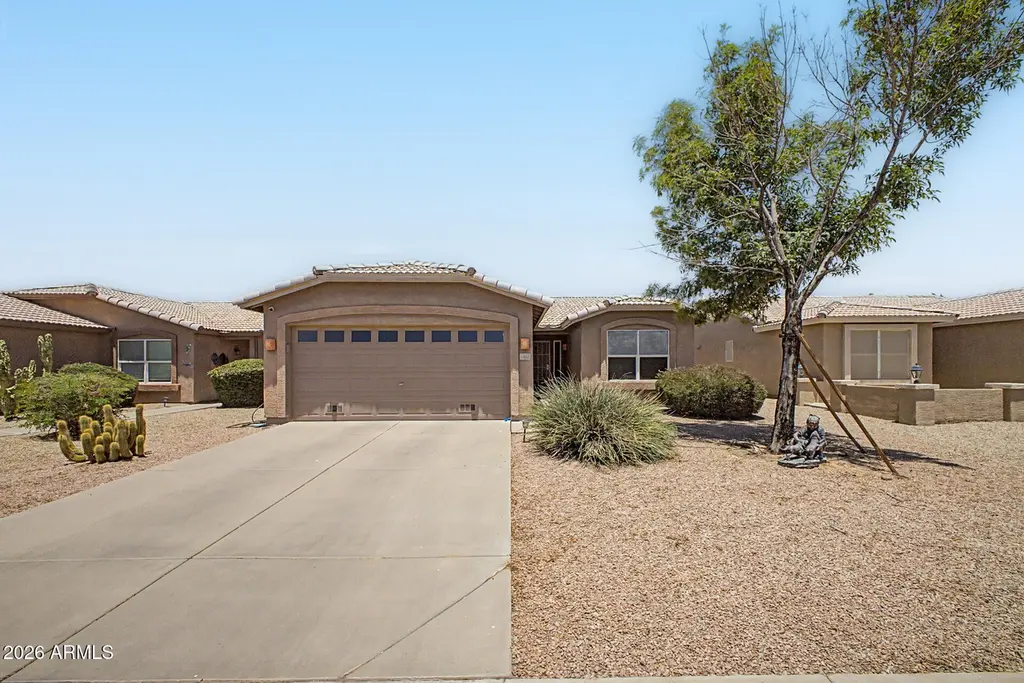
1462 E Torrey Pines Ln · Chandler, AZ
Flood risk 3/10 · Minor
- FEMA flood zone
- X (shaded)
- Chance of flooding over 30 yrs
- 0.12%
- Est. flood insurance / yr
- $507 – $1,088
Fire risk 5/10 · Moderate
- Est. fire insurance / yr
- $610 – $1,132
Heat risk 9/10 · Severe
- Hot days now (above 112°F)
- 6 days/yr
- Hot days in 30 yrs
- 15 days/yr
Wind risk 1/10 · Minimal
- Chance of severe wind over 30 yrs
- —
Air-quality risk 1/10 · Minimal
- Unhealthy air days now
- 0 days/yr
- Unhealthy air days in 30 yrs
- 0 days/yr
Risk factors via First Street. Map © Google.
Why this score? — see what drove the D- grade
The composite is a weighted blend of 9 inputs, each scored 0–100. Each bar is that input's sub-score; the figure is the points it added to the 100-point composite (weight × sub-score).
- Cash flow +12.2/30.0
- ARV discount +5.0/15.0
- Schools +4.8/10.0
- Livability +3.9/5.0
- DSCR +3.6/10.0
- Rent growth +3.3/5.0
- 1% rule +3.1/10.0
- Condition / age +2.5/5.0
- Appreciation +0.0/10.0
$335,000
🖨 Deal sheet (PDF) 📄 Offer letter ✓ Due diligence
Listing remarks MLS
Welcome to Springfield, a guard-gated 55+ adult golf community in 85249! The community has a lot to offer including a restaurant, golf course, clubhouse with two pools, a hot tub, tennis and pickleball courts, fitness center, activity rooms, billiard room, library & more! This sought after ''retreat'' floorplan, features 2 bedrooms & 2 bathrooms, an open living space, vaulted ceilings, open kitchen, & an indoor laundry room. The primary suite has a large walk-in closet, dual vanity sinks & is split from the secondary bedroom & bathroom. Enjoy the beautiful AZ weather under the covered patio in the private backyard. This home is turn-key, well maintained and ready for a new owner. A percentage of the owner's residence in the community can be 40+ years old.
Key facts
- 4,750 sq ft lot
- 2 garage spots
- Community pool
Property features AI
Finance
- Other: Enter at visitors guard gate off of McQueen
- HOA & community: Homeowners association with semi-annual fee for grounds maintenance; Community amenities include pool, golf, pickleball courts, community spa (heated), fitness center, and biking/walking paths
Exterior
- Parking: 2 covered parking spaces; 2 open parking spaces; 2-car garage with direct access and garage door opener
- Security: Gated community
- Utilities: City water; Public sewer
- Home design: Single family residence; Fee simple ownership
- Construction: Stucco and painted wood frame construction
- Exterior features: Desert front and back landscaping; Gravel/stone front and back; Block fencing; Tile roof
Interior
- Kitchen: Built-in microwave; Refrigerator; Dishwasher; Pantry
- Bedrooms: 2 possible bedrooms
- Flooring: Carpet; Tile
- Bathrooms: 2 full bathrooms
- Heating & cooling: Natural gas heating; Central air; Ceiling fans
- Interior features: High-speed internet; Double vanity; Eat-in kitchen; Pantry; Master bedroom with 3/4 bath
Neighborhood map
What this means for you Summary
Snapshot
- This is a 2-bed/3.0-bath single-family listed at $335k.
Deal economics
- At list price, monthly cash flow is $-69 ($-833/yr) — negative.
- To cash-flow at today's rent, offer at most $323k (3.7% below list).
- To meet the 1% rule (rent ≥ 1% of price), the offer needs to be $271k (19.1% below list).
- Recommended offer: $271k (19.1% below list) — sets the bar for 1% rule.
- Cap rate 6.0% vs local median 3.3% in Chandler — top-decile yield for the area; either an underpriced asset or a hidden risk that comps aren't pricing in. Stress-test before assuming the spread holds.
Location & tenants
- Location reads 78/100 on livability (#9 in AZ, #2,508 nationally) — a middle-class / working-renter tenant base. Strengths: employment A+, housing A+, crime A-; Watch: health & safety D, cost of living D-.
- Chandler Unified District #80 (4242) (suburban): math 49% / reading 57% proficiency, ranked #31 of 249 in AZ (top 12%) — acceptable for families but not a draw, mixed tenant base, ~2y average lease.
- Zoned schools: Knox Gifted Academy (math 90% / reading 97%, grade A+, #1 of 1,109 statewide, top 0%, 672 students, 6% FRL); Santan Junior High School (math 46% / reading 56%, grade C, #23 of 218 statewide, top 11%, 1,234 students, 13% FRL); Arizona College Prep High School (math 91% / reading 83%, grade A, #2 of 381 statewide, top 0%, 1,775 students, 7% FRL) — zoned schools average 9% FRL vs 25% district-wide (17 pts lower); this property's tenant base skews higher-income than the district average.
- Zoned-school proficiency averages 77% at this address vs 53% district-wide (+24 pts) — the actual schools serving this property are materially stronger than the Chandler Unified District #80 (4242) average implies; a family-tenant draw the district grade alone would hide.
- Market conditions: Rents rising (+3.0%/yr); 298 active listings in the ZIP; 11 comparable units currently listed for rent nearby; rentals at typical pace (median 22d on market — plan ~3-4 weeks tenant-placement turnaround); high-income renter base; 36,011 units permitted in Maricopa County in 2024 (12,801 in 5+ unit buildings).
Forward outlook
- Local home prices are declining (-3.0%/yr); year-one equity from $2k of loan paydown is wiped out by about $10k of value loss. Plan a longer hold.
- Maricopa County population projected at +38% by 2050 — long-run rental-demand tailwind backs the buy-and-hold thesis.
Negotiation context
- Only 10 days on market — expect competitive offers; lowballing is unlikely to land.
- 4 sale attempts since 5y ago; this cycle's ask has dropped $50k (13%) from the opening price — seller is motivated, your offer sets the floor, not the list.
Risks & watch-outs
- Climate carrying-cost: moderate wildfire risk; extreme-heat days projected 6→15/yr by 2055 (HVAC capex compounding) — expect insurance premiums to compound above CPI over the hold.
Questions for the listing agent
- What do current leases actually rent for vs. the listed asking? Can we see a recent rent roll and the last 12 months of T-12 income?
- What does the HOA fee cover, when was the last increase, and are there any pending special assessments or reserve-fund shortfalls?
- Is there a deadline driving the sale (1031 exchange, divorce, estate, relocation)? That informs how much negotiation room exists.
- Schools are B-rated — typically a magnet for longer-tenancy family renters. What's the average tenant stay here, and is there a school-zone premium baked into asking?
- The area grade is low — what's the realistic commute time and amenity access for the typical tenant pool here? Any planned neighborhood developments (good or bad) we should know about?
- What's the average days-on-market for RENTAL listings here right now (not sales)? A rising rental-DOM trend means longer vacancies and softer asking-rent achievability than the comps imply.
- What's the recent tenant-quality profile in this submarket — average credit score on applications, eviction rate, late-payment / NSF rate, and stable-employment percentage? A property-management company in the area should have these aggregated.
- How much new for-sale + rental construction is in the pipeline within 1–3 miles? Heavy new supply typically softens prices + rents 12–24 months out; constrained supply supports both.
Investment metrics
- 1% rule
- 0.81% ✗
- Cap rate
- 6.04%
- Cash-on-cash
- -0.89%
- DSCR
- 0.96
- GRM
- 10.3
CMA / ARV
- ARV (on-the-fly)
- $317,112
- Comps found
- 12
Show comp detail 12 sales within ~0.75 mi
| Address | Dist | Beds/Ba | Sqft | Sold | Price | $/sf | Match |
|---|---|---|---|---|---|---|---|
| 1435 E Augusta Ave | 0.07mi | 2/2.0 | 1,086 (0%) | 0mo | $320,000 | $295 | 93 |
| 1482 E Torrey Pines Ln | 0.02mi | 2/2.0 | 1,060 (-2%) | 2mo | $327,000 | $308 | 89 |
| 1440 E La Costa Dr | 0.23mi | 2/2.0 | 1,100 (+1%) | 1mo | $327,500 | $298 | 82 |
| 1362 E Cherry Hills Dr | 0.10mi | 2/2.0 | 1,186 (+9%) | 1mo | $320,000 | $270 | 75 |
| 1581 E Augusta Ave | 0.17mi | 2/2.0 | 1,175 (+8%) | 1mo | $325,000 | $277 | 74 |
| 6050 S Windstream Pl | 0.13mi | 2/2.0 | 1,199 (+10%) | 0mo | $349,990 | $292 | 72 |
| 1521 E Buena Vista Dr | 0.50mi | 2/2.0 | 1,065 (-2%) | 2mo | $345,000 | $324 | 68 |
| 1460 E Doral Dr | 0.37mi | 2/2.0 | 1,170 (+8%) | 1mo | $329,500 | $282 | 65 |
| 1972 E Doral Dr | 0.62mi | 2/2.0 | 1,029 (-5%) | 1mo | $316,000 | $307 | 58 |
| 1822 E Riviera Dr | 0.48mi | 2/2.0 | 974 (-10%) | 1mo | $260,000 | $267 | 55 |
| 6541 S Cypress Point Dr | 0.54mi | 2/2.0 | 974 (-10%) | 1mo | $279,000 | $286 | 53 |
| 1518 E Spyglass Dr | 0.44mi | 1/2.0 (-1) | 1,195 (+10%) | 1mo | $325,000 | $272 | 53 |
Match score weights: distance 35% · size 25% · config 20% · recency 20%. Top-matched comps best support the ARV.
Projected returns pro-forma
-3.0% appreciation · 3.05% rent growth · sell at horizon
- IRR
- -17.7%
- Equity multiple
- 0.38×
- Total profit
- $-58,589
- Equity at exit
- $49,950
- IRR
- -9.8%
- Equity multiple
- 0.40×
- Total profit
- $-56,240
- Equity at exit
- $28,965
Cash invested: $93,800 (down + closing). Projections, not guarantees.
Landlord ↔ Tenant lean methodology
- Overall (STATE)
- 87 Strongly Landlord-Friendly
- State Arizona
- 87 Strongly Landlord-Friendly · R+3
- County
- — inherits STATE
- City
- — inherits STATE
ZIP-level market 85249
- Home prices YoY
- -13.6%
- Rents YoY
- 3.0%
- Active inventory
- 298
- Price-to-rent
- 10.3×
Monthly cashflow live
- Estimated rent
- $2,711 high interval (Pro) →
- Mortgage (P&I)
- −$1,757
- Tax from tax record
- −$107 /mo · $1,284/yr
- Insurance
- −$140
- HOA
- −$208
- Vacancy / Maint / Mgmt
- −$569
- Net cashflow
- $-69
Break-even live
Sensitivity live
| Price | -10% $120 | -5% $25 | +0% $-69 | +5% $-164 | +10% $-259 |
|---|---|---|---|---|---|
| Rent | -10% $-284 | -5% $-176 | +0% $-69 | +5% $38 | +10% $145 |
| Rate | -1.0pp $99 | -0.5pp $16 | base $-69 | +0.5pp $-156 | +1.0pp $-244 |
UW: 25.0% down · 7.5% · 30yr · 1.5% tax · 5.0% vac · 8.0% maint · 8.0% mgmt
Financing live
Cash to close
- Down payment
- $83,750
- Closing costs
- $10,050
- Reserves months
- —
- Total cash needed
- —
Loan-product check · same deal, 3 products live
Conventional
25% down · 7.5% · 30yr
- Down + closing
- —
- Monthly P&I
- —
- Monthly cashflow
- —
- DSCR
- —
- Eligible?
- —
Personal DTI + credit; lowest rate.
DSCR
20% down · 8.5% · 30yr
- Down + closing
- —
- Monthly P&I
- —
- Monthly cashflow
- —
- DSCR
- —
- Eligible?
- —
No personal income docs; deal must DSCR.
Hard money
10% down · 12.0% · 12mo
- Down + closing
- —
- Monthly P&I
- —
- Monthly cashflow
- —
- DSCR
- —
- Eligible?
- —
Short-term bridge; refi at stabilization.
Rent comps 11 comps
| Address | Beds | Baths | Sqft | Rent | $/sqft | DOM | Units | Dist |
|---|---|---|---|---|---|---|---|---|
| 1452 E Torrey Pines Ln Chandler, AZ | 2.0 | 2.0 | 1199 | $3,900 | $3.25 | 22d | 1 | 0.01mi |
| 1464 E Runaway Bay Dr Chandler, AZ | 2.0 | 2.0 | 1072 | $1,975 | $1.84 | 26d | 1 | 0.17mi |
| 6381 S Championship Dr Chandler, AZ | 2.0 | 2.0 | 1065 | $2,800 | $2.63 | 0d | 1 | 0.32mi |
| 6242 S Cypress Point Dr Chandler, AZ | 2.0 | 2.0 | 921 | $1,700 | $1.85 | 20d | 1 | 0.34mi |
| 6481 S Windstream Pl Chandler, AZ | 2.0 | 2.0 | 1258 | $3,500 | $2.78 | 0d | 1 | 0.34mi |
| 1864 E Augusta Ave Chandler, AZ | 2.0 | 2.0 | 930 | $1,750 | $1.88 | 5d | 1 | 0.43mi |
| 1830 E Westchester Dr Chandler, AZ | 2.0 | 2.0 | 1017 | $1,800 | $1.77 | 26d | 1 | 0.68mi |
| 1830 E Westchester Dr Chandler, AZ | 2.0 | 2.0 | 1017 | $1,800 | $1.77 | 45d | 1 | 0.69mi |
| 6761 S Oakmont Dr Chandler, AZ | 2.0 | 2.0 | 1469 | $2,200 | $1.50 | 22d | 1 | 0.76mi |
| 6973 S Oakmont Dr Chandler, AZ | 2.0 | 2.0 | 1467 | $2,500 | $1.70 | 45d | 1 | 0.96mi |
| 6450 S Nash Way Chandler, AZ | 2.0 | 2.0 | 1240 | $2,300 | $1.85 | 17d | 1 | 1.13mi |
HOA detail
- Monthly dues
- $208 · $2,496/yr
- Likely covers
- poolgymsecurity
Listing history 9 events
-
2026-06-21days on market $335,000 Active 10 DOM
-
2026-06-18days on market $335,000 Active 7 DOM
-
2026-06-17days on market $335,000 Active 6 DOM
-
2026-06-16days on market $335,000 Active 5 DOM
-
2026-06-15days on market $335,000 Active 4 DOM
-
2026-06-13days on market $335,000 Active 2 DOM
-
2026-06-13status $335,000 Active 1 DOM
-
2026-06-09remarks 699-char remark
-
2026-06-09$335,000 Coming Soon 1 DOM
ⓘ Source: listings_history table (triggers on properties + properties_extension) + one-shot
backfill from property_details.listing_events for pre-trigger history.
Tax reassessment forecast AZ · Resets to sale price
- Current annual tax
- $1,284 · $107/mo
- Projected year-2 tax
- $2,211 · $184/mo
- Expected delta
- +$928/yr (+$77/mo · 72.3%)
ⓘ Screening estimate from a state-policy table — verify with the county assessor before closing.
Climate risk First Street
- Flood 3/10 Moderate FEMA zone X (shaded) · 12% chance over 30 yrs
- Wildfire 5/10 Major
- Heat 9/10 Extreme 6 d/yr ≥112°F today · 15 d/yr by 30 yrs out
- Wind 1/10 Low
- Air quality 1/10 Low 0 unhealthy d/yr today · 0 by 30 yrs out
Nearby sold comps map
Loading sold comps map…
Walkable amenities ~0.75 mi
Loading nearby amenities…
Taxation est. · year 1
- Rental income
- $32,536
- − Mortgage interest
- −$18,765
- − Property taxes
- −$1,284
- − Insurance
- −$1,675
- − Repairs & maintenance
- −$2,603
- − Management
- −$2,603
- − HOA
- −$2,496
- − Depreciation
- −$9,745
- Taxable loss
- −$6,635
- Est. tax savings @ 24.0%
- +$1,592
- After-tax cash flow
- $760/yr
For passive investors: Depreciation is non-cash, so a rental often shows a tax loss while cash-flowing — sheltering income. Rental losses are passive: they offset passive income freely, and up to $25,000/yr can offset ordinary (W-2) income if you actively participate and your MAGI is under $100k (phasing out to $0 by $150k); unused losses carry forward. On sale, claimed depreciation is recaptured at up to 25%, and gains may owe capital-gains tax (a 1031 exchange can defer both). Figures are a year-1 estimate at your 24.0% rate — not tax advice; consult a CPA.
Schools (NCES district)
- District
- Chandler Unified District #80 (4242)
- NCES district ID
- 0401870
- Math proficiency
- 49% ▼ -8.00%
- Reading proficiency
- 57% ▼ -2.00%
- Median HH income
- $74,048
- Composite
- 47.54/100
- National rank
- #2268
- State rank
- #31 of 249 in AZ
Livability — Chandler
- Score
- 78/100
- State rank
- #9
- US rank
- #2508
Category grades
Schools grade is shown separately in the Schools card above.
Census & demographics
- Census place
- Chandler, AZ
- County
- Maricopa County · 4,537,380 people
- City population
- 299,016
- Metro
- Phoenix-Mesa-Chandler, AZ
- Population (ZIP)
- 48,746
- Household income
- $153,633
- Rent vs Own
- Severe rent burden
- 304.0
Population outlook (Maricopa County) Hauer SSP2
- Today (2025)
- 4,979,203 people
- By 2030
- 5,378,229 · +8.0%
- By 2040
- 6,156,598 · +23.6%
- By 2050
- 6,872,376 · +38.0%
- By 2075
- 8,401,270 · +68.7%
- By 2100
- 9,247,439 · +85.7%
Race, ethnicity, and origin ACS 2023
- Neighborhood character
- Predominantly White (66%)
- Race & ethnicity
- White 66% Hispanic / Latino 12% Asian 12% Two or more races 11% Black 3% Native American 1%
- Hispanic origin (detail)
- Mexican 8%
- Common ancestry
- Romanian 3% Slovak 2% Lithuanian 2%
- Foreign-born
- 13% · China, Canada, Vietnam
- Languages at home
- 84% English-only · Spanish 4% Chinese 3% Other Indo-European 3%
Political lean MEDSL · Maricopa
- 2024 margin
- Toss-up / Even · D 47.7% · R 51.2% · Other 1.1%
- 2008→2024 swing
- +7.1pp toward D · 2008: -10.6pp · 2024: -3.5pp
- All cycles
- 2024: R+3.5 2020: D+2.2 2016: R+3.5 2012: R+12.0 2008: R+10.6
Not yet ingested
- Civics
- —
Market trends
- HPI YoY
- ▼ -47.22%
- Current HPI
- 299.4196
- Rent YoY
- ▲ 3.05%
- Metro
- Phoenix-Mesa-Chandler, AZ
- State GDP YoY
- ▲ 4.54%
- F500 in state
- 20
Industry mix (Fortune 500 HQ in AZ)
| Industry | F500 HQs | Revenue |
|---|---|---|
| Technology | 2 | $13B |
|
||
| Mining / Metals | 1 | $23B |
|
||
| Environmental Services | 1 | $16B |
|
||
| Metals / Steel | 1 | $14B |
|
||
| Technology Distribution | 1 | $9B |
|
||
| Homebuilding | 1 | $8B |
|
||
Price history
+160.1% since first listed19 events — show timeline
- 2026-06-09 Coming Soon $335,000 ARMLS
- 2024-02-05 Sold (Public Records) $359,000 Public Records
- 2024-02-05 Sold (MLS) $359,000 ARMLS
- 2023-12-20 Contingent — ARMLS
- 2023-11-17 Price Changed $349,000 ARMLS
- 2023-10-26 Price Changed $369,000 ARMLS
- 2023-10-02 Listed $385,000 ARMLS
- 2021-11-30 Sold (Public Records) $340,000 Public Records
- 2021-11-30 Sold (MLS) $340,000 ARMLS
- 2021-11-27 Pending — ARMLS
- 2021-11-27 Listed $339,000 ARMLS
- 2021-11-26 Sold (MLS) $340,000 ARMLS
- 2021-10-29 Pending — ARMLS
- 2021-10-07 Price Changed $339,000 ARMLS
- 2021-09-28 Listed $325,000 ARMLS
- 2021-09-13 Pending — ARMLS
- 2021-09-13 Listing Removed — ARMLS
- 2021-08-25 Listed $325,000 ARMLS
- 2000-09-05 Sold (Public Records) $128,799 Public Records
Property tax history
+1.3%/yrLatest (2025): $1,284 · +1.3% YoY. Source: county tax records.
Cash-flow waterfall
monthlySold comps — $/sqft
last 12 mo · ≤1 miLoading sold comps…