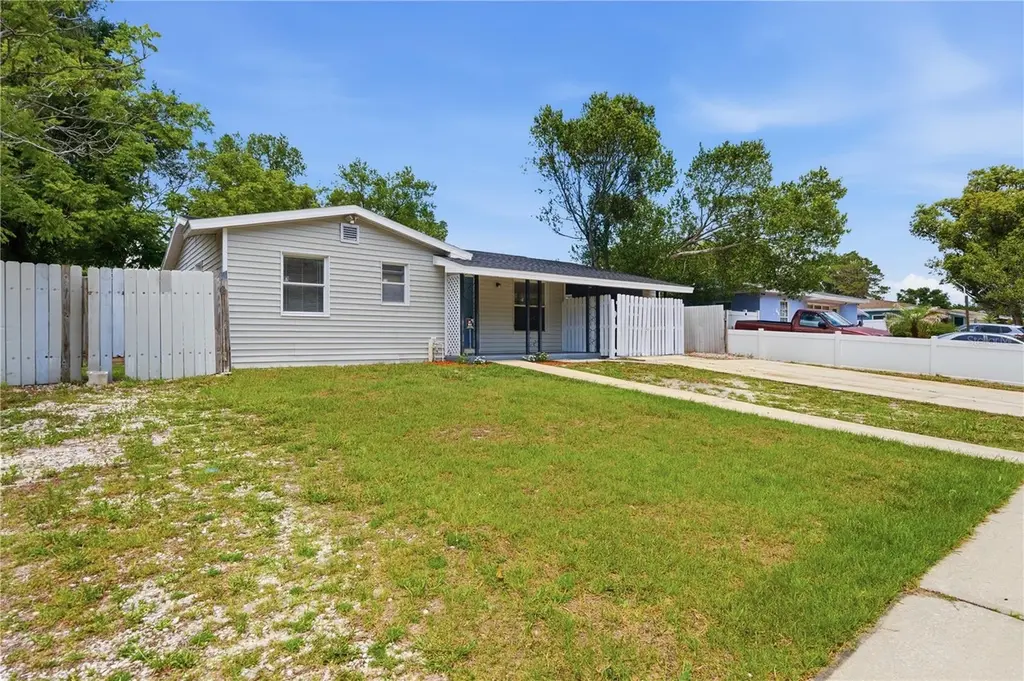
1646 Brady Dr · Deltona, FL
Flood risk 1/10 · Minimal
- FEMA flood zone
- X (unshaded)
- Chance of flooding over 30 yrs
- 0.0%
- Est. flood insurance / yr
- $507 – $1,088
Fire risk 4/10 · Minor
- Est. fire insurance / yr
- $947 – $1,759
Heat risk 9/10 · Severe
- Hot days now (above 107°F)
- 7 days/yr
- Hot days in 30 yrs
- 21 days/yr
Wind risk 9/10 · Severe
- Chance of severe wind over 30 yrs
- 99.0%
Air-quality risk 2/10 · Minimal
- Unhealthy air days now
- 1 days/yr
- Unhealthy air days in 30 yrs
- 1 days/yr
Risk factors via First Street. Map © Google.
Why this score? — see what drove the D- grade
The composite is a weighted blend of 9 inputs, each scored 0–100. Each bar is that input's sub-score; the figure is the points it added to the 100-point composite (weight × sub-score).
- Cash flow +11.7/30.0
- ARV discount +7.5/15.0
- Schools +3.9/10.0
- Livability +3.6/5.0
- DSCR +3.4/10.0
- 1% rule +3.0/10.0
- Rent growth +2.7/5.0
- Condition / age +2.5/5.0
- Appreciation +0.0/10.0
$230,000
🖨 Deal sheet 📄 Offer letter ✓ Due diligence
Listing remarks MLS
Short Sale. Home is a great starter home or investment property. Clean and in good shape, Tile thought out, Inside utility, attached carport and fenced yard. This home has Finish enclosed patio that is now the dining room and 3rd bedroom adding and extra 286 sqft , the total sqft is 1148. Home was rented at $725 per month. currently vacant. This is a coop short sale, price is approved by the bank.
Key facts
- Screened patio
- Separate den
- Fenced homesite
Tags
Property features AI
Finance
- Financial info: Lease restrictions apply
- HOA & community: No HOA association listed; Development: Deltona Lakes
Exterior
- Parking: Has carport (1 space)
- Utilities: Public water; Public sewer; Electricity connected; Sewer connected; Water connected; Underground utilities
- Home design: Single family residence; One story; Faces south
- Construction: Vinyl siding; Shingle roof; Slab foundation; Built on a 0.17-acre lot
- Exterior features: Covered front and rear porches; Screened porch; Rain gutters; Fenced yard (other)
Interior
- Kitchen: Dishwasher; Range
- Bedrooms: 3 bedrooms
- Flooring: Ceramic tile
- Bathrooms: 2 full bathrooms
- Heating & cooling: Central heating (electric); Central air conditioning
- Interior features: Ceiling fans; Eat-in kitchen; Kitchen and family room combo; Den/Library/Office; Inside utility
- Laundry & utility: Laundry room with electric dryer hookup; Electric water heater
Neighborhood map
What this means for you Summary
Snapshot
- This is a 2-bed/1.0-bath single-family listed at $230k.
Deal economics
- At list price, monthly cash flow is $-68 ($-816/yr) — negative.
- To cash-flow at today's rent, offer at most $218k (5.2% below list).
- To meet the 1% rule (rent ≥ 1% of price), the offer needs to be $184k (19.9% below list).
- Recommended offer: $184k (19.9% below list) — sets the bar for 1% rule.
Location & tenants
- Location reads 71/100 on livability (#381 in FL) — a middle-class / working-renter tenant base. Strengths: cost of living A+, housing A+, health & safety A+; Watch: amenities F, commute F.
- Volusia (suburban): math 44% / reading 49% proficiency, ranked #47 of 73 in FL (top 64%) — families likely to look elsewhere, expect single-tenant / working-renter base with shorter leases.
- Zoned schools: Spirit Elementary School (math 41% / reading 48%, grade F, #1,288 of 2,144 statewide, top 62%, 681 students, 64% FRL); Deltona High School (math 27% / reading 46%, grade F, #351 of 667 statewide, top 54%, 1,851 students, 52% FRL).
- Market conditions: Rents flat; 415 active listings in the ZIP; 7 comparable units currently listed for rent nearby; rentals at typical pace (median 15d on market — plan ~3-4 weeks tenant-placement turnaround); 3,402 units permitted in Volusia County in 2024 (681 in 5+ unit buildings).
- This rent runs 30% of the median local income ($73k/yr) — at the standard rent-burdened threshold; future hikes will face affordability resistance.
Forward outlook
- Local home prices are declining (-3.0%/yr); year-one equity from $2k of loan paydown is wiped out by about $7k of value loss. Plan a longer hold.
- Volusia County population projected at +19% by 2050 — long-run rental-demand tailwind backs the buy-and-hold thesis.
Negotiation context
- Only 11 days on market — expect competitive offers; lowballing is unlikely to land.
- 2 sale attempts since 15y ago with the ask held roughly flat each time — persistent listings suggest the price (not the market) is what's stuck; bring a comps-based counter.
- Current owner paid $34k; list at $230k implies a 573% gain — meaningful room to come down on a strong offer.
Risks & watch-outs
- Climate carrying-cost: severe wind risk, 99% chance of damaging wind over 30y; extreme-heat days projected 7→21/yr by 2055 (HVAC capex compounding) — expect insurance premiums to compound above CPI over the hold.
Questions for the listing agent
- What do current leases actually rent for vs. the listed asking? Can we see a recent rent roll and the last 12 months of T-12 income?
- Built in 1967 — when were the roof, HVAC, electrical panel, plumbing, and water heater last replaced?
- Is there a deadline driving the sale (1031 exchange, divorce, estate, relocation)? That informs how much negotiation room exists.
- Schools are D-rated, which usually means shorter tenancies and higher turnover. Who's the typical renter profile here, and what's been the actual vacancy rate?
- The area grade is low — what's the realistic commute time and amenity access for the typical tenant pool here? Any planned neighborhood developments (good or bad) we should know about?
- What's the average days-on-market for RENTAL listings here right now (not sales)? A rising rental-DOM trend means longer vacancies and softer asking-rent achievability than the comps imply.
- What's the recent tenant-quality profile in this submarket — average credit score on applications, eviction rate, late-payment / NSF rate, and stable-employment percentage? A property-management company in the area should have these aggregated.
- How much new for-sale + rental construction is in the pipeline within 1–3 miles? Heavy new supply typically softens prices + rents 12–24 months out; constrained supply supports both.
Investment metrics
- 1% rule
- 0.80% ✗
- Cap rate
- 5.94%
- Cash-on-cash
- -1.27%
- DSCR
- 0.94
- GRM
- 10.4
CMA / ARV
No comps found within radius.
Projected returns pro-forma
-3.0% appreciation · 0.61% rent growth · sell at horizon
- IRR
- -21.0%
- Equity multiple
- 0.29×
- Total profit
- $-45,940
- Equity at exit
- $34,294
- IRR
- -20.7%
- Equity multiple
- 0.03×
- Total profit
- $-62,553
- Equity at exit
- $19,886
Cash invested: $64,400 (down + closing). Projections, not guarantees.
Landlord ↔ Tenant lean methodology
- Overall (STATE)
- 87 Strongly Landlord-Friendly
- State Florida
- 87 Strongly Landlord-Friendly · R+3
- County
- — inherits STATE
- City
- — inherits STATE
ZIP-level market 32725
- Rents YoY
- 0.6%
- Active inventory
- 415
- Price-to-rent
- 10.4×
Monthly cashflow live
- Estimated rent
- $1,842 high interval (Pro) →
- Mortgage (P&I)
- −$1,206
- Tax from tax record
- −$221 /mo · $2,650/yr
- Insurance
- −$96
- HOA
- −$0
- Vacancy / Maint / Mgmt
- −$387
- Net cashflow
- $-68
Break-even live
UW: 25.0% down · 7.5% · 30yr · 1.5% tax · 5.0% vac · 8.0% maint · 8.0% mgmt
Financing live
Cash to close
- Down payment
- $57,500
- Closing costs
- $6,900
- Reserves months
- —
- Total cash needed
- —
Loan-product check · same deal, 3 products live
Conventional
25% down · 7.5% · 30yr
- Down + closing
- —
- Monthly P&I
- —
- Monthly cashflow
- —
- DSCR
- —
- Eligible?
- —
Personal DTI + credit; lowest rate.
DSCR
20% down · 8.5% · 30yr
- Down + closing
- —
- Monthly P&I
- —
- Monthly cashflow
- —
- DSCR
- —
- Eligible?
- —
No personal income docs; deal must DSCR.
Hard money
10% down · 12.0% · 12mo
- Down + closing
- —
- Monthly P&I
- —
- Monthly cashflow
- —
- DSCR
- —
- Eligible?
- —
Short-term bridge; refi at stabilization.
Rent comps 7 comps
| Address | Beds | Baths | Sqft | Rent | $/sqft | DOM | Units | Dist |
|---|---|---|---|---|---|---|---|---|
| 1656 Brentlawn St Deltona, FL | 2.0 | 1.5 | 1004 | $1,900 | $1.89 | 11d | 1 | 0.10mi |
| 1162 Hampshire Ave Deltona, FL | 2.0 | 1.0 | 950 | $1,450 | $1.53 | 14d | 1 | 0.40mi |
| 821 Moongate Ter Deltona, FL | 3.0 | 1.0 | 960 | $1,499 | $1.56 | 14d | 1 | 0.60mi |
| 1383 Providence Blvd Deltona, FL | 3.0 | 2.0 | 1120 | $1,800 | $1.61 | 23d | 1 | 0.79mi |
| 1312 Saxon Blvd Deltona, FL | 3.0 | 1.5 | 966 | $1,800 | $1.86 | 23d | 1 | 0.90mi |
| 1511 Lavilla St Deltona, FL | 2.0 | 2.0 | 1008 | $1,800 | $1.79 | 21d | 1 | 1.14mi |
| 542 Salerno Dr Deltona, FL | 3.0 | 2.0 | 1120 | $1,915 | $1.71 | 11d | 1 | 1.35mi |
Listing history 9 events
-
2026-06-01statusdays on market $230,000 Pending 11 DOM
-
2026-05-31days on market $230,000 Active 10 DOM
-
2026-05-31days on market $230,000 Active 9 DOM
-
2026-05-21$230,000 Active
-
2012-12-27soldstatus $34,200 401-char remark
Show marketing remark (401 chars)
Short Sale. Home is a great starter home or investment property. Clean and in good shape, Tile thought out, Inside utility, attached carport and fenced yard. This home has Finish enclosed patio that is now the dining room and 3rd bedroom adding and extra 286 sqft , the total sqft is 1148. Home was rented at $725 per month. currently vacant. This is a coop short sale, price is approved by the bank.
-
2012-10-12historical 401-char remark
Show marketing remark (401 chars)
Short Sale. Home is a great starter home or investment property. Clean and in good shape, Tile thought out, Inside utility, attached carport and fenced yard. This home has Finish enclosed patio that is now the dining room and 3rd bedroom adding and extra 286 sqft , the total sqft is 1148. Home was rented at $725 per month. currently vacant. This is a coop short sale, price is approved by the bank.
-
2011-02-08$34,200 401-char remark
Show marketing remark (401 chars)
Short Sale. Home is a great starter home or investment property. Clean and in good shape, Tile thought out, Inside utility, attached carport and fenced yard. This home has Finish enclosed patio that is now the dining room and 3rd bedroom adding and extra 286 sqft , the total sqft is 1148. Home was rented at $725 per month. currently vacant. This is a coop short sale, price is approved by the bank.
-
1998-02-23soldstatus $39,000
-
1968-12-01soldstatus $13,500
ⓘ Source: listings_history table (triggers on properties + properties_extension) + one-shot
backfill from property_details.listing_events for pre-trigger history.
Tax reassessment forecast FL · Resets to sale price
- Current annual tax
- $2,650 · $221/mo
- Projected year-2 tax
- $2,650 · $221/mo
- Expected delta
- $0/yr ($0/mo · 0.0%)
ⓘ Screening estimate from a state-policy table — verify with the county assessor before closing.
Climate risk First Street
- Flood 1/10 Low FEMA zone X (unshaded) · 0% chance over 30 yrs
- Wildfire 4/10 Moderate
- Heat 9/10 Extreme 7 d/yr ≥107°F today · 21 d/yr by 30 yrs out
- Wind 9/10 Extreme 99% chance of damaging wind over 30 yrs
- Air quality 2/10 Low 1 unhealthy d/yr today · 1 by 30 yrs out
Nearby sold comps map
Loading sold comps map…
Walkable amenities ~0.75 mi
Loading nearby amenities…
Taxation est. · year 1
- Rental income
- $22,099
- − Mortgage interest
- −$12,884
- − Property taxes
- −$2,650
- − Insurance
- −$1,150
- − Repairs & maintenance
- −$1,768
- − Management
- −$1,768
- − Depreciation
- −$6,691
- Taxable loss
- −$4,812
- Est. tax savings @ 24.0%
- +$1,155
- After-tax cash flow
- $339/yr
For passive investors: Depreciation is non-cash, so a rental often shows a tax loss while cash-flowing — sheltering income. Rental losses are passive: they offset passive income freely, and up to $25,000/yr can offset ordinary (W-2) income if you actively participate and your MAGI is under $100k (phasing out to $0 by $150k); unused losses carry forward. On sale, claimed depreciation is recaptured at up to 25%, and gains may owe capital-gains tax (a 1031 exchange can defer both). Figures are a year-1 estimate at your 24.0% rate — not tax advice; consult a CPA.
Schools (NCES district)
- District
- Volusia
- NCES district ID
- 1201920
- Math proficiency
- 44% ▼ -9.00%
- Reading proficiency
- 49% ▼ -3.00%
- Median HH income
- $42,946
- Composite
- 39.2/100
- National rank
- #4019
- State rank
- #47 of 73 in FL
Livability — Deltona
- Score
- 71/100
- State rank
- #381
- US rank
- #6749
Category grades
Schools grade is shown separately in the Schools card above.
Census & demographics
- Census place
- Deltona, FL
- County
- Volusia County · 556,871 people
- City population
- 101,355
- Metro
- Deltona-Daytona Beach-Ormond Beach, FL
- Population (ZIP)
- 51,987
- Household income
- $73,152
- Rent vs Own
- Severe rent burden
- 1051.0
Population outlook (Volusia County) Hauer SSP2
- Today (2025)
- 572,749 people
- By 2030
- 598,695 · +4.5%
- By 2040
- 644,880 · +12.6%
- By 2050
- 681,451 · +19.0%
- By 2075
- 759,957 · +32.7%
- By 2100
- 778,902 · +36.0%
Race, ethnicity, and origin ACS 2023
- Neighborhood character
- Diverse neighborhood (Simpson 0.63)
- Race & ethnicity
- White 45% Hispanic / Latino 39% Two or more races 12% Black 10% Asian 3%
- Hispanic origin (detail)
- Mexican 3% Puerto Rican 23% Cuban 4% Dominican 3%
- Common ancestry
- Romanian 1% Lithuanian 1% Serbian 1%
- Foreign-born
- 13% · Canada, Jamaica, Vietnam
- Languages at home
- 66% English-only · Spanish 30% Vietnamese 1% Other Indo-European 1%
Political lean MEDSL · Volusia
- 2024 margin
- Strong R (+21.8) · D 38.7% · R 60.5%
- 2008→2024 swing
- -27.4pp toward R · 2008: 5.7pp · 2024: -21.8pp
- All cycles
- 2024: R+21.8 2020: R+14.1 2016: R+13.1 2012: R+1.2 2008: D+5.7
Not yet ingested
- Civics
- —
Market trends
- HPI YoY
- ▼ -195.58%
- Current HPI
- 349.7999
- Rent YoY
- ▲ 0.61%
- Metro
- Deltona-Daytona Beach-Ormond Beach, FL
- State GDP YoY
- ▲ 3.28%
- F500 in state
- 36
Industry mix (Fortune 500 HQ in FL)
| Industry | F500 HQs | Revenue |
|---|---|---|
| Industrial Technology | 2 | $29B |
|
||
| Insurance | 2 | $17B |
|
||
| Retail | 1 | $60B |
|
||
| Technology Distribution | 1 | $58B |
|
||
| Homebuilding | 1 | $35B |
|
||
| Technology Manufacturing | 1 | $35B |
|
||
Price history
+1603.7% since first listed6 events — show timeline
- 2026-05-21 Listed $230,000 Stellar MLS as Distributed by MLS Grid
- 2012-12-27 Sold (MLS) $34,200 Stellar MLS as Distributed by MLS Grid
- 2012-10-12 Listing Removed — Stellar MLS as Distributed by MLS Grid
- 2011-02-08 Listed $34,200 Stellar MLS as Distributed by MLS Grid
- 1998-02-23 Sold (Public Records) $39,000 Public Records
- 1968-12-01 Sold (Public Records) $13,500 Public Records
Property tax history
+7.8%/yrLatest (2025): $2,650 · +5.0% YoY. Source: county tax records.
Cash-flow waterfall
monthlySold comps — $/sqft
last 12 mo · ≤1 miLoading sold comps…