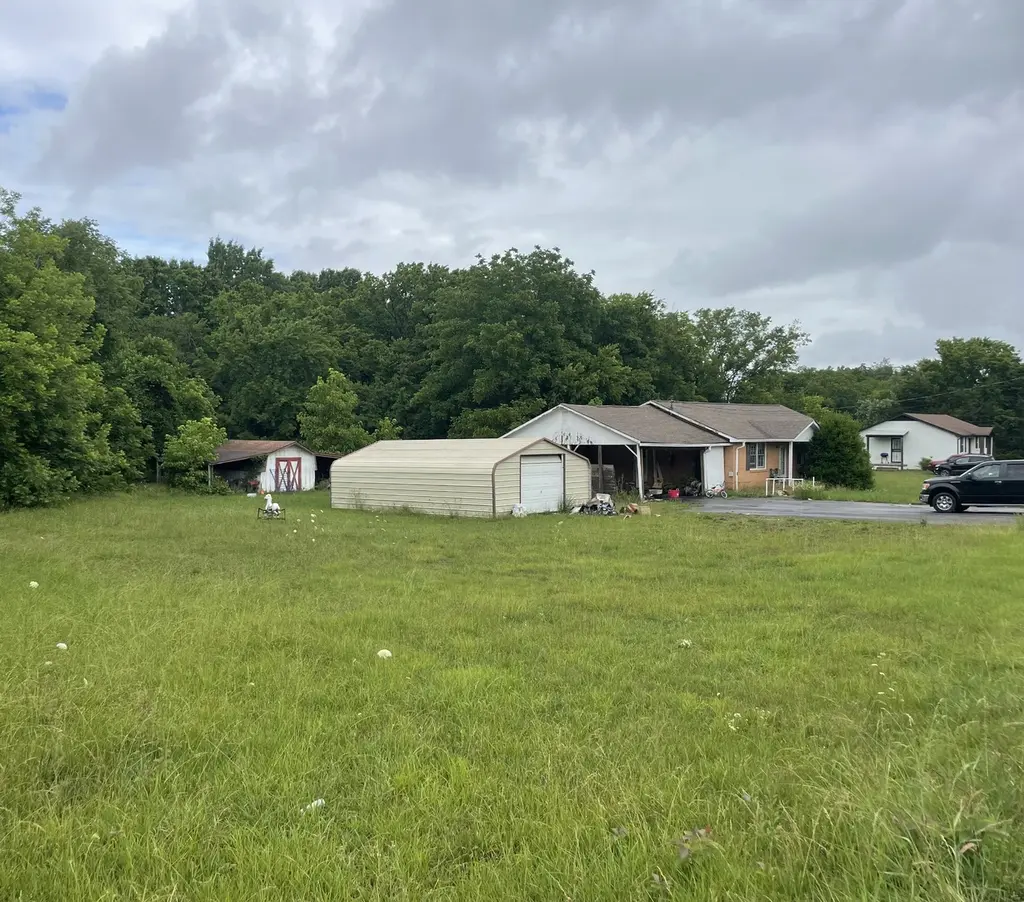
117 Center St · La Vergne, TN
Flood risk 1/10 · Minimal
- FEMA flood zone
- X (unshaded)
- Chance of flooding over 30 yrs
- 0.0%
- Est. flood insurance / yr
- $507 – $1,088
Fire risk 1/10 · Minimal
- Est. fire insurance / yr
- $949 – $1,763
Heat risk 5/10 · Moderate
- Hot days now (above 106°F)
- 7 days/yr
- Hot days in 30 yrs
- 18 days/yr
Wind risk 4/10 · Minor
- Chance of severe wind over 30 yrs
- 10.0%
Air-quality risk 2/10 · Minimal
- Unhealthy air days now
- 1 days/yr
- Unhealthy air days in 30 yrs
- 1 days/yr
Risk factors via First Street. Map © Google.
Why this score? — see what drove the C grade
The composite is a weighted blend of 9 inputs, each scored 0–100. Each bar is that input's sub-score; the figure is the points it added to the 100-point composite (weight × sub-score).
- Cash flow +20.8/30.0
- ARV discount +15.0/15.0
- DSCR +6.6/10.0
- 1% rule +4.5/10.0
- Schools +3.2/10.0
- Livability +3.2/5.0
- Condition / age +2.5/5.0
- Rent growth +2.2/5.0
- Appreciation +0.0/10.0
$209,000
🖨 Deal sheet 📄 Offer letter ✓ Due diligence
Listing remarks
* * * Multiple Offers. All offers due by Wednesday 9 PM, June 17, 2026. * * * This single-family home is in the heart of La Vergne! Situated on approximately 0.85 acres (37,026 +/- sq ft), this large residential lot is in an established neighborhood with convenient access to I-24, Nashville, Smyrna, Murfreesboro, shopping, dining, schools, and everyday amenities. The existing residence is being sold AS-IS. The property features approximately 134 feet of road frontage, public utilities, and R-1 Single Family Residential zoning. The lot is generally level to gently rolling and provides ample space for outdoor living areas, a workshop, a detached garage, or additional improvements, subj
Key facts
- Public utilities
- 0.85 acre lot
- 2 parking spots
Tags
Property features AI
Exterior
- Parking: Attached parking; Covered carport with 2 spaces (total parking for 2)
- Utilities: Public water; Septic tank sewer
- Home design: Single-family residence; One-story
- Construction: Brick construction; Existing structure
- Exterior features: Lot approximately 0.85 acres; Lot dimensions about 135 x 276.8 (irregular)
Interior
- Kitchen: Built-in electric oven
- Bedrooms: 3 bedrooms (all on the main level)
- Flooring: Vinyl flooring
- Bathrooms: 2 full bathrooms
- Heating & cooling: Central heating; Central air conditioning
- Interior features: Built-in electric oven
- Laundry & utility: Water available
Neighborhood map
What this means for you Summary
Snapshot
- This is a 3-bed/2.0-bath single-family listed at $209k.
Deal economics
- At list price, monthly cash flow is $285 ($3k/yr) — positive.
- The deal already cash-flows at list — no discount required.
- To meet the 1% rule (rent ≥ 1% of price), the offer needs to be $199k (5.0% below list).
- Recommended offer: $199k (5.0% below list) — sets the bar for 1% rule.
- Cap rate 7.9% vs local median 3.7% in La Vergne — top-decile yield for the area; either an underpriced asset or a hidden risk that comps aren't pricing in. Stress-test before assuming the spread holds.
Location & tenants
- Location reads 64/100 on livability (#171 in TN) — a middle-class / working-renter tenant base. Strengths: cost of living A+, housing A+, employment B; Watch: crime D-, amenities F, commute F.
- Rutherford County (suburban): math 34% / reading 37% proficiency, ranked #22 of 139 in TN (top 16%) — families likely to look elsewhere, expect single-tenant / working-renter base with shorter leases.
- Zoned schools: Cedar Grove Elementary (math 36% / reading 27%, grade F, #398 of 952 statewide, top 42%, 813 students, 0% FRL); Lavergne High School (math 8% / reading 30%, grade F, #202 of 332 statewide, top 62%, 2,100 students, 0% FRL) — zoned schools average 0% FRL vs 36% district-wide (36 pts lower); this property's tenant base skews higher-income than the district average.
- Market conditions: Rents soft (-1.0%/yr); 261 active listings in the ZIP; 24 comparable units currently listed for rent nearby; rentals leasing fast (median 4d on market — plan ~1-2 weeks tenant-placement turnaround); solid renter incomes; 3,421 units permitted in Rutherford County in 2024 (400 in 5+ unit buildings).
- This rent runs 30% of the median local income ($79k/yr) — at the standard rent-burdened threshold; future hikes will face affordability resistance.
Forward outlook
- Local home prices are declining (-3.0%/yr); year-one equity from $1k of loan paydown is wiped out by about $6k of value loss. Plan a longer hold.
- Rutherford County population projected at +60% by 2050 — long-run rental-demand tailwind backs the buy-and-hold thesis.
Negotiation context
- Only 2 days on market — expect competitive offers; lowballing is unlikely to land.
Risks & watch-outs
- Climate carrying-cost: extreme-heat days projected 7→18/yr by 2055 (HVAC capex compounding) — expect insurance premiums to compound above CPI over the hold.
Questions for the listing agent
- Is there a deadline driving the sale (1031 exchange, divorce, estate, relocation)? That informs how much negotiation room exists.
- Schools are D-rated, which usually means shorter tenancies and higher turnover. Who's the typical renter profile here, and what's been the actual vacancy rate?
- Crime grade is D in this area — have there been break-ins, vandalism, or insurance claims at this property in the last 3 years? What carrier currently insures it and at what premium?
- What's the average days-on-market for RENTAL listings here right now (not sales)? A rising rental-DOM trend means longer vacancies and softer asking-rent achievability than the comps imply.
- What's the recent tenant-quality profile in this submarket — average credit score on applications, eviction rate, late-payment / NSF rate, and stable-employment percentage? A property-management company in the area should have these aggregated.
- How much new for-sale + rental construction is in the pipeline within 1–3 miles? Heavy new supply typically softens prices + rents 12–24 months out; constrained supply supports both.
Investment metrics
- 1% rule
- 0.95% ✗
- Cap rate
- 7.93%
- Cash-on-cash
- 5.85%
- DSCR
- 1.26
- GRM
- 8.8
CMA / ARV
- ARV (on-the-fly)
- $336,875
- Comps found
- 12
Show comp detail 12 sales within ~0.75 mi
| Address | Dist | Beds/Ba | Sqft | Sold | Price | $/sf | Match |
|---|---|---|---|---|---|---|---|
| 125 Campbell Pl | 0.18mi | 3/1.5 | 1,296 (+6%) | 3mo | $337,500 | $260 | 77 |
| 1211 Akins Ridge Dr | 0.24mi | 3/2.0 | 1,144 (-7%) | 1mo | $330,000 | $288 | 76 |
| 806 Albin Ct | 0.52mi | 3/2.0 | 1,247 (+2%) | 2mo | $2,000 | $2 | 71 |
| 1703 Erin Trce | 0.58mi | 3/2.0 | 1,252 (+2%) | 1mo | $344,900 | $275 | 69 |
| 305 Kimberly Ann Ct | 0.32mi | 3/2.0 | 1,128 (-8%) | 4mo | $294,000 | $261 | 68 |
| 1913 Guildford Dr | 0.19mi | 3/2.0 | 1,096 (-10%) | 10mo | $325,000 | $297 | 65 |
| 1312 Lantern Light Cv | 0.34mi | 3/2.0 | 1,062 (-13%) | 2mo | $335,000 | $315 | 60 |
| 1904 Moon Ct | 0.29mi | 3/2.5 | 1,381 (+13%) | 10mo | $325,000 | $235 | 55 |
| 1534 Ridgemont Dr | 0.62mi | 3/2.0 | 1,092 (-11%) | 1mo | $300,000 | $275 | 52 |
| 1619 Bill Eller Dr | 0.46mi | 4/2.0 (+1) | 1,092 (-11%) | 6mo | $275,000 | $252 | 50 |
| 1507 Ridgemont Dr | 0.59mi | 3/2.0 | 1,109 (-10%) | 8mo | $310,000 | $280 | 50 |
| 112 Johns St | 0.63mi | 3/1.0 | 1,075 (-12%) | 3mo | $275,000 | $256 | 44 |
Match score weights: distance 35% · size 25% · config 20% · recency 20%. Top-matched comps best support the ARV.
Projected returns pro-forma
-3.0% appreciation · 0.0% rent growth · sell at horizon
- IRR
- -10.4%
- Equity multiple
- 0.63×
- Total profit
- $-21,578
- Equity at exit
- $31,163
- IRR
- -5.4%
- Equity multiple
- 0.69×
- Total profit
- $-18,150
- Equity at exit
- $18,071
Cash invested: $58,520 (down + closing). Projections, not guarantees.
Landlord ↔ Tenant lean methodology
- Overall (STATE)
- 87 Strongly Landlord-Friendly
- State Tennessee
- 87 Strongly Landlord-Friendly · R+13
- County
- — inherits STATE
- City
- — inherits STATE
ZIP-level market 37086
- Home prices YoY
- -21.3%
- Rents YoY
- -1.0%
- Active inventory
- 261
- Price-to-rent
- 8.8×
Monthly cashflow live
- Estimated rent
- $1,985 high interval (Pro) →
- Mortgage (P&I)
- −$1,096
- Tax from tax record
- −$100 /mo · $1,197/yr
- Insurance
- −$87
- HOA
- −$0
- Vacancy / Maint / Mgmt
- −$417
- Net cashflow
- $285
Break-even live
UW: 25.0% down · 7.5% · 30yr · 1.5% tax · 5.0% vac · 8.0% maint · 8.0% mgmt
Financing live
Cash to close
- Down payment
- $52,250
- Closing costs
- $6,270
- Reserves months
- —
- Total cash needed
- —
Loan-product check · same deal, 3 products live
Conventional
25% down · 7.5% · 30yr
- Down + closing
- —
- Monthly P&I
- —
- Monthly cashflow
- —
- DSCR
- —
- Eligible?
- —
Personal DTI + credit; lowest rate.
DSCR
20% down · 8.5% · 30yr
- Down + closing
- —
- Monthly P&I
- —
- Monthly cashflow
- —
- DSCR
- —
- Eligible?
- —
No personal income docs; deal must DSCR.
Hard money
10% down · 12.0% · 12mo
- Down + closing
- —
- Monthly P&I
- —
- Monthly cashflow
- —
- DSCR
- —
- Eligible?
- —
Short-term bridge; refi at stabilization.
Rent comps 24 comps
| Address | Beds | Baths | Sqft | Rent | $/sqft | DOM | Units | Dist |
|---|---|---|---|---|---|---|---|---|
| 1206 Akins Ridge Dr La Vergne, TN | 3.0 | 2.0 | 1145 | $1,850 | $1.62 | 23d | 1 | 0.17mi |
| 1912 Guildford Dr La Vergne, TN | 3.0 | 2.0 | 1208 | $1,910 | $1.58 | 3d | 1 | 0.20mi |
| 4054 Margo Cir La Vergne, TN | 3.0 | 2.0 | 1498 | $1,800 | $1.20 | 3d | 1 | 0.21mi |
| 1225 Akins Ridge Dr La Vergne, TN | 3.0 | 2.0 | 1144 | $1,815 | $1.59 | 3d | 1 | 0.28mi |
| 1711 Luton Dr La Vergne, TN | 3.0 | 2.5 | 1459 | $2,010 | $1.38 | 7d | 1 | 0.35mi |
| 1435 Tuffnell Dr La Vergne, TN | 3.0 | 2.0 | 1112 | $1,910 | $1.72 | 3d | 1 | 0.59mi |
| 200 Carriage House Dr Smyrna, TN | 1.0–3.0 | 1.0–2.0 | 1008 | $2,447 | $2.43 | 3d | 42 | 0.90mi |
| 3005 George Buchanan Dr La Vergne, TN | 2.0 | 2.5 | 1255 | $1,650 | $1.31 | 16d | 1 | 0.95mi |
| 2029 George Buchanan Dr La Vergne, TN | 3.0 | 2.5 | 1318 | $1,770 | $1.34 | 43d | 1 | 1.00mi |
| 2025 George Buchanan Dr La Vergne, TN | 3.0 | 2.5 | 1318 | $1,720 | $1.31 | 12d | 1 | 1.00mi |
| 3008 Rg Buchanan Dr La Vergne, TN | 3.0 | 2.5 | 1332 | $1,795 | $1.35 | 3d | 1 | 1.04mi |
| 4031 George Buchanan Dr La Vergne, TN | 2.0 | 2.5 | 1255 | $1,800 | $1.43 | 1d | 1 | 1.05mi |
| 14531 Old Nashville Hwy Smyrna, TN | 1.0–3.0 | 1.0–2.0 | 1090 | $1,863 | $1.71 | 3d | 12 | 1.14mi |
| 4101 George Buchanan Dr La Vergne, TN | 2.0 | 2.5 | 1280 | $1,735 | $1.36 | 43d | 1 | 1.15mi |
| 713 Almondwood Pl La Vergne, TN | 3.0 | 2.0 | 1429 | $2,240 | $1.57 | 3d | 1 | 1.21mi |
| 1014 Stonemark Trl La Vergne, TN | 2.0 | 2.0 | 1073 | $1,725 | $1.61 | 23d | 1 | 1.26mi |
| 916 Patty Cv La Vergne, TN | 2.0 | 2.5 | 1240 | $1,705 | $1.38 | 1d | 1 | 1.30mi |
| 122 Wolverine Ct Smyrna, TN | 2.0 | 2.5 | 1380 | $1,800 | $1.30 | 23d | 1 | 1.43mi |
| 1010 Arlene Dr La Vergne, TN | 2.0 | 2.5 | 1256 | $1,499 | $1.19 | 20d | 1 | 1.44mi |
| 1001 Mason Tucker Dr Smyrna, TN | 1.0–2.0 | 1.0–2.0 | 837 | $1,499 | $1.79 | 2d | 6 | 1.44mi |
| 8008 Logan Dr La Vergne, TN | 2.0 | 2.5 | 1144 | $1,495 | $1.31 | 3d | 1 | 1.45mi |
| 8021 Logan Dr La Vergne, TN | 3.0 | 2.5 | 1287 | $1,605 | $1.25 | 1d | 1 | 1.49mi |
| 8030 Logan Dr La Vergne, TN | 3.0 | 2.5 | 1287 | $1,655 | $1.29 | 3d | 1 | 1.49mi |
| 8034 Logan Dr La Vergne, TN | 2.0 | 2.5 | 1139 | $1,650 | $1.45 | 3d | 1 | 1.49mi |
Listing history 4 events
-
2026-06-19status $209,000 Pending 2 DOM
-
2026-06-18days on market $209,000 Active 2 DOM
-
2026-06-17remarks 699-char remark
-
2026-06-17$209,000 Active 1 DOM
ⓘ Source: listings_history table (triggers on properties + properties_extension) + one-shot
backfill from property_details.listing_events for pre-trigger history.
Tax reassessment forecast TN · Resets to sale price
- Current annual tax
- $1,197 · $100/mo
- Projected year-2 tax
- $1,484 · $124/mo
- Expected delta
- +$287/yr (+$24/mo · 24.0%)
ⓘ Screening estimate from a state-policy table — verify with the county assessor before closing.
Climate risk First Street
- Flood 1/10 Low FEMA zone X (unshaded) · 0% chance over 30 yrs
- Wildfire 1/10 Low
- Heat 5/10 Major 7 d/yr ≥106°F today · 18 d/yr by 30 yrs out
- Wind 4/10 Moderate 10% chance of damaging wind over 30 yrs
- Air quality 2/10 Low 1 unhealthy d/yr today · 1 by 30 yrs out
Nearby sold comps map
Loading sold comps map…
Walkable amenities ~0.75 mi
Loading nearby amenities…
Taxation est. · year 1
- Rental income
- $23,821
- − Mortgage interest
- −$11,707
- − Property taxes
- −$1,197
- − Insurance
- −$1,045
- − Repairs & maintenance
- −$1,906
- − Management
- −$1,906
- − Depreciation
- −$6,080
- Taxable loss
- −$20
- Est. tax savings @ 24.0%
- +$5
- After-tax cash flow
- $3,429/yr
For passive investors: Depreciation is non-cash, so a rental often shows a tax loss while cash-flowing — sheltering income. Rental losses are passive: they offset passive income freely, and up to $25,000/yr can offset ordinary (W-2) income if you actively participate and your MAGI is under $100k (phasing out to $0 by $150k); unused losses carry forward. On sale, claimed depreciation is recaptured at up to 25%, and gains may owe capital-gains tax (a 1031 exchange can defer both). Figures are a year-1 estimate at your 24.0% rate — not tax advice; consult a CPA.
Schools (NCES district)
- District
- Rutherford County
- NCES district ID
- 4703690
- Math proficiency
- 34% ▼ -11.00%
- Reading proficiency
- 37% ▼ -4.00%
- Median HH income
- $59,872
- Composite
- 31.7/100
- National rank
- #5917
- State rank
- #22 of 139 in TN
Livability — La Vergne
- Score
- 64/100
- State rank
- #171
- US rank
- #14524
Category grades
Schools grade is shown separately in the Schools card above.
Census & demographics
- Census place
- La Vergne, TN
- County
- Rutherford County · 327,859 people
- City population
- 38,872
- Metro
- Nashville-Davidson--Murfreesboro--Franklin, TN
- Population (ZIP)
- 38,872
- Household income
- $78,857
- Rent vs Own
- Severe rent burden
- 739.0
Population outlook (Rutherford County) Hauer SSP2
- Today (2025)
- 385,165 people
- By 2030
- 430,283 · +11.7%
- By 2040
- 523,241 · +35.8%
- By 2050
- 616,830 · +60.1%
- By 2075
- 848,777 · +120.4%
- By 2100
- 1,028,900 · +167.1%
Race, ethnicity, and origin ACS 2023
- Neighborhood character
- Diverse neighborhood (Simpson 0.68)
- Race & ethnicity
- White 43% Black 28% Hispanic / Latino 24% Two or more races 13% Asian 2%
- Hispanic origin (detail)
- Mexican 12% Puerto Rican 2%
- Common ancestry
- Italian 1% Iranian 1% Lithuanian 1%
- Foreign-born
- 18% · Canada
- Languages at home
- 72% English-only · Spanish 21% Arabic 3% Other Asian/Pacific 1%
Political lean MEDSL · Rutherford
- 2024 margin
- Strong R (+21.8) · D 38.4% · R 60.1% · Other 1.5%
- 2008→2024 swing
- -2.7pp toward R · 2008: -19.1pp · 2024: -21.8pp
- All cycles
- 2024: R+21.8 2020: R+15.4 2016: R+26.1 2012: R+24.7 2008: R+19.1
Not yet ingested
- Civics
- —
Market trends
- HPI YoY
- ▼ -76.52%
- Current HPI
- 282.9844
- Rent YoY
- ▼ -1.04%
- Metro
- Nashville-Davidson--Murfreesboro--Franklin, TN
- State GDP YoY
- ▲ 2.78%
- F500 in state
- 22
Industry mix (Fortune 500 HQ in TN)
| Industry | F500 HQs | Revenue |
|---|---|---|
| Healthcare | 3 | $91B |
|
||
| Retail | 3 | $72B |
|
||
| Transportation / Logistics | 1 | $88B |
|
||
| Paper / Packaging | 1 | $19B |
|
||
| Insurance | 1 | $13B |
|
||
| Energy | 1 | $12B |
|
||
Price history
1 event — show timeline
- 2026-06-16 Listed $209,000 REALTRACS as Distributed by MLS Grid
Property tax history
+1.5%/yrLatest (2025): $1,197 · -2.0% YoY. Source: county tax records.
Cash-flow waterfall
monthlySold comps — $/sqft
last 12 mo · ≤1 miLoading sold comps…