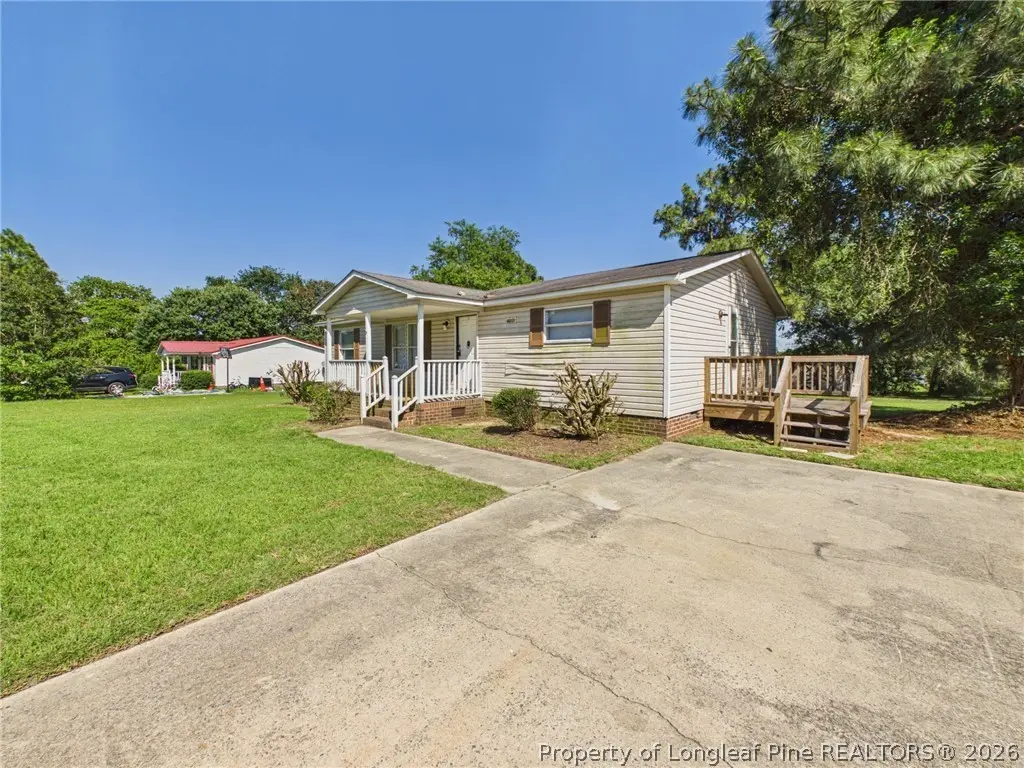
96 NE Heritage Way · Spout Springs, NC
Flood risk 1/10 · Minimal
- FEMA flood zone
- X (unshaded)
- Chance of flooding over 30 yrs
- 0.0%
- Est. flood insurance / yr
- $507 – $1,088
Fire risk 6/10 · Moderate
- Est. fire insurance / yr
- $906 – $1,684
Heat risk 7/10 · Major
- Hot days now (above 106°F)
- 7 days/yr
- Hot days in 30 yrs
- 16 days/yr
Wind risk 6/10 · Moderate
- Chance of severe wind over 30 yrs
- 69.0%
Air-quality risk 1/10 · Minimal
- Unhealthy air days now
- 0 days/yr
- Unhealthy air days in 30 yrs
- 0 days/yr
Risk factors via First Street. Map © Google.
Why this score? — see what drove the B grade
The composite is a weighted blend of 9 inputs, each scored 0–100. Each bar is that input's sub-score; the figure is the points it added to the 100-point composite (weight × sub-score).
- Cash flow +28.6/30.0
- ARV discount +15.0/15.0
- DSCR +10.0/10.0
- 1% rule +6.7/10.0
- Rent growth +3.2/5.0
- Schools +3.0/10.0
- Livability +2.5/5.0
- Condition / age +2.5/5.0
- Appreciation +0.0/10.0
$138,000
🖨 Deal sheet 📄 Offer letter ✓ Due diligence
Listing remarks MLS
Nice, move in ready 3 bed/ 2 bath modular home. No bank qualifying needed as the seller provides owner financing to individuals with a good down payment.
Key facts
- Huge yard
- Storage shed
- 0.45 acre lot
Tags
Property features AI
Exterior
- Parking: No garage
- Utilities: Public water; Sewer: holding tank and septic tank
- Home design: One level; Manufactured home; Residential property
- Construction: Aluminum siding
- Exterior features: Lot in Heritage Vil subdivision
Interior
- Kitchen: Dishwasher; Cooktop; Range
- Bedrooms: Total rooms: 5
- Flooring: Vinyl; Carpet
- Bathrooms: 2 full bathrooms
- Heating & cooling: Heat pump (heating present)
- Interior features: Eat-in kitchen; Storage; Walk-in closet(s); Window coverings and blinds
- Laundry & utility: Washer hookup in unit; Washer included
Neighborhood map
What this means for you Summary
Snapshot
- This is a 3-bed/2.0-bath manufactured listed at $138k.
Deal economics
- At list price, monthly cash flow is $456 ($5k/yr) — positive.
- The deal already cash-flows at list — no discount required.
- Meets the 1% rule at list price ($2k rent vs $138k).
- Cap rate 10.3% vs local median 4.1% in Spout Springs — top-decile yield for the area; either an underpriced asset or a hidden risk that comps aren't pricing in. Stress-test before assuming the spread holds.
Location & tenants
- Location reads: area grade B — affects rentability + tenant quality, not the cash-flow math above.
- Harnett County Schools (rural): math 31% / reading 39% proficiency, ranked #130 of 178 in NC (top 73%) — families likely to look elsewhere, expect single-tenant / working-renter base with shorter leases.
- Zoned schools: Overhills Middle (math 29% / reading 40%, grade F, #292 of 475 statewide, top 62%, 799 students, 61% FRL); Overhills High (math 52% / reading 63%, grade C, #245 of 535 statewide, top 46%, 1,971 students, 47% FRL) — zoned schools at 54% FRL track the district average.
- Market conditions: Rents rising (+3.0%/yr); 244 active listings in the ZIP; 6 comparable units currently listed for rent nearby; rentals at typical pace (median 23d on market — plan ~3-4 weeks tenant-placement turnaround); solid renter incomes; 2,080 units permitted in Harnett County in 2024 (12 in 5+ unit buildings).
Forward outlook
- Local home prices are declining (-3.0%/yr); year-one equity from $954 of loan paydown is wiped out by about $4k of value loss. Plan a longer hold.
- Harnett County population projected at +42% by 2050 — long-run rental-demand tailwind backs the buy-and-hold thesis.
- At projected returns (-3.0% appreciation + 3.0% rent growth), your $39k cash investment doubles in ~9 years — after that, you're playing with house money.
Negotiation context
- Only 4 days on market — expect competitive offers; lowballing is unlikely to land.
- 10 sale attempts since 11y ago with the ask held roughly flat each time — persistent listings suggest the price (not the market) is what's stuck; bring a comps-based counter.
- Current owner paid $38k; list at $138k implies a 263% gain — meaningful room to come down on a strong offer.
Risks & watch-outs
- Climate carrying-cost: major wind risk, 69% chance of damaging wind over 30y; major wildfire risk; extreme-heat days projected 7→16/yr by 2055 (HVAC capex compounding) — expect insurance premiums to compound above CPI over the hold.
Questions for the listing agent
- Is there a deadline driving the sale (1031 exchange, divorce, estate, relocation)? That informs how much negotiation room exists.
- What's the average days-on-market for RENTAL listings here right now (not sales)? A rising rental-DOM trend means longer vacancies and softer asking-rent achievability than the comps imply.
- What's the recent tenant-quality profile in this submarket — average credit score on applications, eviction rate, late-payment / NSF rate, and stable-employment percentage? A property-management company in the area should have these aggregated.
- How much new for-sale + rental construction is in the pipeline within 1–3 miles? Heavy new supply typically softens prices + rents 12–24 months out; constrained supply supports both.
Investment metrics
- 1% rule
- 1.17% ✓
- Cap rate
- 10.26%
- Cash-on-cash
- 14.17%
- DSCR
- 1.63
- GRM
- 7.1
CMA / ARV
- ARV (on-the-fly)
- $193,424
- Comps found
- 12
Show comp detail 12 sales within ~0.75 mi
| Address | Dist | Beds/Ba | Sqft | Sold | Price | $/sf | Match |
|---|---|---|---|---|---|---|---|
| 275 Independence Way | 0.08mi | 3/2.0 | 1,232 (0%) | 2mo | $170,000 | $138 | 95 |
| 54 Heritage Way | 0.04mi | 3/2.0 | 1,344 (+9%) | 0mo | $103,750 | $77 | 83 |
| 51 Lexington Ln | 0.23mi | 3/2.0 | 1,238 (+0%) | 8mo | $194,900 | $157 | 81 |
| 16 Lincoln Ln | 0.31mi | 3/2.0 | 1,214 (-2%) | 5mo | $201,000 | $166 | 79 |
| 78 Georgia Way | 0.36mi | 3/2.0 | 1,162 (-6%) | 2mo | $210,000 | $181 | 73 |
| 284 Heritage Way | 0.16mi | 3/2.0 | 1,336 (+8%) | 8mo | $130,000 | $97 | 72 |
| 528 Heritage Way | 0.29mi | 3/2.0 | 1,120 (-9%) | 2mo | $185,000 | $165 | 69 |
| 317 Heritage Way | 0.21mi | 3/2.0 | 1,085 (-12%) | 6mo | $190,000 | $175 | 65 |
| 2128 Heritage Way | 0.16mi | 3/2.0 | 1,387 (+13%) | 11mo | $182,500 | $132 | 63 |
| 364 Valley Forge Way S | 0.39mi | 3/2.0 | 1,120 (-9%) | 6mo | $190,000 | $170 | 62 |
| 236 Washington Ln | 0.44mi | 3/2.0 | 1,321 (+7%) | 11mo | $198,000 | $150 | 58 |
| 1371 Heritage Way | 0.62mi | 3/2.0 | 1,112 (-10%) | 2mo | $175,000 | $157 | 53 |
Match score weights: distance 35% · size 25% · config 20% · recency 20%. Top-matched comps best support the ARV.
Projected returns pro-forma
-3.0% appreciation · 2.95% rent growth · sell at horizon
- IRR
- 4.4%
- Equity multiple
- 1.17×
- Total profit
- $6,561
- Equity at exit
- $20,576
- IRR
- 13.8%
- Equity multiple
- 2.10×
- Total profit
- $42,564
- Equity at exit
- $11,932
Cash invested: $38,640 (down + closing). Projections, not guarantees.
Landlord ↔ Tenant lean methodology
- Overall (STATE)
- 85 Strongly Landlord-Friendly
- State North Carolina
- 85 Strongly Landlord-Friendly · R+3
- County
- — inherits STATE
- City
- — inherits STATE
ZIP-level market 28326
- Home prices YoY
- -9.9%
- Rents YoY
- 3.0%
- Active inventory
- 244
- Price-to-rent
- 7.1×
Monthly cashflow live
- Estimated rent
- $1,614 high interval (Pro) →
- Mortgage (P&I)
- −$724
- Tax from tax record
- −$37 /mo · $447/yr
- Insurance
- −$58
- HOA
- −$0
- Vacancy / Maint / Mgmt
- −$339
- Net cashflow
- $456
Break-even live
UW: 25.0% down · 7.5% · 30yr · 1.5% tax · 5.0% vac · 8.0% maint · 8.0% mgmt
Financing live
Cash to close
- Down payment
- $34,500
- Closing costs
- $4,140
- Reserves months
- —
- Total cash needed
- —
Loan-product check · same deal, 3 products live
Conventional
25% down · 7.5% · 30yr
- Down + closing
- —
- Monthly P&I
- —
- Monthly cashflow
- —
- DSCR
- —
- Eligible?
- —
Personal DTI + credit; lowest rate.
DSCR
20% down · 8.5% · 30yr
- Down + closing
- —
- Monthly P&I
- —
- Monthly cashflow
- —
- DSCR
- —
- Eligible?
- —
No personal income docs; deal must DSCR.
Hard money
10% down · 12.0% · 12mo
- Down + closing
- —
- Monthly P&I
- —
- Monthly cashflow
- —
- DSCR
- —
- Eligible?
- —
Short-term bridge; refi at stabilization.
Rent comps 6 comps
| Address | Beds | Baths | Sqft | Rent | $/sqft | DOM | Units | Dist |
|---|---|---|---|---|---|---|---|---|
| 96 Heritage Way Cameron, NC | 3.0 | 1.0 | 1232 | $1,195 | $0.97 | 23d | 1 | 0.03mi |
| 105 Valley Forge Way N Cameron, NC | 3.0 | 2.0 | 1344 | $1,325 | $0.99 | 13d | 1 | 0.12mi |
| 38 Paul Revere Ln Cameron, NC | 3.0 | 2.0 | 1120 | $1,399 | $1.25 | 23d | 1 | 0.61mi |
| 478 Washington Ln Cameron, NC | 3.0 | 2.0 | 1120 | $1,250 | $1.12 | 23d | 1 | 0.63mi |
| 159 Pine Haven Dr Sanford, NC | 2.0 | 2.0 | 1200 | $1,350 | $1.12 | 23d | 1 | 1.21mi |
| 45 Castle Wood Sanford, NC | 3.0 | 2.0 | 1250 | $1,399 | $1.12 | 23d | 1 | 1.39mi |
Listing history 3 events
-
2026-06-14statusdays on market $138,000 Pending 4 DOM
-
2026-06-10remarks 343-char remark
-
2026-06-10$138,000 Active 1 DOM
ⓘ Source: listings_history table (triggers on properties + properties_extension) + one-shot
backfill from property_details.listing_events for pre-trigger history.
Tax reassessment forecast NC · Resets to sale price
- Current annual tax
- $447 · $37/mo
- Projected year-2 tax
- $1,132 · $94/mo
- Expected delta
- +$685/yr (+$57/mo · 153.2%)
ⓘ Screening estimate from a state-policy table — verify with the county assessor before closing.
Climate risk First Street
- Flood 1/10 Low FEMA zone X (unshaded) · 0% chance over 30 yrs
- Wildfire 6/10 Major
- Heat 7/10 Severe 7 d/yr ≥106°F today · 16 d/yr by 30 yrs out
- Wind 6/10 Major 69% chance of damaging wind over 30 yrs
- Air quality 1/10 Low 0 unhealthy d/yr today · 0 by 30 yrs out
Nearby sold comps map
Loading sold comps map…
Walkable amenities ~0.75 mi
Loading nearby amenities…
Taxation est. · year 1
- Rental income
- $19,363
- − Mortgage interest
- −$7,730
- − Property taxes
- −$447
- − Insurance
- −$690
- − Repairs & maintenance
- −$1,549
- − Management
- −$1,549
- − Depreciation
- −$4,015
- Taxable income
- $3,383
- Est. tax owed @ 24.0%
- −$812
- After-tax cash flow
- $4,664/yr
For passive investors: Depreciation is non-cash, so a rental often shows a tax loss while cash-flowing — sheltering income. Rental losses are passive: they offset passive income freely, and up to $25,000/yr can offset ordinary (W-2) income if you actively participate and your MAGI is under $100k (phasing out to $0 by $150k); unused losses carry forward. On sale, claimed depreciation is recaptured at up to 25%, and gains may owe capital-gains tax (a 1031 exchange can defer both). Figures are a year-1 estimate at your 24.0% rate — not tax advice; consult a CPA.
Schools (NCES district)
- District
- Harnett County Schools
- NCES district ID
- 3702010
- Math proficiency
- 31% ▼ -2.00%
- Reading proficiency
- 39% ▼ -1.00%
- Median HH income
- $45,400
- Composite
- 29.88/100
- National rank
- #6397
- State rank
- #130 of 178 in NC
Livability — Spout Springs
No livability data for this city. (Only ~50 U.S. cities are tracked.)
Census & demographics
- County
- Harnett County · 125,715 people
- Metro
- Fayetteville, NC
- Population (ZIP)
- 26,068
- Household income
- $75,431
- Rent vs Own
- Severe rent burden
- 456.0
Population outlook (Harnett County) Hauer SSP2
- Today (2025)
- 153,758 people
- By 2030
- 166,581 · +8.3%
- By 2040
- 192,741 · +25.4%
- By 2050
- 218,332 · +42.0%
- By 2075
- 275,422 · +79.1%
- By 2100
- 313,511 · +103.9%
Race, ethnicity, and origin ACS 2023
- Neighborhood character
- Diverse neighborhood (Simpson 0.64)
- Race & ethnicity
- White 52% Black 27% Hispanic / Latino 12% Two or more races 8% Asian 1%
- Hispanic origin (detail)
- Mexican 5% Puerto Rican 6%
- Common ancestry
- Slovak 3% Lithuanian 3% Serbian 2%
- Foreign-born
- 4% · Canada
- Languages at home
- 91% English-only · Spanish 7%
Political lean MEDSL · Harnett
- 2024 margin
- Strong R (+25.1) · D 36.9% · R 62.0% · Other 1.1%
- 2008→2024 swing
- -8.4pp toward R · 2008: -16.7pp · 2024: -25.1pp
- All cycles
- 2024: R+25.1 2020: R+22.4 2016: R+24.1 2012: R+19.4 2008: R+16.7
Not yet ingested
- Civics
- —
Market trends
- HPI YoY
- ▼ -24.96%
- Current HPI
- 226.8295
- Rent YoY
- ▲ 2.95%
- Metro
- Fayetteville, NC
- State GDP YoY
- ▲ 3.28%
- F500 in state
- 26
Industry mix (Fortune 500 HQ in NC)
| Industry | F500 HQs | Revenue |
|---|---|---|
| Financial Services | 2 | $213B |
|
||
| Retail | 2 | $95B |
|
||
| Industrial Conglomerate | 1 | $38B |
|
||
| Metals / Steel | 1 | $35B |
|
||
| Utilities | 1 | $30B |
|
||
| Industrial Machinery | 1 | $19B |
|
||
Price history
+367.8% since first listed19 events — show timeline
- 2026-06-09 Listed $138,000 LPRMLS
- 2026-04-03 Listed for Rent $1,195 TMLS
- 2024-10-16 Rental Removed $1,195 TMLS
- 2024-09-19 Rental Removed $1,195 LPRMLS
- 2024-09-19 Listed for Rent $1,195 LPRMLS
- 2024-09-05 Rental Removed $1,195 LPRMLS
- 2024-09-04 Listed for Rent $1,195 LPRMLS
- 2024-08-29 Rental Removed $1,195 LPRMLS
- 2024-08-28 Listed for Rent $1,195 LPRMLS
- 2024-08-08 Price Changed $1,250 TMLS
- 2024-08-06 Rental Removed $1,295 LPRMLS
- 2024-08-05 Listed for Rent $1,295 LPRMLS
- 2024-07-22 Rental Removed $1,295 LPRMLS
- 2024-07-20 Listed for Rent $1,295 LPRMLS
- 2024-07-20 Listed for Rent $1,295 TMLS
- 2016-04-27 Sold (MLS) $38,000 CANOPYMLS as Distributed by MLS Grid
- 2016-02-01 Listed $65,000 CANOPYMLS as Distributed by MLS Grid
- 2015-09-29 Sold (MLS) $24,000 LPRMLS
- 2015-07-14 Listed $29,500 LPRMLS
Property tax history
-0.8%/yrLatest (2025): $447 · +0.0% YoY. Source: county tax records.
Cash-flow waterfall
monthlySold comps — $/sqft
last 12 mo · ≤1 miLoading sold comps…