10501 South Dr #286 · Houston, TX
Flood risk 8/10 · Major
- FEMA flood zone
- X (shaded)
- Chance of flooding over 30 yrs
- 0.99%
- Est. flood insurance / yr
- $507 – $1,088
Fire risk 1/10 · Minimal
- Est. fire insurance / yr
- $1,222 – $2,270
Heat risk 9/10 · Severe
- Hot days now (above 111°F)
- 7 days/yr
- Hot days in 30 yrs
- 23 days/yr
Wind risk 9/10 · Severe
- Chance of severe wind over 30 yrs
- 99.0%
Air-quality risk 2/10 · Minimal
- Unhealthy air days now
- 2 days/yr
- Unhealthy air days in 30 yrs
- 2 days/yr
Risk factors via First Street. Map © Google.
Why this score? — see what drove the D+ grade
The composite is a weighted blend of 9 inputs, each scored 0–100. Each bar is that input's sub-score; the figure is the points it added to the 100-point composite (weight × sub-score).
- Cash flow +13.0/30.0
- 1% rule +10.0/10.0
- Appreciation +6.3/10.0
- ARV discount +5.4/15.0
- DSCR +3.9/10.0
- Livability +3.7/5.0
- Condition / age +2.5/5.0
- Rent growth +2.1/5.0
- Schools +2.1/10.0
$75,000
🖨 Deal sheet (PDF) 📄 Offer letter ✓ Due diligence
Listing remarks MLS
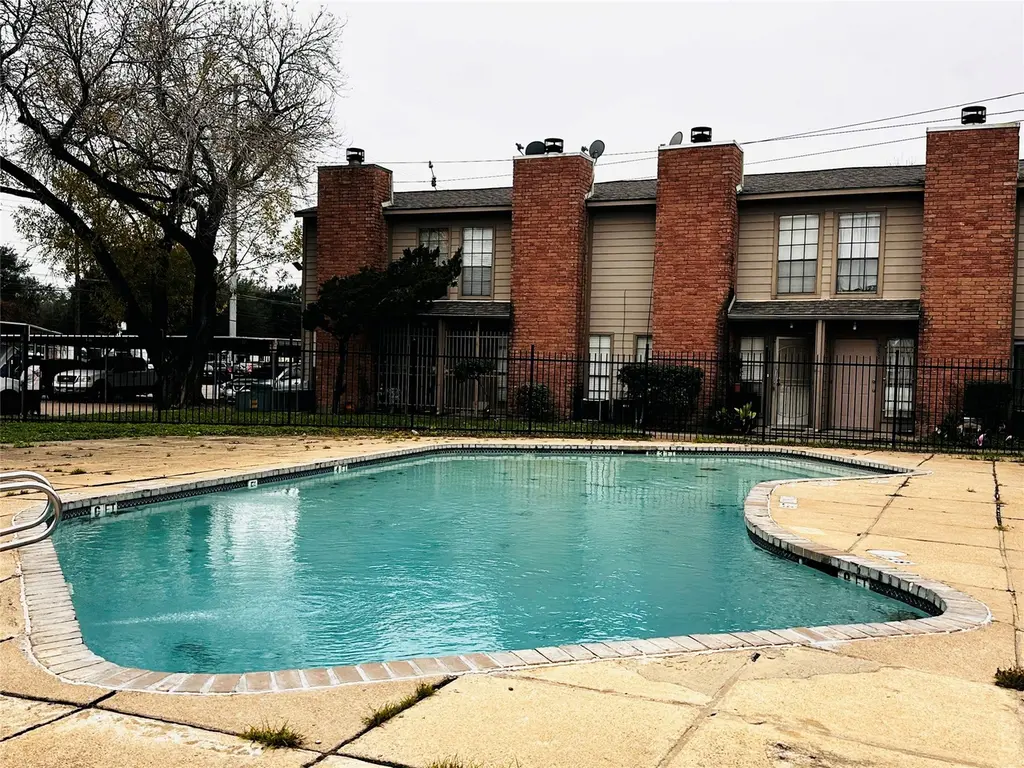
convenient location with easy access to I-59 & Bellway 8 freeways! This charming 2-bedroom, 1-bathroom condo is ready for its next owner. The open-concept living and dining areas create an inviting space, perfect for entertaining family and friends. The kitchen has been has granite countertops. Both bedrooms are generously sized and feature walk-in closets. The condo has all tile floor—ideal for relaxing and enjoying your own space.
Key facts
- Walk-in closets
- Convenient location
- Easy access to i-59
Tags
Neighborhood map
What this means for you Summary
Snapshot
- This is a 2-bed/1.0-bath condo listed at $75k.
Deal economics
- At list price, monthly cash flow is $-71 ($-850/yr) — negative.
- To cash-flow at today's rent, offer at most $62k (16.7% below list).
- Meets the 1% rule at list price ($1k rent vs $75k).
- Recommended offer: $62k (16.7% below list) — sets the bar for cash-flow.
- Cap rate 6.2% vs local median 3.2% in Houston — top-decile yield for the area; either an underpriced asset or a hidden risk that comps aren't pricing in. Stress-test before assuming the spread holds.
Location & tenants
- Location reads 74/100 on livability (#184 in TX, #4,771 nationally) — a middle-class / working-renter tenant base. Strengths: amenities A+, cost of living A+, housing A+; Watch: crime F.
- Alief ISD (urban): math 23% / reading 28% proficiency, ranked #717 of 826 in TX (top 87%) — low school quality limits family demand, transient renter base, plan for 1-2y turnover; 74% free/reduced lunch — lower-income household profile, screen leases tightly.
- Zoned schools: Smith El (math 25% / reading 25%, grade F, #3,013 of 4,322 statewide, top 70%, 626 students, 93% FRL); Olle Middle (math 16% / reading 32%, grade F, #1,301 of 1,662 statewide, top 79%, 1,067 students, 90% FRL); Alief Isd J J A E P (13 students, 77% FRL).
- Market conditions: Rents soft (-1.7%/yr); 147 active listings in the ZIP; 40 comparable units currently listed for rent nearby; rentals at typical pace (median 24d on market — plan ~3-4 weeks tenant-placement turnaround); 29,883 units permitted in Harris County in 2024 (8,621 in 5+ unit buildings).
Forward outlook
- In year one you build about $2k of equity ($519 loan paydown + $2k appreciation (2.6% local appreciation)).
- Harris County population projected at +47% by 2050 — long-run rental-demand tailwind backs the buy-and-hold thesis.
Negotiation context
- It's been on market 152 days — a 12% lower offer ($66k) is reasonable based on typical stale-listing flexibility.
- 5 sale attempts since 10y ago with the ask held roughly flat each time — persistent listings suggest the price (not the market) is what's stuck; bring a comps-based counter.
- Current owner paid $12k; list at $75k implies a 552% gain — meaningful room to come down on a strong offer.
Risks & watch-outs
- Watch-outs: flood insurance adds $66/mo; HOA is 30% of rent.
- Climate carrying-cost: severe flood risk; severe wind risk, 99% chance of damaging wind over 30y; extreme-heat days projected 7→23/yr by 2055 (HVAC capex compounding) — expect insurance premiums to compound above CPI over the hold.
Questions for the listing agent
- What do current leases actually rent for vs. the listed asking? Can we see a recent rent roll and the last 12 months of T-12 income?
- It's been on market 152 days. Have you received any prior offers? Is the seller open to a 17% concession, seller financing, or rate buy-down credit?
- What's the actual annual flood-insurance premium (NFIP or private), and is the property in a SFHA with mandatory coverage?
- What does the HOA fee cover, when was the last increase, and are there any pending special assessments or reserve-fund shortfalls?
- Any open or pending special assessments — roof, HVAC, plumbing, elevator, façade? What's the per-unit balance and payoff schedule, and is the seller paying it off at close or rolling it to the buyer?
- Why hasn't it sold? Are there any deal-killer items the seller is aware of (foundation, flood, title, zoning, code violations)?
- Is there a deadline driving the sale (1031 exchange, divorce, estate, relocation)? That informs how much negotiation room exists.
- Schools are D-rated, which usually means shorter tenancies and higher turnover. Who's the typical renter profile here, and what's been the actual vacancy rate?
- Crime grade is F in this area — have there been break-ins, vandalism, or insurance claims at this property in the last 3 years? What carrier currently insures it and at what premium?
- The area grade is low — what's the realistic commute time and amenity access for the typical tenant pool here? Any planned neighborhood developments (good or bad) we should know about?
- What's the average days-on-market for RENTAL listings here right now (not sales)? A rising rental-DOM trend means longer vacancies and softer asking-rent achievability than the comps imply.
- What's the recent tenant-quality profile in this submarket — average credit score on applications, eviction rate, late-payment / NSF rate, and stable-employment percentage? A property-management company in the area should have these aggregated.
- How much new apartment / multifamily construction is in the pipeline within 1–3 miles? Heavy new supply (>2% of stock underway) typically softens rents 12–24 months out; light construction supports rent growth.
Investment metrics
- 1% rule
- 1.55% ✓
- Cap rate
- 6.22%
- Cash-on-cash
- -0.25%
- DSCR
- 0.99
- GRM
- 5.4
CMA / ARV
- ARV (median comp)
- $71,731
- List price
- $75,000
- Delta
- 4.56%
- Verdict
- FAIR
- Comps
- 20 within 1.0 mi
Projected returns pro-forma
2.64% appreciation · 0.0% rent growth · sell at horizon
- IRR
- -0.0%
- Equity multiple
- 1.00×
- Total profit
- $-2
- Equity at exit
- $32,209
- IRR
- 1.6%
- Equity multiple
- 1.22×
- Total profit
- $4,545
- Equity at exit
- $48,490
Cash invested: $21,000 (down + closing). Projections, not guarantees.
Landlord ↔ Tenant lean methodology
- Overall (STATE)
- 87 Strongly Landlord-Friendly
- State Texas
- 87 Strongly Landlord-Friendly · R+5
- County
- — inherits STATE
- City
- — inherits STATE
ZIP-level market 77099
- Home prices YoY
- 0.8%
- Rents YoY
- -1.7%
- Active inventory
- 147
- Price-to-rent
- 5.4×
Monthly cashflow live
- Estimated rent
- $1,162 high interval (Pro) →
- Mortgage (P&I)
- −$393
- Tax from tax record
- −$148 /mo · $1,775/yr
- Insurance
- −$31
- Flood insurance flood zone
- −$66 /mo · $798/yr
- HOA
- −$350
- Vacancy / Maint / Mgmt
- −$244
- Net cashflow
- $-71
Break-even live
Sensitivity live
| Price | -10% $-28 | -5% $-50 | +0% $-71 | +5% $-92 | +10% $-113 |
|---|---|---|---|---|---|
| Rent | -10% $-163 | -5% $-117 | +0% $-71 | +5% $-25 | +10% $21 |
| Rate | -1.0pp $-33 | -0.5pp $-52 | base $-71 | +0.5pp $-90 | +1.0pp $-110 |
UW: 25.0% down · 7.5% · 30yr · 1.5% tax · 5.0% vac · 8.0% maint · 8.0% mgmt
Financing live
Cash to close
- Down payment
- $18,750
- Closing costs
- $2,250
- Reserves months
- —
- Total cash needed
- —
Loan-product check · same deal, 3 products live
Conventional
25% down · 7.5% · 30yr
- Down + closing
- —
- Monthly P&I
- —
- Monthly cashflow
- —
- DSCR
- —
- Eligible?
- —
Personal DTI + credit; lowest rate.
DSCR
20% down · 8.5% · 30yr
- Down + closing
- —
- Monthly P&I
- —
- Monthly cashflow
- —
- DSCR
- —
- Eligible?
- —
No personal income docs; deal must DSCR.
Hard money
10% down · 12.0% · 12mo
- Down + closing
- —
- Monthly P&I
- —
- Monthly cashflow
- —
- DSCR
- —
- Eligible?
- —
Short-term bridge; refi at stabilization.
Rent comps 40 comps
| Address | Beds | Baths | Sqft | Rent | $/sqft | DOM | Units | Dist |
|---|---|---|---|---|---|---|---|---|
| 10440 South Dr Houston, TX | 1.0–2.0 | 1.0–2.0 | 773 | $1,340 | $1.73 | 3d | 27 | 0.05mi |
| 13 South Dr Houston, TX | 1.0 | 1.0 | 588 | $894 | $1.52 | 45d | 1 | 0.14mi |
| 10300 S Wilcrest Dr Unit 10351 Houston, TX | 1.0 | 1.0 | 650 | $733 | $1.13 | 14d | 1 | 0.31mi |
| 10300 S Wilcrest Dr Unit 10374 Houston, TX | 1.0 | 1.0 | 650 | $779 | $1.20 | 14d | 1 | 0.31mi |
| 10300 S Wilcrest Dr Unit 10374 Houston, TX | 1.0 | 1.0 | 650 | $733 | $1.13 | 0d | 1 | 0.31mi |
| 10286 Forum West Dr Houston, TX | 1.0 | 1.0 | 553 | $830 | $1.50 | 20d | 1 | 0.40mi |
| 10286 Forum West Dr Houston, TX | 2.0 | 2.0 | 1046 | $1,200 | $1.15 | 26d | 1 | 0.40mi |
| 10286 Forum West Dr Houston, TX | 1.0 | 1.0 | 553 | $830 | $1.50 | 45d | 1 | 0.40mi |
| 10101 W Sam Houston Pkwy S Houston, TX | 1.0–2.0 | 1.0–2.0 | 809 | $1,145 | $1.41 | 45d | 1 | 0.47mi |
| 10110 Forum Park Dr Houston, TX | 1.0–2.0 | 1.0–2.0 | 976 | $999 | $1.02 | 45d | 2 | 0.59mi |
| 10925 Stancliff Rd Houston, TX | 2.0 | 2.0 | 931 | $1,425 | $1.53 | 45d | 1 | 0.61mi |
| 10256 Lands End Dr Houston, TX | 1.0 | 1.0 | 659 | $929 | $1.41 | 45d | 1 | 0.62mi |
| 10225 Bissonnet St Houston, TX | 1.0–2.0 | 1.0–2.5 | 992 | $1,480 | $1.49 | 0d | 45 | 0.65mi |
| 10250 Lands End Dr Houston, TX | 2.0 | 1.0–2.0 | 750 | $1,399 | $1.86 | 26d | 16 | 0.66mi |
| 10919 Stancliff Rd Unit 10940 Houston, TX | 1.0 | 1.0 | 673 | $1,299 | $1.93 | 14d | 1 | 0.67mi |
| 10919 Stancliff Rd Unit 1112 Houston, TX | 1.0 | 1.0 | 673 | $1,253 | $1.86 | 0d | 1 | 0.67mi |
| 10919 Stancliff Rd Unit 10934 Houston, TX | 1.0 | 1.0 | 673 | $1,303 | $1.94 | 12d | 1 | 0.67mi |
| 10919 Stancliff Rd Unit 1162 Houston, TX | 1.0 | 1.0 | 673 | $1,264 | $1.88 | 7d | 1 | 0.67mi |
| 10919 Stancliff Rd Unit 2162 Houston, TX | 2.0 | 2.0 | 931 | $1,519 | $1.63 | 7d | 1 | 0.67mi |
| 10919 Stancliff Rd Unit 422 Houston, TX | 2.0 | 2.0 | 931 | $1,519 | $1.63 | 9d | 1 | 0.67mi |
| 10919 Stancliff Rd Unit 2112 Houston, TX | 2.0 | 2.0 | 931 | $1,503 | $1.61 | 0d | 1 | 0.67mi |
| 10919 Stancliff Rd Unit 2174 Houston, TX | 2.0 | 2.0 | 931 | $1,543 | $1.66 | 12d | 1 | 0.67mi |
| 10919 Stancliff Rd Unit 324 Houston, TX | 1.0 | 1.0 | 673 | $1,264 | $1.88 | 9d | 1 | 0.67mi |
| 10919 Stancliff Rd Unit 10976 Houston, TX | 2.0 | 2.0 | 931 | $1,544 | $1.66 | 45d | 1 | 0.67mi |
| 10919 Stancliff Rd Houston, TX | 2.0 | 2.0 | 931 | $1,529 | $1.64 | 45d | 1 | 0.69mi |
| 10919 Stancliff Rd Houston, TX | 1.0 | 1.0 | 673 | $1,253 | $1.86 | 14d | 1 | 0.69mi |
| 9797 Leawood Blvd Houston, TX | 2.0 | 2.0 | 1095 | $1,175 | $1.07 | 45d | 2 | 0.71mi |
| 9898 Forum Park Dr Unit 6406 Houston, TX | 1.0 | 1.0 | 750 | $925 | $1.23 | 45d | 1 | 0.74mi |
| 10107 Forum Park Dr Houston, TX | 1.0 | 1.0 | 550 | $770 | $1.40 | 45d | 1 | 0.77mi |
| 10107 Forum Park Dr Houston, TX | 1.0 | 1.0 | 550 | $770 | $1.40 | 23d | 1 | 0.77mi |
| 10107 Forum Park Dr Houston, TX | 2.0 | 2.0 | 1100 | $970 | $0.88 | 26d | 1 | 0.77mi |
| 10101 Forum Park Dr Houston, TX | 1.0–2.0 | 1.0–2.0 | 825 | $1,323 | $1.60 | 0d | 22 | 0.77mi |
| 10009 Forum Park Dr Houston, TX | 1.0 | 1.0 | 543 | $819 | $1.51 | 23d | 1 | 0.80mi |
| 10009 Forum Park Dr Houston, TX | 2.0 | 2.0 | 969 | $979 | $1.01 | 26d | 1 | 0.80mi |
| 10009 Forum Park Dr Houston, TX | 1.0 | 1.0 | 543 | $819 | $1.51 | 45d | 1 | 0.80mi |
| 10896 W Bellfort Ave Houston, TX | 2.0 | 2.0 | 931 | $1,529 | $1.64 | 20d | 1 | 0.84mi |
| 10896 W Bellfort Ave Unit AASF Houston, TX | 2.0 | 2.0 | 931 | $1,529 | $1.64 | 26d | 1 | 0.84mi |
| 9700 Leawood Blvd Houston, TX | 1.0–2.0 | 1.0–2.0 | 776 | $1,400 | $1.80 | 45d | 7 | 0.90mi |
| 9700 Leawood Blvd Houston, TX | 1.0–2.0 | 1.0–2.0 | 776 | $1,400 | $1.80 | 5d | 5 | 0.90mi |
| 9475 W Sam Houston Pkwy S Houston, TX | 1.0–2.0 | 1.0–2.0 | 725 | $1,284 | $1.77 | 7d | 18 | 0.96mi |
HOA detail condo
- Monthly dues
- $350 · $4,200/yr
- Assessments
- None detected in remarks — confirm with the listing agent.
Listing history 36 events
-
2026-06-21days on market $75,000 Active 152 DOM
-
2026-06-18days on market $75,000 Active 149 DOM
-
2026-06-17days on market $75,000 Active 148 DOM
-
2026-06-16days on market $75,000 Active 147 DOM
-
2026-06-15days on market $75,000 Active 146 DOM
-
2026-06-13days on market $75,000 Active 144 DOM
-
2026-06-09days on market $75,000 Active 140 DOM
-
2026-06-08days on market $75,000 Active 139 DOM
-
2026-06-07days on market $75,000 Active 138 DOM
-
2026-06-04days on market $75,000 Active 135 DOM
-
2026-06-03days on market $75,000 Active 134 DOM
-
2026-06-02days on market $75,000 Active 133 DOM
-
2026-06-01days on market $75,000 Active 132 DOM
-
2026-05-31days on market $75,000 Active 131 DOM
-
2026-01-20$75,000 Active 447-char remark
Show marketing remark (447 chars)
convenient location with easy access to I-59 & Bellway 8 freeways! This charming 2-bedroom, 1-bathroom condo is ready for its next owner. The open-concept living and dining areas create an inviting space, perfect for entertaining family and friends. The kitchen has been has granite countertops. Both bedrooms are generously sized and feature walk-in closets. The condo has all tile floor—ideal for relaxing and enjoying your own space.
-
2025-01-17soldstatus Sold 399-char remark
Show marketing remark (399 chars)
Great location, easy access to the major freeways!! This 2 bedroom, 1 bathroom condo is looking for its next owner! The living and dining room to this home are very open allowing for easy entertainment when family and friends visit! The kitchen is updated with granite counter tops. Both rooms are fairly spacious with walk in closets. Condo features a closed in outside patio area to enjoy as well!
-
2025-01-17soldstatus
Show marketing remark (399 chars)
Great location, easy access to the major freeways!! This 2 bedroom, 1 bathroom condo is looking for its next owner! The living and dining room to this home are very open allowing for easy entertainment when family and friends visit! The kitchen is updated with granite counter tops. Both rooms are fairly spacious with walk in closets. Condo features a closed in outside patio area to enjoy as well!
-
2025-01-03status Pending 399-char remark
Show marketing remark (399 chars)
Great location, easy access to the major freeways!! This 2 bedroom, 1 bathroom condo is looking for its next owner! The living and dining room to this home are very open allowing for easy entertainment when family and friends visit! The kitchen is updated with granite counter tops. Both rooms are fairly spacious with walk in closets. Condo features a closed in outside patio area to enjoy as well!
-
2024-12-23$55,000 Active 399-char remark
Show marketing remark (399 chars)
Great location, easy access to the major freeways!! This 2 bedroom, 1 bathroom condo is looking for its next owner! The living and dining room to this home are very open allowing for easy entertainment when family and friends visit! The kitchen is updated with granite counter tops. Both rooms are fairly spacious with walk in closets. Condo features a closed in outside patio area to enjoy as well!
-
2021-04-07soldstatus
-
2021-04-01soldstatus Sold
-
2021-03-27status Option Pending
-
2021-01-08$61,500 Active
-
2020-11-28historical
-
2020-10-23price $66,500
-
2020-06-26price $69,500
-
2020-01-02$75,000 Active
-
2016-08-09soldstatus
-
2016-08-08soldstatus Sold
-
2016-07-25status Pending
-
2016-06-26$35,000 Active
-
2015-02-25soldstatus
-
2012-10-05soldstatus
-
2012-01-09soldstatus
-
2009-05-26soldstatus
-
1996-08-26soldstatus $11,500
ⓘ Source: listings_history table (triggers on properties + properties_extension) + one-shot
backfill from property_details.listing_events for pre-trigger history.
Tax reassessment forecast TX · Resets to sale price
- Current annual tax
- $1,775 · $148/mo
- Projected year-2 tax
- $1,775 · $148/mo
- Expected delta
- $0/yr ($0/mo · 0.0%)
ⓘ Screening estimate from a state-policy table — verify with the county assessor before closing.
Climate risk First Street
- Flood 8/10 Severe FEMA zone X (shaded) · 99% chance over 30 yrs
- Wildfire 1/10 Low
- Heat 9/10 Extreme 7 d/yr ≥111°F today · 23 d/yr by 30 yrs out
- Wind 9/10 Extreme 99% chance of damaging wind over 30 yrs
- Air quality 2/10 Low 2 unhealthy d/yr today · 2 by 30 yrs out
Nearby sold comps map
Loading sold comps map…
Walkable amenities ~0.75 mi
Loading nearby amenities…
Taxation est. · year 1
- Rental income
- $13,946
- − Mortgage interest
- −$4,201
- − Property taxes
- −$1,775
- − Insurance
- −$1,172
- − Repairs & maintenance
- −$1,116
- − Management
- −$1,116
- − HOA
- −$4,200
- − Depreciation
- −$2,182
- Taxable loss
- −$1,816
- Est. tax savings @ 24.0%
- +$436
- After-tax cash flow
- $-415/yr
For passive investors: Depreciation is non-cash, so a rental often shows a tax loss while cash-flowing — sheltering income. Rental losses are passive: they offset passive income freely, and up to $25,000/yr can offset ordinary (W-2) income if you actively participate and your MAGI is under $100k (phasing out to $0 by $150k); unused losses carry forward. On sale, claimed depreciation is recaptured at up to 25%, and gains may owe capital-gains tax (a 1031 exchange can defer both). Figures are a year-1 estimate at your 24.0% rate — not tax advice; consult a CPA.
Schools (NCES district)
- District
- Alief ISD
- NCES district ID
- 4807830
- Math proficiency
- 23% ▼ -19.00%
- Reading proficiency
- 28% ▼ -8.00%
- Median HH income
- $37,775
- Composite
- 21.29/100
- National rank
- #8391
- State rank
- #717 of 826 in TX
Livability — Houston
- Score
- 74/100
- State rank
- #184
- US rank
- #4771
Category grades
Schools grade is shown separately in the Schools card above.
Census & demographics
- Census place
- Houston, TX
- County
- Harris County · 4,702,590 people
- City population
- 3,226,434
- Metro
- Houston-The Woodlands-Sugar Land, TX
- Population (ZIP)
- 50,064
- Household income
- $49,396
- Rent vs Own
- Severe rent burden
- 3423.0
Population outlook (Harris County) Hauer SSP2
- Today (2025)
- 5,571,493 people
- By 2030
- 6,089,821 · +9.3%
- By 2040
- 7,142,806 · +28.2%
- By 2050
- 8,185,864 · +46.9%
- By 2075
- 10,574,329 · +89.8%
- By 2100
- 12,109,958 · +117.4%
Race, ethnicity, and origin ACS 2023
- Neighborhood character
- Diverse neighborhood (Simpson 0.66)
- Race & ethnicity
- Hispanic / Latino 47% Black 31% Asian 14% Two or more races 14% White 7%
- Hispanic origin (detail)
- Mexican 24%
- Foreign-born
- 46% · Canada, Vietnam, China
- Languages at home
- 41% English-only · Spanish 40% Other Indo-European 5% Vietnamese 4%
Political lean MEDSL · Harris
- 2024 margin
- Lean D (+5.5) · D 52.0% · R 46.4% · Other 1.6%
- 2008→2024 swing
- +3.9pp toward D · 2008: 1.6pp · 2024: 5.5pp
- All cycles
- 2024: D+5.5 2020: D+13.3 2016: D+12.4 2012: D+0.1 2008: D+1.6
Not yet ingested
- Civics
- —
Market trends
- HPI YoY
- ▲ 2.64%
- Current HPI
- 334.6278
- Rent YoY
- ▼ -1.69%
- Metro
- Houston-The Woodlands-Sugar Land, TX
- State GDP YoY
- ▲ 3.95%
- F500 in state
- 110
Industry mix (Fortune 500 HQ in TX)
| Industry | F500 HQs | Revenue |
|---|---|---|
| Energy | 16 | $1,198B |
|
||
| Technology | 5 | $198B |
|
||
| Engineering / Construction | 4 | $72B |
|
||
| Energy Services | 3 | $60B |
|
||
| Utilities | 3 | $41B |
|
||
| Healthcare | 2 | $330B |
|
||
Price history
+552.2% since first listed22 events — show timeline
- 2026-01-20 Listed $75,000 HARMLS
- 2025-01-17 Sold (Public Records) — Public Records
- 2025-01-17 Sold (MLS) — HARMLS
- 2025-01-03 Pending — HARMLS
- 2024-12-23 Listed $55,000 HARMLS
- 2021-04-07 Sold (Public Records) — Public Records
- 2021-04-01 Sold (MLS) — HARMLS
- 2021-03-27 Pending — HARMLS
- 2021-01-08 Listed $61,500 HARMLS
- 2020-11-28 Listing Removed — HARMLS
- 2020-10-23 Price Changed $66,500 HARMLS
- 2020-06-26 Price Changed $69,500 HARMLS
- 2020-01-02 Listed $75,000 HARMLS
- 2016-08-09 Sold (Public Records) — Public Records
- 2016-08-08 Sold (MLS) — HARMLS
- 2016-07-25 Pending — HARMLS
- 2016-06-26 Listed $35,000 HARMLS
- 2015-02-25 Sold (Public Records) — Public Records
- 2012-10-05 Sold (Public Records) — Public Records
- 2012-01-09 Sold (Public Records) — Public Records
- 2009-05-26 Sold (Public Records) — Public Records
- 1996-08-26 Sold (Public Records) $11,500 Public Records
Property tax history
+9.9%/yrLatest (2025): $1,775 · -0.7% YoY. Source: county tax records.
Cash-flow waterfall
monthlySold comps — $/sqft
last 12 mo · ≤1 miLoading sold comps…