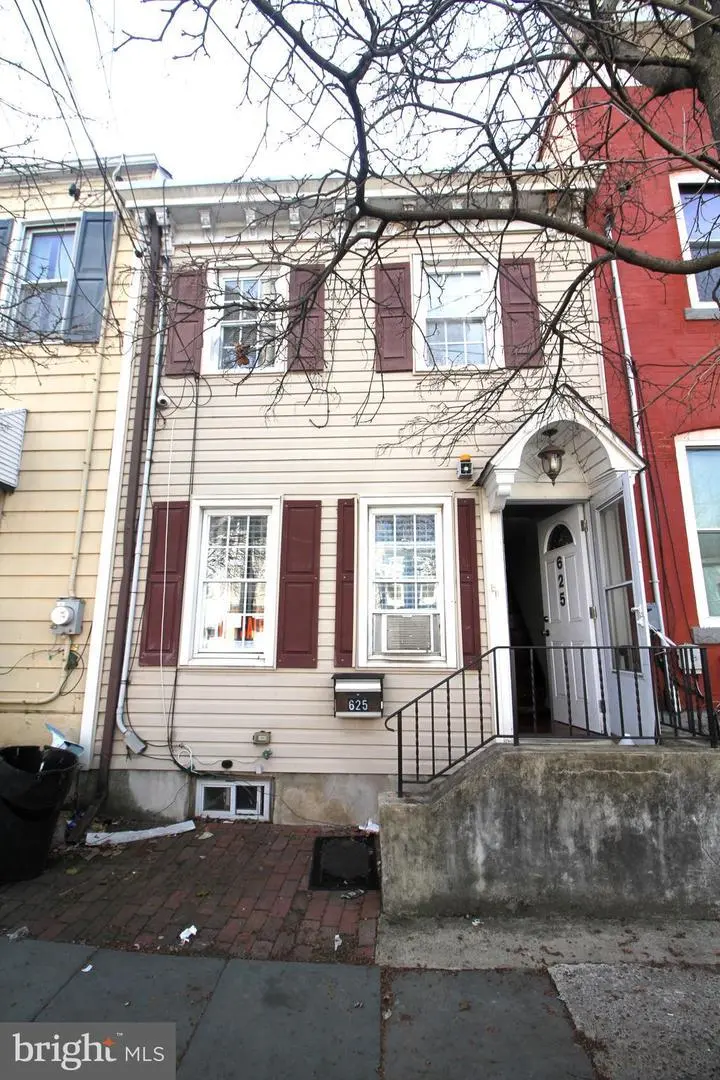
625 Lamberton St · Trenton, NJ
Flood risk 4/10 · Minor
- FEMA flood zone
- X (unshaded)
- Chance of flooding over 30 yrs
- 0.21%
- Est. flood insurance / yr
- $507 – $1,088
Fire risk 1/10 · Minimal
- Est. fire insurance / yr
- $526 – $976
Heat risk 6/10 · Moderate
- Hot days now (above 102°F)
- 7 days/yr
- Hot days in 30 yrs
- 15 days/yr
Wind risk 6/10 · Moderate
- Chance of severe wind over 30 yrs
- 27.0%
Air-quality risk 5/10 · Moderate
- Unhealthy air days now
- 6 days/yr
- Unhealthy air days in 30 yrs
- 8 days/yr
Risk factors via First Street. Map © Google.
Why this score? — see what drove the C grade
The composite is a weighted blend of 9 inputs, each scored 0–100. Each bar is that input's sub-score; the figure is the points it added to the 100-point composite (weight × sub-score).
- Cash flow +21.0/30.0
- ARV discount +15.0/15.0
- DSCR +6.7/10.0
- 1% rule +5.7/10.0
- Livability +3.8/5.0
- Rent growth +3.7/5.0
- Condition / age +2.5/5.0
- Schools +0.7/10.0
- Appreciation +0.0/10.0
$185,000
🖨 Deal sheet 📄 Offer letter ✓ Due diligence
Listing remarks
Welcome to this very well maintained row home in Trenton. Totally updated, new kitchen and new appliances with tile flooring and tile backsplash. Beautiful cherry hardwood flooring downstairs and upstairs. Two updated full bathrooms. Roof, furnace and hvac are newer. This home is move in ready! Located near Trenton Thunder Stadium and Trenton Waterfront . Convenient access to the entire Capital Complex, Princeton, recreation areas along the canal, Flemington, New Hope, Rt 195, Rt 295, Rt 29, Rt 129 for access North, South, and East to the shore.
Key facts
- New kitchen
- New appliances
- Tile flooring
Tags
Property features AI
Exterior
- Parking: On-street parking
- Utilities: Public water; Public sewer; 100 amp electric service; Cable TV available; Hot water: natural gas
- Home design: Interior townhouse/rowhouse; Flat roof; Fee simple ownership
- Construction: Brick construction; Stone foundation; Above-grade and below-grade structures; Built year per assessor
- Exterior features: Level lot with rear yard; Patio(s)
Interior
- Kitchen: Self-cleaning oven; Dishwasher; Built-in microwave
- Bedrooms: Two bedrooms on the upper level
- Flooring: Wood flooring
- Bathrooms: Two full bathrooms (one on main level, one on upper level)
- Heating & cooling: Forced air heating (natural gas); Central air conditioning
- Interior features: Ceiling fan(s); Eat-in kitchen
Neighborhood map
What this means for you Summary
Snapshot
- This is a 2-bed/2.0-bath single-family listed at $185k.
Deal economics
- At list price, monthly cash flow is $261 ($3k/yr) — positive.
- The deal already cash-flows at list — no discount required.
- Meets the 1% rule at list price ($2k rent vs $185k).
- Recommended offer: $174k (6.0% below list) — sets the bar for market timing.
- Cap rate 8.0% vs local median 6.3% in Trenton — meaningfully above typical; check what's discounted (condition, days-on-market, listing class) to confirm the premium yield is real.
Location & tenants
- Location reads 76/100 on livability (#133 in NJ, #3,533 nationally) — a middle-class / working-renter tenant base. Strengths: amenities A+, commute A+, health & safety A+; Watch: schools F, crime F, employment F.
- Trenton Public School District (urban): math 2% / reading 16% proficiency, ranked #471 of 472 in NJ (top 100%) — low school quality limits family demand, transient renter base, plan for 1-2y turnover; 80% free/reduced lunch — lower-income household profile, screen leases tightly.
- Market conditions: Rents rising fast (+4.7%/yr); 84 active listings in the ZIP; 33 comparable units currently listed for rent nearby; rentals at typical pace (median 21d on market — plan ~3-4 weeks tenant-placement turnaround); 2,256 units permitted in Mercer County in 2024 (1,303 in 5+ unit buildings).
- This rent runs 42% of the median local income ($57k/yr) — at the standard rent-burdened threshold; future hikes will face affordability resistance.
Forward outlook
- Local home prices are declining (-3.0%/yr); year-one equity from $1k of loan paydown is wiped out by about $6k of value loss. Plan a longer hold.
- Mercer County population projected at +4% by 2050 — modest demand growth; plan on rents tracking national, not racing it.
Negotiation context
- It's been on market 82 days — a 6% lower offer ($174k) is reasonable based on typical stale-listing flexibility.
- 8 sale attempts since 22y ago; this cycle's ask has dropped $25k (12%) from the opening price — seller is motivated, your offer sets the floor, not the list.
- Current owner paid $21k; list at $185k implies a 781% gain — meaningful room to come down on a strong offer.
Risks & watch-outs
- Watch-outs: built in 1876 — expect roof / HVAC / electrical / plumbing capex.
- Climate carrying-cost: major wind risk, 27% chance of damaging wind over 30y; extreme-heat days projected 7→15/yr by 2055 (HVAC capex compounding) — expect insurance premiums to compound above CPI over the hold.
Questions for the listing agent
- It's been on market 82 days. Have you received any prior offers? Is the seller open to a 6% concession, seller financing, or rate buy-down credit?
- Built in 1876 — when were the roof, HVAC, electrical panel, plumbing, and water heater last replaced?
- Why hasn't it sold? Are there any deal-killer items the seller is aware of (foundation, flood, title, zoning, code violations)?
- Is there a deadline driving the sale (1031 exchange, divorce, estate, relocation)? That informs how much negotiation room exists.
- Schools are F-rated, which usually means shorter tenancies and higher turnover. Who's the typical renter profile here, and what's been the actual vacancy rate?
- Crime grade is F in this area — have there been break-ins, vandalism, or insurance claims at this property in the last 3 years? What carrier currently insures it and at what premium?
- What's the average days-on-market for RENTAL listings here right now (not sales)? A rising rental-DOM trend means longer vacancies and softer asking-rent achievability than the comps imply.
- What's the recent tenant-quality profile in this submarket — average credit score on applications, eviction rate, late-payment / NSF rate, and stable-employment percentage? A property-management company in the area should have these aggregated.
- How much new for-sale + rental construction is in the pipeline within 1–3 miles? Heavy new supply typically softens prices + rents 12–24 months out; constrained supply supports both.
Investment metrics
- 1% rule
- 1.07% ✓
- Cap rate
- 7.99%
- Cash-on-cash
- 6.05%
- DSCR
- 1.27
- GRM
- 7.8
CMA / ARV
- ARV (on-the-fly)
- $305,784
- Comps found
- 4
Show comp detail 4 sales within ~0.75 mi
| Address | Dist | Beds/Ba | Sqft | Sold | Price | $/sf | Match |
|---|---|---|---|---|---|---|---|
| 82 Central Ave | 0.73mi | 2/1.0 | 1,126 (+1%) | 1mo | $190,000 | $169 | 59 |
| 554 Centre St | 0.27mi | 3/1.0 (+1) | 1,169 (+5%) | 23mo | $225,000 | $192 | 51 |
| 73 Central Ave | 0.72mi | 2/1.5 | 1,175 (+5%) | 11mo | $328,000 | $279 | 47 |
| 10 Bowling Green Ave | 0.74mi | 3/2.0 (+1) | 1,224 (+10%) | 1mo | $335,000 | $274 | 43 |
Match score weights: distance 35% · size 25% · config 20% · recency 20%. Top-matched comps best support the ARV.
Projected returns pro-forma
-3.0% appreciation · 4.71% rent growth · sell at horizon
- IRR
- -5.0%
- Equity multiple
- 0.81×
- Total profit
- $-9,841
- Equity at exit
- $27,584
- IRR
- 6.6%
- Equity multiple
- 1.54×
- Total profit
- $27,713
- Equity at exit
- $15,995
Cash invested: $51,800 (down + closing). Projections, not guarantees.
Landlord ↔ Tenant lean methodology
- Overall (STATE)
- 21 Tenant-Leaning
- State New Jersey
- 21 Tenant-Leaning · D+6
- County
- — inherits STATE
- City
- — inherits STATE
ZIP-level market 08611
- Rents YoY
- 4.7%
- Active inventory
- 84
- Price-to-rent
- 7.8×
Monthly cashflow live
- Estimated rent
- $1,975 high interval (Pro) →
- Mortgage (P&I)
- −$970
- Tax from tax record
- −$252 /mo · $3,022/yr
- Insurance
- −$77
- HOA
- −$0
- Vacancy / Maint / Mgmt
- −$415
- Net cashflow
- $261
Break-even live
UW: 25.0% down · 7.5% · 30yr · 1.5% tax · 5.0% vac · 8.0% maint · 8.0% mgmt
Financing live
Cash to close
- Down payment
- $46,250
- Closing costs
- $5,550
- Reserves months
- —
- Total cash needed
- —
Loan-product check · same deal, 3 products live
Conventional
25% down · 7.5% · 30yr
- Down + closing
- —
- Monthly P&I
- —
- Monthly cashflow
- —
- DSCR
- —
- Eligible?
- —
Personal DTI + credit; lowest rate.
DSCR
20% down · 8.5% · 30yr
- Down + closing
- —
- Monthly P&I
- —
- Monthly cashflow
- —
- DSCR
- —
- Eligible?
- —
No personal income docs; deal must DSCR.
Hard money
10% down · 12.0% · 12mo
- Down + closing
- —
- Monthly P&I
- —
- Monthly cashflow
- —
- DSCR
- —
- Eligible?
- —
Short-term bridge; refi at stabilization.
Rent comps 33 comps
| Address | Beds | Baths | Sqft | Rent | $/sqft | DOM | Units | Dist |
|---|---|---|---|---|---|---|---|---|
| 547 Centre St Trenton, NJ | 3.0 | 1.0 | 1060 | $1,850 | $1.75 | 21d | 1 | 0.23mi |
| 71 Clark St Trenton, NJ | 1.0–2.0 | 1.0–2.0 | 975 | $2,350 | $2.41 | 13d | 4 | 0.47mi |
| 203 Genesee St Unit 2 Trenton, NJ | 2.0 | 1.0 | 1452 | $1,700 | $1.17 | 21d | 1 | 0.47mi |
| 225 Home Ave Trenton, NJ | 2.0 | 1.0 | 800 | $1,750 | $2.19 | 21d | 1 | 0.59mi |
| 244 Jersey St Trenton, NJ | 3.0 | 1.5 | 1368 | $2,300 | $1.68 | 13d | 1 | 0.65mi |
| 313 Home Ave Trenton, NJ | 3.0 | 1.0 | 1112 | $2,100 | $1.89 | 13d | 1 | 0.66mi |
| 117 Park Ave Morrisville, PA | 3.0 | 2.0 | 1396 | $3,200 | $2.29 | 12d | 1 | 0.79mi |
| 176 Division St Apt 106 Trenton, NJ | 2.0 | 1.0 | 975 | $1,700 | $1.74 | 21d | 1 | 0.89mi |
| 705 Anderson St Trenton, NJ | 3.0 | 1.0 | 1132 | $1,800 | $1.59 | 13d | 1 | 0.95mi |
| 216 E State St Trenton, NJ | 1.0–2.0 | 1.0 | 811 | $1,895 | $2.34 | 13d | 2 | 0.95mi |
| 233 Virginia Ave Trenton, NJ | 3.0 | 1.0 | 1302 | $2,500 | $1.92 | 12d | 1 | 0.96mi |
| 130 Harper Ave Morrisville, PA | 3.0 | 2.5 | 1276 | $3,500 | $2.74 | 12d | 1 | 0.99mi |
| 202 E Hanover St Unit 5G Trenton, NJ | 2.0 | 1.0 | 750 | $1,200 | $1.60 | 21d | 1 | 1.01mi |
| 27 E Palmer St Unit 6 Morrisville, PA | 2.0 | 1.0 | 1100 | $2,100 | $1.91 | 13d | 1 | 1.01mi |
| 27 E Palmer St Unit 5 Morrisville, PA | 2.0 | 1.0 | 750 | $1,750 | $2.33 | 13d | 1 | 1.01mi |
| 720 Monmouth St Unit 103 Trenton, NJ | 1.0 | 1.0 | 832 | $1,450 | $1.74 | 21d | 1 | 1.02mi |
| 720 Monmouth St Unit 111 Trenton, NJ | 1.0 | 1.0 | 1102 | $1,500 | $1.36 | 21d | 1 | 1.02mi |
| 720 Monmouth St Unit 204 Trenton, NJ | 2.0 | 1.0 | 1011 | $1,750 | $1.73 | 21d | 1 | 1.03mi |
| 837 Genesee St Trenton, NJ | 2.0 | 1.0 | 850 | $1,700 | $2.00 | 21d | 1 | 1.03mi |
| 435 Tyler St Unit 115 Trenton, NJ | 1.0 | 1.0 | 860 | $1,600 | $1.86 | 21d | 1 | 1.05mi |
| 125 Olive St Trenton, NJ | 2.0–3.0 | 1.0–1.5 | 896 | $1,220 | $1.36 | 21d | 1 | 1.11mi |
| 105 Walnut Ave Unit 1 Trenton, NJ | 2.0 | 1.0 | 1200 | $2,000 | $1.67 | 21d | 1 | 1.12mi |
| 400 W Bridge St Unit A Morrisville, PA | 1.0 | 1.0 | 1085 | $1,495 | $1.38 | 13d | 1 | 1.14mi |
| 1049 Genesee St Trenton, NJ | 3.0 | 1.0 | 1270 | $2,300 | $1.81 | 21d | 1 | 1.18mi |
| 34 E Hendrickson Ave Morrisville, PA | 3.0 | 1.0 | 1360 | $2,650 | $1.95 | 43d | 1 | 1.18mi |
| 1132 Genesee St Unit 1132 Trenton, NJ | 3.0 | 1.0 | 1198 | $2,500 | $2.09 | 21d | 1 | 1.25mi |
| 121 Columbus Ave Trenton, NJ | 3.0 | 1.0 | 1050 | $1,900 | $1.81 | 21d | 1 | 1.26mi |
| 27 Passaic St Trenton, NJ | 2.0 | 1.0 | 900 | $1,700 | $1.89 | 21d | 1 | 1.31mi |
| 1078 Lalor St Unit 2 Trenton, NJ | 2.0 | 1.0 | 1488 | $1,785 | $1.20 | 21d | 1 | 1.31mi |
| 1078 Lalor St Unit 1 Trenton, NJ | 2.0 | 1.0 | 1488 | $1,895 | $1.27 | 21d | 1 | 1.31mi |
| 12 Belvidere St Trenton, NJ | 1.0 | 1.0 | 1068 | $1,600 | $1.50 | 21d | 1 | 1.32mi |
| 8 Belvidere St Trenton, NJ | 2.0 | 1.0 | 1260 | $1,900 | $1.51 | 21d | 1 | 1.32mi |
| 339 Tioga St #339 Trenton, NJ | 2.0 | 1.0 | 864 | $1,850 | $2.14 | 21d | 1 | 1.44mi |
Listing history 35 events
-
2026-06-18days on market $185,000 Active 82 DOM
-
2026-06-17days on market $185,000 Active 81 DOM
-
2026-06-16days on market $185,000 Active 80 DOM
-
2026-06-15days on market $185,000 Active 79 DOM
-
2026-06-14pricedays on market $185,000 Active 77 DOM
-
2026-06-10days on market $199,000 Active 74 DOM
-
2026-06-09days on market $199,000 Active 73 DOM
-
2026-06-08days on market $199,000 Active 72 DOM
-
2026-06-07days on market $199,000 Active 71 DOM
-
2026-06-03days on market $199,000 Active 67 DOM
-
2026-06-02days on market $199,000 Active 66 DOM
-
2026-06-01days on market $199,000 Active 65 DOM
-
2026-05-31days on market $199,000 Active 64 DOM
-
2026-05-30days on market $199,000 Active 63 DOM
-
2026-04-19price $199,000
-
2026-03-28$210,000 Active
-
2025-10-17historical
-
2025-06-30price $229,000
-
2025-04-22price $249,000
-
2025-04-20$429,000 Active
-
2016-03-30historical
-
2015-09-22$75,000
-
2010-06-03soldstatus $21,000
-
2010-06-03soldstatus $21,000
-
2010-05-07historical
-
2009-08-28$21,000
-
2009-08-28$21,000
-
2007-12-21historical
-
2007-06-21$93,000
-
2007-06-01historical
-
2006-08-31$114,900
-
2004-12-20soldstatus $105,000
-
2004-11-02soldstatus $105,000
-
2004-09-02historical
-
2004-08-01$105,000
ⓘ Source: listings_history table (triggers on properties + properties_extension) + one-shot
backfill from property_details.listing_events for pre-trigger history.
Tax reassessment forecast NJ · Partial reset (capped growth)
- Current annual tax
- $3,022 · $252/mo
- Projected year-2 tax
- $3,814 · $318/mo
- Expected delta
- +$792/yr (+$66/mo · 26.2%)
ⓘ Screening estimate from a state-policy table — verify with the county assessor before closing.
Climate risk First Street
- Flood 4/10 Moderate FEMA zone X (unshaded) · 21% chance over 30 yrs
- Wildfire 1/10 Low
- Heat 6/10 Major 7 d/yr ≥102°F today · 15 d/yr by 30 yrs out
- Wind 6/10 Major 27% chance of damaging wind over 30 yrs
- Air quality 5/10 Major 6 unhealthy d/yr today · 8 by 30 yrs out
Nearby sold comps map
Loading sold comps map…
Walkable amenities ~0.75 mi
Loading nearby amenities…
Taxation est. · year 1
- Rental income
- $23,700
- − Mortgage interest
- −$10,363
- − Property taxes
- −$3,022
- − Insurance
- −$925
- − Repairs & maintenance
- −$1,896
- − Management
- −$1,896
- − Depreciation
- −$5,382
- Taxable income
- $217
- Est. tax owed @ 24.0%
- −$52
- After-tax cash flow
- $3,083/yr
For passive investors: Depreciation is non-cash, so a rental often shows a tax loss while cash-flowing — sheltering income. Rental losses are passive: they offset passive income freely, and up to $25,000/yr can offset ordinary (W-2) income if you actively participate and your MAGI is under $100k (phasing out to $0 by $150k); unused losses carry forward. On sale, claimed depreciation is recaptured at up to 25%, and gains may owe capital-gains tax (a 1031 exchange can defer both). Figures are a year-1 estimate at your 24.0% rate — not tax advice; consult a CPA.
Schools (NCES district)
- District
- Trenton Public School District
- NCES district ID
- 3416290
- Math proficiency
- 2% ▼ -8.00%
- Reading proficiency
- 16% ▼ -4.00%
- Median HH income
- $35,078
- Composite
- 7.31/100
- National rank
- #9956
- State rank
- #471 of 472 in NJ
Livability — Trenton
- Score
- 76/100
- State rank
- #133
- US rank
- #3533
Category grades
Schools grade is shown separately in the Schools card above.
Census & demographics
- Census place
- Trenton, NJ
- County
- Mercer County · 327,655 people
- City population
- 177,819
- Metro
- Trenton-Princeton, NJ
- Population (ZIP)
- 31,995
- Household income
- $56,788
- Rent vs Own
- Severe rent burden
- 2147.0
Population outlook (Mercer County) Hauer SSP2
- Today (2025)
- 381,395 people
- By 2030
- 384,640 · +0.9%
- By 2040
- 391,431 · +2.6%
- By 2050
- 397,845 · +4.3%
- By 2075
- 417,281 · +9.4%
- By 2100
- 420,327 · +10.2%
Race, ethnicity, and origin ACS 2023
- Neighborhood character
- Diverse neighborhood (Simpson 0.56)
- Race & ethnicity
- Hispanic / Latino 62% Black 20% Two or more races 18% White 14% Native American 4%
- Hispanic origin (detail)
- Mexican 2% Puerto Rican 12% Dominican 8%
- Common ancestry
- Romanian 2% Swiss 1% Hispanic 1%
- Foreign-born
- 37% · Canada, Jamaica, Guatemala
- Languages at home
- 41% English-only · Spanish 57% French/Haitian/Cajun 2%
Political lean MEDSL · Mercer
- 2024 margin
- Solid D (+33.9) · D 65.9% · R 32.0% · Other 2.1%
- 2008→2024 swing
- -2.2pp toward R · 2008: 36.1pp · 2024: 33.9pp
- All cycles
- 2024: D+33.9 2020: D+40.0 2016: D+36.2 2012: D+36.8 2008: D+36.1
Not yet ingested
- Civics
- —
Market trends
- HPI YoY
- ▼ -267.62%
- Current HPI
- 276.5427
- Rent YoY
- ▲ 4.71%
- Metro
- Trenton-Princeton, NJ
- State GDP YoY
- ▲ 2.05%
- F500 in state
- 34
Industry mix (Fortune 500 HQ in NJ)
| Industry | F500 HQs | Revenue |
|---|---|---|
| Consumer Goods | 3 | $31B |
|
||
| Pharmaceuticals | 2 | $153B |
|
||
| Technology | 2 | $21B |
|
||
| Insurance | 2 | $20B |
|
||
| Healthcare | 2 | $19B |
|
||
| Financial Services | 1 | $70B |
|
||
Price history
+89.5% since first listed21 events — show timeline
- 2026-04-19 Price Changed $199,000 BRIGHT MLS
- 2026-03-28 Listed $210,000 BRIGHT MLS
- 2025-10-17 Listing Removed — BRIGHT MLS
- 2025-06-30 Price Changed $229,000 BRIGHT MLS
- 2025-04-22 Price Changed $249,000 BRIGHT MLS
- 2025-04-20 Listed $429,000 BRIGHT MLS
- 2016-03-30 Listing Removed — BRIGHT MLS
- 2015-09-22 Listed $75,000 BRIGHT MLS
- 2010-06-03 Sold (MLS) $21,000 BRIGHT MLS
- 2010-06-03 Sold (MLS) $21,000 TREND
- 2010-05-07 Listing Removed — BRIGHT MLS
- 2009-08-28 Listed $21,000 BRIGHT MLS
- 2009-08-28 Listed $21,000 TREND
- 2007-12-21 Listing Removed — BRIGHT MLS
- 2007-06-21 Listed $93,000 BRIGHT MLS
- 2007-06-01 Listing Removed — BRIGHT MLS
- 2006-08-31 Listed $114,900 BRIGHT MLS
- 2004-12-20 Sold (Public Records) $105,000 Public Records
- 2004-11-02 Sold (MLS) $105,000 BRIGHT MLS
- 2004-09-02 Listing Removed — BRIGHT MLS
- 2004-08-01 Listed $105,000 BRIGHT MLS
Property tax history
-1.5%/yrLatest (2025): $3,022 · +1.5% YoY. Source: county tax records.
Cash-flow waterfall
monthlySold comps — $/sqft
last 12 mo · ≤1 miLoading sold comps…