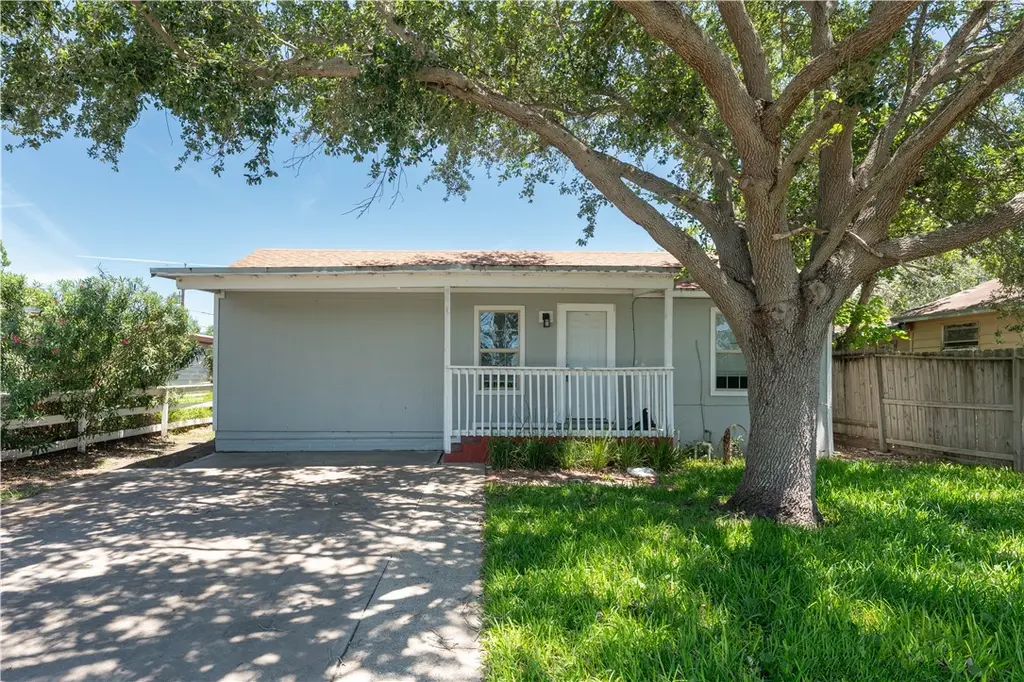
1217 Baywood Ln · Corpus Christi, TX
Flood risk 1/10 · Minimal
- FEMA flood zone
- X (unshaded)
- Chance of flooding over 30 yrs
- 0.0%
- Est. flood insurance / yr
- $507 – $1,088
Fire risk 1/10 · Minimal
- Est. fire insurance / yr
- $1,222 – $2,270
Heat risk 10/10 · Severe
- Hot days now (above 108°F)
- 7 days/yr
- Hot days in 30 yrs
- 27 days/yr
Wind risk 9/10 · Severe
- Chance of severe wind over 30 yrs
- 99.0%
Air-quality risk 1/10 · Minimal
- Unhealthy air days now
- 0 days/yr
- Unhealthy air days in 30 yrs
- 0 days/yr
Risk factors via First Street. Map © Google.
Why this score? — see what drove the B- grade
The composite is a weighted blend of 9 inputs, each scored 0–100. Each bar is that input's sub-score; the figure is the points it added to the 100-point composite (weight × sub-score).
- Cash flow +25.3/30.0
- ARV discount +15.0/15.0
- DSCR +8.4/10.0
- 1% rule +7.2/10.0
- Schools +4.1/10.0
- Livability +3.9/5.0
- Condition / age +2.5/5.0
- Rent growth +2.4/5.0
- Appreciation +0.0/10.0
$159,900
🖨 Deal sheet 📄 Offer letter ✓ Due diligence
Listing remarks
This property offers 4 bedrooms/ 2 bathrooms and a big side back yard. Split arrangement. Property being sold as is!! No survey available and not inspections has been done.
Key facts
- 6,752 sq ft lot
- 2 parking spots
- Built 1974
Property features AI
Exterior
- Parking: Front-entry parking; 2 parking spaces
- Utilities: Public water; Public sewer; Sewer available; Water available
- Home design: Single-story home; Faces west; Entry at front
- Construction: Frame construction; Shingle roof; Pillar/post/pier foundation; Built with wood framing
- Exterior features: Covered deck; Deck; Wood fencing; Interior lot
Interior
- Kitchen: Electric oven; Electric range; Refrigerator
- Bedrooms: Bedrooms located on the main level
- Flooring: Carpet; Hardwood; Tile
- Bathrooms: 2 full bathrooms
- Heating & cooling: Central heating (electric); Central air conditioning
- Interior features: Split bedroom layout; Cable TV
- Laundry & utility: Washer included; Dryer hookup
Neighborhood map
What this means for you Summary
Snapshot
- This is a 4-bed/2.0-bath single-family listed at $160k.
Deal economics
- At list price, monthly cash flow is $365 ($4k/yr) — positive.
- The deal already cash-flows at list — no discount required.
- Meets the 1% rule at list price ($2k rent vs $160k).
- Recommended offer: $155k (3.0% below list) — sets the bar for market timing.
- Cap rate 9.0% vs local median 3.6% in Corpus Christi — top-decile yield for the area; either an underpriced asset or a hidden risk that comps aren't pricing in. Stress-test before assuming the spread holds.
Location & tenants
- Location reads 78/100 on livability (#66 in TX, #2,404 nationally) — a middle-class / working-renter tenant base. Strengths: commute A+, cost of living A+, housing A+; Watch: crime F.
- Flour Bluff ISD (urban): math 43% / reading 51% proficiency, ranked #209 of 826 in TX (top 25%) — families likely to look elsewhere, expect single-tenant / working-renter base with shorter leases.
- Market conditions: Rents soft (-0.6%/yr); 685 active listings in the ZIP; 6 comparable units currently listed for rent nearby; rentals lingering (median 44d on market — plan ~5-8 weeks vacancy on turnover, expect pricing pressure); 83% of comp listings sitting > 30 days — soft ceiling on asking rent; solid renter incomes; 1,397 units permitted in Nueces County in 2024 (47 in 5+ unit buildings).
Forward outlook
- Local home prices are declining (-3.0%/yr); year-one equity from $1k of loan paydown is wiped out by about $5k of value loss. Plan a longer hold.
- Nueces County population projected at +36% by 2050 — long-run rental-demand tailwind backs the buy-and-hold thesis.
Negotiation context
- It's been on market 33 days — a 3% lower offer ($155k) is reasonable based on typical stale-listing flexibility.
- 4 sale attempts; this cycle's ask is 3% above the opening price — seller raised mid-cycle; expect resistance to lowballs.
- Current owner paid $46k; list at $160k implies a 248% gain — meaningful room to come down on a strong offer.
Risks & watch-outs
- Climate carrying-cost: severe wind risk, 99% chance of damaging wind over 30y; extreme-heat days projected 7→27/yr by 2055 (HVAC capex compounding) — expect insurance premiums to compound above CPI over the hold.
Questions for the listing agent
- It's been on market 33 days. Have you received any prior offers? Is the seller open to a 3% concession, seller financing, or rate buy-down credit?
- Built in 1974 — when were the roof, HVAC, electrical panel, plumbing, and water heater last replaced?
- Is there a deadline driving the sale (1031 exchange, divorce, estate, relocation)? That informs how much negotiation room exists.
- Crime grade is F in this area — have there been break-ins, vandalism, or insurance claims at this property in the last 3 years? What carrier currently insures it and at what premium?
- What's the average days-on-market for RENTAL listings here right now (not sales)? A rising rental-DOM trend means longer vacancies and softer asking-rent achievability than the comps imply.
- What's the recent tenant-quality profile in this submarket — average credit score on applications, eviction rate, late-payment / NSF rate, and stable-employment percentage? A property-management company in the area should have these aggregated.
- How much new for-sale + rental construction is in the pipeline within 1–3 miles? Heavy new supply typically softens prices + rents 12–24 months out; constrained supply supports both.
Investment metrics
- 1% rule
- 1.22% ✓
- Cap rate
- 9.03%
- Cash-on-cash
- 9.78%
- DSCR
- 1.44
- GRM
- 6.8
CMA / ARV
- ARV (on-the-fly)
- $223,944
- Comps found
- 12
Show comp detail 12 sales within ~0.75 mi
| Address | Dist | Beds/Ba | Sqft | Sold | Price | $/sf | Match |
|---|---|---|---|---|---|---|---|
| 1508 Marine Dr | 0.45mi | 3/2.0 (-1) | 1,294 (-1%) | 10mo | $239,000 | $185 | 64 |
| 9574 Goldfinch | 0.60mi | 3/2.0 (-1) | 1,279 (-2%) | 4mo | $219,900 | $172 | 61 |
| 1233 Preston St | 0.08mi | 3/2.0 (-1) | 1,134 (-13%) | 12mo | $179,900 | $159 | 60 |
| 1130 Jonnell St | 0.23mi | 3/2.0 (-1) | 1,180 (-9%) | 11mo | $180,000 | $153 | 59 |
| 9530 Blue Jay St | 0.57mi | 3/2.0 (-1) | 1,409 (+8%) | 8mo | $229,000 | $163 | 48 |
| 913 Knot | 0.51mi | 3/2.0 (-1) | 1,449 (+11%) | 6mo | $229,000 | $158 | 47 |
| 9510 Blue Jay St | 0.62mi | 3/2.0 (-1) | 1,363 (+5%) | 15mo | $234,900 | $172 | 46 |
| 714 Military Dr | 0.73mi | 3/2.0 (-1) | 1,241 (-5%) | 9mo | $239,000 | $193 | 46 |
| 9574 Blue Jay St | 0.49mi | 4/2.0 | 1,477 (+13%) | 13mo | $265,000 | $179 | 44 |
| 918 Crossbill St | 0.57mi | 3/2.0 (-1) | 1,476 (+13%) | 4mo | $230,000 | $156 | 43 |
| 9491 Quetzal St | 0.47mi | 3/2.0 (-1) | 1,454 (+12%) | 13mo | $135,000 | $93 | 43 |
| 702 Military Dr | 0.74mi | 4/2.0 | 1,434 (+10%) | 12mo | $259,000 | $181 | 38 |
Match score weights: distance 35% · size 25% · config 20% · recency 20%. Top-matched comps best support the ARV.
Projected returns pro-forma
-3.0% appreciation · 0.0% rent growth · sell at horizon
- IRR
- -5.2%
- Equity multiple
- 0.81×
- Total profit
- $-8,327
- Equity at exit
- $23,842
- IRR
- 0.3%
- Equity multiple
- 1.02×
- Total profit
- $828
- Equity at exit
- $13,825
Cash invested: $44,772 (down + closing). Projections, not guarantees.
Landlord ↔ Tenant lean methodology
- Overall (STATE)
- 87 Strongly Landlord-Friendly
- State Texas
- 87 Strongly Landlord-Friendly · R+5
- County
- — inherits STATE
- City
- — inherits STATE
ZIP-level market 78418
- Rents YoY
- -0.6%
- Active inventory
- 685
- Price-to-rent
- 6.8×
Monthly cashflow live
- Estimated rent
- $1,956 high interval (Pro) →
- Mortgage (P&I)
- −$839
- Tax from tax record
- −$275 /mo · $3,305/yr
- Insurance
- −$67
- HOA
- −$0
- Vacancy / Maint / Mgmt
- −$411
- Net cashflow
- $365
Break-even live
UW: 25.0% down · 7.5% · 30yr · 1.5% tax · 5.0% vac · 8.0% maint · 8.0% mgmt
Financing live
Cash to close
- Down payment
- $39,975
- Closing costs
- $4,797
- Reserves months
- —
- Total cash needed
- —
Loan-product check · same deal, 3 products live
Conventional
25% down · 7.5% · 30yr
- Down + closing
- —
- Monthly P&I
- —
- Monthly cashflow
- —
- DSCR
- —
- Eligible?
- —
Personal DTI + credit; lowest rate.
DSCR
20% down · 8.5% · 30yr
- Down + closing
- —
- Monthly P&I
- —
- Monthly cashflow
- —
- DSCR
- —
- Eligible?
- —
No personal income docs; deal must DSCR.
Hard money
10% down · 12.0% · 12mo
- Down + closing
- —
- Monthly P&I
- —
- Monthly cashflow
- —
- DSCR
- —
- Eligible?
- —
Short-term bridge; refi at stabilization.
Rent comps 6 comps
| Address | Beds | Baths | Sqft | Rent | $/sqft | DOM | Units | Dist |
|---|---|---|---|---|---|---|---|---|
| 1217 Baywood Ln Corpus Christi, TX | 4.0 | 2.0 | 1302 | $1,500 | $1.15 | 44d | 1 | 0.03mi |
| 1401 Dewitt St Corpus Christi, TX | 3.0 | 2.0 | 1168 | $1,495 | $1.28 | 43d | 1 | 0.44mi |
| 1942 Sunnycrest St Corpus Christi, TX | 3.0 | 2.0 | 1047 | $1,650 | $1.58 | 43d | 1 | 0.96mi |
| 2310 Vialoux Dr Corpus Christi, TX | 3.0 | 2.0 | 1240 | $1,950 | $1.57 | 43d | 1 | 1.37mi |
| 2301 Sky Crest Dr Corpus Christi, TX | 3.0 | 2.0 | 1597 | $2,200 | $1.38 | 13d | 1 | 1.39mi |
| 2255 Lombardy Dr Corpus Christi, TX | 3.0 | 2.0 | 1574 | $1,750 | $1.11 | 43d | 1 | 1.44mi |
Listing history 25 events
-
2026-06-18days on market $159,900 Active 33 DOM
-
2026-06-17days on market $159,900 Active 32 DOM
-
2026-06-16days on market $159,900 Active 31 DOM
-
2026-06-15days on market $159,900 Active 30 DOM
-
2026-06-14days on market $159,900 Active 28 DOM
-
2026-06-13days on market $159,900 Active 27 DOM
-
2026-06-10days on market $159,900 Active 25 DOM
-
2026-06-09days on market $159,900 Active 24 DOM
-
2026-06-08days on market $159,900 Active 23 DOM
-
2026-06-07days on market $159,900 Active 22 DOM
-
2026-06-03days on market $159,900 Active 18 DOM
-
2026-06-02days on market $159,900 Active 17 DOM
-
2026-06-01days on market $159,900 Active 16 DOM
-
2026-05-31days on market $159,900 Active 15 DOM
-
2026-05-30days on market $159,900 Active 14 DOM
-
2026-05-19price $159,900
-
2026-05-16$154,900 Active
-
2026-05-12historical $1,400
-
2026-05-01$1,500
-
2025-03-05historical $1,500
-
2025-01-29$1,500
-
2025-01-24historical $1,500
-
2025-01-10$1,500
-
2018-12-14soldstatus
-
2001-12-10soldstatus $45,900
ⓘ Source: listings_history table (triggers on properties + properties_extension) + one-shot
backfill from property_details.listing_events for pre-trigger history.
Tax reassessment forecast TX · Resets to sale price
- Current annual tax
- $3,305 · $275/mo
- Projected year-2 tax
- $3,305 · $275/mo
- Expected delta
- $0/yr ($0/mo · 0.0%)
ⓘ Screening estimate from a state-policy table — verify with the county assessor before closing.
Climate risk First Street
- Flood 1/10 Low FEMA zone X (unshaded) · 0% chance over 30 yrs
- Wildfire 1/10 Low
- Heat 10/10 Extreme 7 d/yr ≥108°F today · 27 d/yr by 30 yrs out
- Wind 9/10 Extreme 99% chance of damaging wind over 30 yrs
- Air quality 1/10 Low 0 unhealthy d/yr today · 0 by 30 yrs out
Nearby sold comps map
Loading sold comps map…
Walkable amenities ~0.75 mi
Loading nearby amenities…
Taxation est. · year 1
- Rental income
- $23,475
- − Mortgage interest
- −$8,957
- − Property taxes
- −$3,305
- − Insurance
- −$800
- − Repairs & maintenance
- −$1,878
- − Management
- −$1,878
- − Depreciation
- −$4,652
- Taxable income
- $2,006
- Est. tax owed @ 24.0%
- −$482
- After-tax cash flow
- $3,897/yr
For passive investors: Depreciation is non-cash, so a rental often shows a tax loss while cash-flowing — sheltering income. Rental losses are passive: they offset passive income freely, and up to $25,000/yr can offset ordinary (W-2) income if you actively participate and your MAGI is under $100k (phasing out to $0 by $150k); unused losses carry forward. On sale, claimed depreciation is recaptured at up to 25%, and gains may owe capital-gains tax (a 1031 exchange can defer both). Figures are a year-1 estimate at your 24.0% rate — not tax advice; consult a CPA.
Schools (NCES district)
- District
- Flour Bluff ISD
- NCES district ID
- 4819380
- Math proficiency
- 43% ▼ -12.00%
- Reading proficiency
- 51% ▼ -2.00%
- Median HH income
- $57,162
- Composite
- 40.96/100
- National rank
- #3604
- State rank
- #209 of 826 in TX
Livability — Corpus Christi
- Score
- 78/100
- State rank
- #66
- US rank
- #2404
Category grades
Schools grade is shown separately in the Schools card above.
Census & demographics
- Census place
- Corpus Christi, TX
- County
- Nueces County · 296,836 people
- City population
- 296,836
- Metro
- Corpus Christi, TX
- Population (ZIP)
- 29,790
- Household income
- $92,445
- Rent vs Own
- Severe rent burden
- 808.0
Population outlook (Nueces County) Hauer SSP2
- Today (2025)
- 418,037 people
- By 2030
- 447,123 · +7.0%
- By 2040
- 505,911 · +21.0%
- By 2050
- 567,522 · +35.8%
- By 2075
- 729,686 · +74.6%
- By 2100
- 847,087 · +102.6%
Race, ethnicity, and origin ACS 2023
- Neighborhood character
- Majority White (61%)
- Race & ethnicity
- White 61% Hispanic / Latino 29% Two or more races 19% Asian 3% Black 3%
- Hispanic origin (detail)
- Mexican 25%
- Common ancestry
- Romanian 2% Lithuanian 2% Slovak 2%
- Foreign-born
- 7% · Canada, China
- Languages at home
- 83% English-only · Spanish 14% Tagalog/Filipino 2%
Political lean MEDSL · Nueces
- 2024 margin
- R (+11.5) · D 43.8% · R 55.3%
- 2008→2024 swing
- -7.1pp toward R · 2008: -4.4pp · 2024: -11.5pp
- All cycles
- 2024: R+11.5 2020: R+2.9 2016: R+1.5 2012: R+3.2 2008: R+4.4
Not yet ingested
- Civics
- —
Market trends
- HPI YoY
- ▼ -168.81%
- Current HPI
- 193.902
- Rent YoY
- ▼ -0.57%
- Metro
- Corpus Christi, TX
- State GDP YoY
- ▲ 3.95%
- F500 in state
- 110
Industry mix (Fortune 500 HQ in TX)
| Industry | F500 HQs | Revenue |
|---|---|---|
| Energy | 16 | $1,198B |
|
||
| Technology | 5 | $198B |
|
||
| Engineering / Construction | 4 | $72B |
|
||
| Energy Services | 3 | $60B |
|
||
| Utilities | 3 | $41B |
|
||
| Healthcare | 2 | $330B |
|
||
Price history
+248.4% since first listed10 events — show timeline
- 2026-05-19 Price Changed $159,900 CBMLS
- 2026-05-16 Listed $154,900 CBMLS
- 2026-05-12 Rental Removed $1,400 CBMLS
- 2026-05-01 Listed for Rent $1,500 CBMLS
- 2025-03-05 Rental Removed $1,500 CBMLS
- 2025-01-29 Listed for Rent $1,500 CBMLS
- 2025-01-24 Rental Removed $1,500 CBMLS
- 2025-01-10 Listed for Rent $1,500 CBMLS
- 2018-12-14 Sold (Public Records) — Public Records
- 2001-12-10 Sold (Public Records) $45,900 Public Records
Property tax history
+8.8%/yrLatest (2025): $3,305 · +17.8% YoY. Source: county tax records.
Cash-flow waterfall
monthlySold comps — $/sqft
last 12 mo · ≤1 miLoading sold comps…