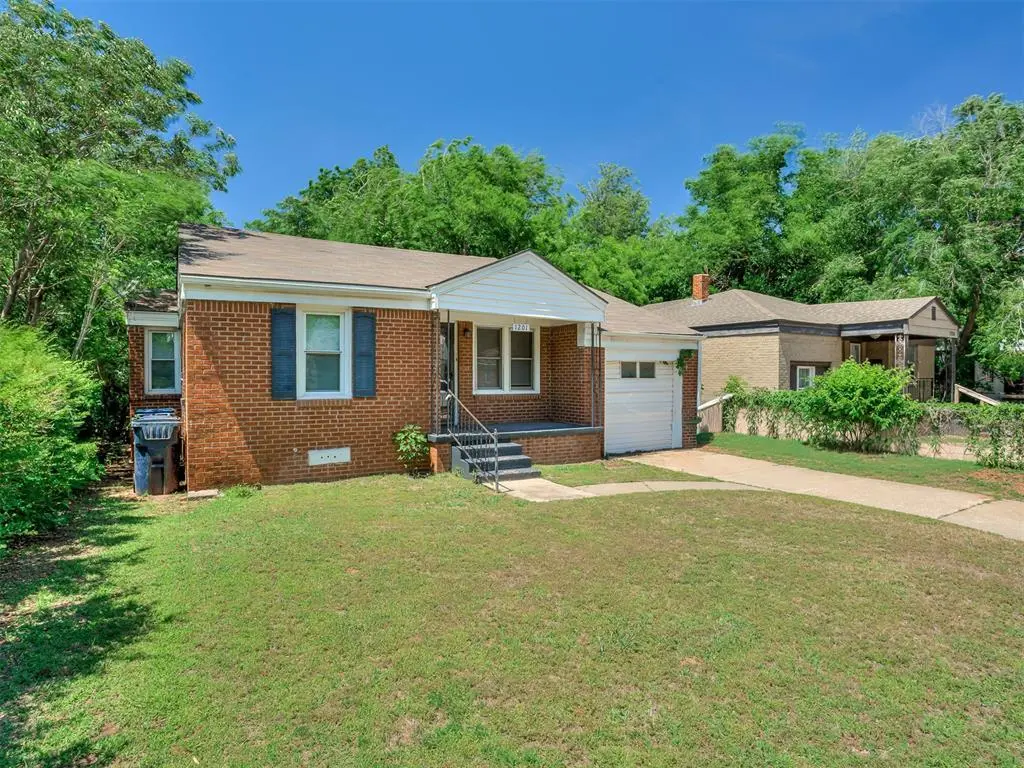
1201 Carverdale Dr · Oklahoma City, OK
Flood risk 6/10 · Moderate
- FEMA flood zone
- X (shaded)
- Chance of flooding over 30 yrs
- 0.66%
- Est. flood insurance / yr
- $507 – $1,088
Fire risk 1/10 · Minimal
- Est. fire insurance / yr
- $2,463 – $4,575
Heat risk 6/10 · Moderate
- Hot days now (above 107°F)
- 7 days/yr
- Hot days in 30 yrs
- 19 days/yr
Wind risk 3/10 · Minor
- Chance of severe wind over 30 yrs
- 4.0%
Air-quality risk 2/10 · Minimal
- Unhealthy air days now
- 1 days/yr
- Unhealthy air days in 30 yrs
- 2 days/yr
Risk factors via First Street. Map © Google.
Why this score? — see what drove the D grade
The composite is a weighted blend of 9 inputs, each scored 0–100. Each bar is that input's sub-score; the figure is the points it added to the 100-point composite (weight × sub-score).
- Cash flow +17.8/30.0
- Appreciation +6.2/10.0
- DSCR +5.6/10.0
- 1% rule +4.1/10.0
- Livability +4.0/5.0
- Rent growth +2.5/5.0
- Condition / age +2.5/5.0
- Schools +0.7/10.0
- ARV discount +0.0/15.0
$119,900
🖨 Deal sheet 📄 Offer letter ✓ Due diligence
Listing remarks
Discover the perfect blend of charm and convenience in this beautifully refinished 3-bedroom, 1-bath home located less than 10 minutes from downtown. Step inside to find a refreshed interior featuring updated finishes and inviting living spaces designed for comfort and functionality. The garage has been converted into an extra bonus space and the there is a brand new sewer line! Enjoy relaxing mornings on the covered front porch or entertain guests year-round under the spacious covered patio. Whether you're a first-time buyer, downsizing, or looking for an investment opportunity, this home offers timeless appeal in a prime location close to shopping, dining, and city amenities. Owner of thi
Key facts
- Covered front porch
- Updated finishes
- Refreshed interior
Tags
Property features AI
Finance
- Other: Owner is an associate of the listing brokerage; Property is not occupied; Living area reported as 973 (per appraisal)
- Financial info: Listing accepts Cash, Conventional, and Special Funding; Assumable loan status: Unknown; Loan qualification: Unknown
- HOA & community: No mandatory association dues
Exterior
- Parking: Concrete parking
- Utilities: Manual geocode (location verified); Directions: Heading west on NW 10th St, turn right on Carverdale Dr; property is on the left
- Home design: Single-family residence; One level; Existing property
- Construction: Brick and frame construction with masonry veneer; Composition roof; Conventional foundation; Built prior to current listing
- Exterior features: Covered patio; Covered porch; Rain gutters; Interior lot
Interior
- Bedrooms: 3 bedrooms
- Bathrooms: 1 full bathroom
- Interior features: Ceiling fan(s); No fireplace; One living area
Neighborhood map
What this means for you Summary
Snapshot
- This is a 2-bed/1.0-bath single-family listed at $120k.
Deal economics
- At list price, monthly cash flow is $100 ($1k/yr) — positive.
- The deal already cash-flows at list — no discount required.
- To meet the 1% rule (rent ≥ 1% of price), the offer needs to be $109k (9.4% below list).
- Recommended offer: $109k (9.4% below list) — sets the bar for 1% rule.
- Cap rate 7.3% vs local median 3.7% in Oklahoma City — top-decile yield for the area; either an underpriced asset or a hidden risk that comps aren't pricing in. Stress-test before assuming the spread holds.
Location & tenants
- Location reads 80/100 on livability (#3 in OK, #1,635 nationally) — a professional / high-income tenant draw. Strengths: amenities A+, commute A+, cost of living A+; Watch: crime F.
- Oklahoma City (urban): math 7% / reading 10% proficiency, ranked #254 of 270 in OK (top 94%) — low school quality limits family demand, transient renter base, plan for 1-2y turnover; 82% free/reduced lunch — lower-income household profile, screen leases tightly.
- Zoned schools: Thelma R. Parks Es (math 2% / reading 2%, grade F, #802 of 845 statewide, top 100%, 472 students, 0% FRL); Douglass Hs (math 2% / reading 2%, grade F, #445 of 447 statewide, top 100%, 556 students, 0% FRL) — zoned schools average 0% FRL vs 82% district-wide (82 pts lower); this property's tenant base skews higher-income than the district average.
- Market conditions: 75 active listings in the ZIP; 40 comparable units currently listed for rent nearby; rentals lingering (median 44d on market — plan ~5-8 weeks vacancy on turnover, expect pricing pressure); 50% of comp listings sitting > 30 days — soft ceiling on asking rent; lower-income renter base — watch delinquency; 5,365 units permitted in Oklahoma County in 2024 (569 in 5+ unit buildings).
Forward outlook
- In year one you build about $4k of equity ($829 loan paydown + $3k appreciation (2.4% local appreciation)).
- Oklahoma County population projected at +41% by 2050 — long-run rental-demand tailwind backs the buy-and-hold thesis.
- At projected returns (2.4% appreciation + 3.0% rent growth), your $34k cash investment doubles in ~6 years — after that, you're playing with house money.
- By year 9, paydown + projected appreciation supports a ~$32k cash-out refi (75% LTV) — recoverable capital for the next deal without selling this one.
Negotiation context
- It's been on market 31 days — a 3% lower offer ($116k) is reasonable based on typical stale-listing flexibility.
- 4 sale attempts since 2y ago with the ask held roughly flat each time — persistent listings suggest the price (not the market) is what's stuck; bring a comps-based counter.
Risks & watch-outs
- Watch-outs: built in 1946 — expect roof / HVAC / electrical / plumbing capex.
- Climate carrying-cost: major flood risk; extreme-heat days projected 7→19/yr by 2055 (HVAC capex compounding) — expect insurance premiums to compound above CPI over the hold.
Questions for the listing agent
- It's been on market 31 days. Have you received any prior offers? Is the seller open to a 9% concession, seller financing, or rate buy-down credit?
- Built in 1946 — when were the roof, HVAC, electrical panel, plumbing, and water heater last replaced?
- Is there a deadline driving the sale (1031 exchange, divorce, estate, relocation)? That informs how much negotiation room exists.
- Schools are F-rated, which usually means shorter tenancies and higher turnover. Who's the typical renter profile here, and what's been the actual vacancy rate?
- Crime grade is F in this area — have there been break-ins, vandalism, or insurance claims at this property in the last 3 years? What carrier currently insures it and at what premium?
- The area grade is low — what's the realistic commute time and amenity access for the typical tenant pool here? Any planned neighborhood developments (good or bad) we should know about?
- What's the average days-on-market for RENTAL listings here right now (not sales)? A rising rental-DOM trend means longer vacancies and softer asking-rent achievability than the comps imply.
- What's the recent tenant-quality profile in this submarket — average credit score on applications, eviction rate, late-payment / NSF rate, and stable-employment percentage? A property-management company in the area should have these aggregated.
- How much new for-sale + rental construction is in the pipeline within 1–3 miles? Heavy new supply typically softens prices + rents 12–24 months out; constrained supply supports both.
Investment metrics
- 1% rule
- 0.91% ✗
- Cap rate
- 7.29%
- Cash-on-cash
- 3.56%
- DSCR
- 1.16
- GRM
- 9.2
CMA / ARV
- ARV (on-the-fly)
- $87,875
- Comps found
- 12
Show comp detail 12 sales within ~0.75 mi
| Address | Dist | Beds/Ba | Sqft | Sold | Price | $/sf | Match |
|---|---|---|---|---|---|---|---|
| 2525 NE 14th St | 0.32mi | 2/1.0 | 895 (-3%) | 4mo | $60,000 | $67 | 76 |
| 1701 N Fairmont Ave | 0.37mi | 2/1.0 | 927 (+0%) | 8mo | $73,000 | $79 | 76 |
| 2509 NE 13th St | 0.25mi | 3/1.5 (+1) | 980 (+6%) | 1mo | $155,000 | $158 | 71 |
| 1720 Wickliff St | 0.70mi | 2/1.5 | 902 (-2%) | 0mo | $100,000 | $111 | 61 |
| 1157 E Bellevidere Dr | 0.08mi | 3/2.0 (+1) | 1,037 (+12%) | 7mo | $75,000 | $72 | 61 |
| 2041 NE 18th St | 0.55mi | 2/1.0 | 848 (-8%) | 1mo | $109,000 | $129 | 60 |
| 1504 N Magnolia St | 0.58mi | 2/1.5 | 995 (+8%) | 5mo | $43,250 | $43 | 54 |
| 1908 NE Grand Blvd | 0.59mi | 3/1.0 (+1) | 998 (+8%) | 6mo | $85,000 | $85 | 49 |
| 1716 N Highland Dr | 0.43mi | 3/1.0 (+1) | 1,040 (+12%) | 7mo | $145,000 | $139 | 49 |
| 1004 N Bryant Ave | 0.67mi | 3/1.0 (+1) | 850 (-8%) | 3mo | $145,000 | $171 | 48 |
| 2021 N Page Ave | 0.61mi | 3/1.0 (+1) | 1,005 (+9%) | 7mo | $95,000 | $95 | 46 |
| 2032 NE Grand Blvd | 0.70mi | 2/1.0 | 1,040 (+12%) | 2mo | $45,000 | $43 | 45 |
Match score weights: distance 35% · size 25% · config 20% · recency 20%. Top-matched comps best support the ARV.
Projected returns pro-forma
2.42% appreciation · 3.0% rent growth · sell at horizon
- IRR
- 9.2%
- Equity multiple
- 1.51×
- Total profit
- $17,106
- Equity at exit
- $50,016
- IRR
- 12.0%
- Equity multiple
- 2.69×
- Total profit
- $56,641
- Equity at exit
- $74,177
Cash invested: $33,572 (down + closing). Projections, not guarantees.
Landlord ↔ Tenant lean methodology
- Overall (STATE)
- 83 Strongly Landlord-Friendly
- State Oklahoma
- 83 Strongly Landlord-Friendly · R+20
- County
- — inherits STATE
- City
- — inherits STATE
ZIP-level market 73117
- Home prices YoY
- 1.3%
- Active inventory
- 75
- Price-to-rent
- 9.2×
Monthly cashflow live
- Estimated rent
- $1,086 high interval (Pro) →
- Mortgage (P&I)
- −$629
- Tax from tax record
- −$79 /mo · $951/yr
- Insurance
- −$50
- HOA
- −$0
- Vacancy / Maint / Mgmt
- −$228
- Net cashflow
- $100
Break-even live
UW: 25.0% down · 7.5% · 30yr · 1.5% tax · 5.0% vac · 8.0% maint · 8.0% mgmt
Financing live
Cash to close
- Down payment
- $29,975
- Closing costs
- $3,597
- Reserves months
- —
- Total cash needed
- —
Loan-product check · same deal, 3 products live
Conventional
25% down · 7.5% · 30yr
- Down + closing
- —
- Monthly P&I
- —
- Monthly cashflow
- —
- DSCR
- —
- Eligible?
- —
Personal DTI + credit; lowest rate.
DSCR
20% down · 8.5% · 30yr
- Down + closing
- —
- Monthly P&I
- —
- Monthly cashflow
- —
- DSCR
- —
- Eligible?
- —
No personal income docs; deal must DSCR.
Hard money
10% down · 12.0% · 12mo
- Down + closing
- —
- Monthly P&I
- —
- Monthly cashflow
- —
- DSCR
- —
- Eligible?
- —
Short-term bridge; refi at stabilization.
Rent comps 40 comps
| Address | Beds | Baths | Sqft | Rent | $/sqft | DOM | Units | Dist |
|---|---|---|---|---|---|---|---|---|
| 1321 Bellevidere Dr Oklahoma City, OK | 3.0 | 2.0 | 1000 | $1,200 | $1.20 | 23d | 1 | 0.17mi |
| 2520 NE 14th St Oklahoma City, OK | 3.0 | 1.0 | 1070 | $1,099 | $1.03 | 43d | 1 | 0.28mi |
| 2501 NE 16th St Oklahoma City, OK | 2.0 | 1.0 | 941 | $1,100 | $1.17 | 43d | 1 | 0.39mi |
| 1709 N Page Ave Oklahoma City, OK | 2.0 | 1.0 | 967 | $895 | $0.93 | 23d | 1 | 0.39mi |
| 1801 E Park Pl Oklahoma City, OK | 2.0 | 1.0 | 734 | $695 | $0.95 | 43d | 1 | 0.53mi |
| 2132 NE 19th St Oklahoma City, OK | 2.0 | 1.0 | 850 | $950 | $1.12 | 43d | 1 | 0.56mi |
| 2620 NE 19th St Oklahoma City, OK | 2.0 | 1.0 | 900 | $995 | $1.11 | 43d | 1 | 0.61mi |
| 2200 Hardin Dr Oklahoma City, OK | 3.0 | 1.0 | 1091 | $1,025 | $0.94 | 43d | 1 | 0.65mi |
| 2132 Miramar Blvd Oklahoma City, OK | 2.0 | 1.0 | 768 | $800 | $1.04 | 2d | 1 | 0.67mi |
| 2036 NE Grand Blvd Oklahoma City, OK | 2.0 | 1.0 | 1092 | $995 | $0.91 | 2d | 1 | 0.69mi |
| 2107 Hardin Dr Oklahoma City, OK | 3.0 | 1.0 | 999 | $875 | $0.88 | 43d | 1 | 0.71mi |
| 3049 NE 15th St Oklahoma City, OK | 2.0 | 1.0 | 660 | $895 | $1.36 | 2d | 1 | 0.80mi |
| 2300 Granada Blvd Oklahoma City, OK | 3.0 | 1.0 | 999 | $1,000 | $1.00 | 11d | 1 | 0.82mi |
| 1727 NE 19th St Oklahoma City, OK | 3.0 | 1.0 | 892 | $995 | $1.12 | 43d | 1 | 0.82mi |
| 1801 N Jordan Ave Oklahoma City, OK | 2.0 | 1.0 | 1080 | $1,000 | $0.93 | 14d | 1 | 0.84mi |
| 2112 NE 23rd St Oklahoma City, OK | 3.0 | 1.0 | 1117 | $1,070 | $0.96 | 17d | 1 | 0.84mi |
| 1722 NE 20th St Oklahoma City, OK | 2.0 | 1.0 | 800 | $1,070 | $1.34 | 43d | 1 | 0.86mi |
| 1609 NE 18th St Oklahoma City, OK | 2.0 | 1.0 | 899 | $900 | $1.00 | 4d | 1 | 0.87mi |
| 1445 NE 10th St Oklahoma City, OK | 2.0 | 1.0 | 1011 | $1,195 | $1.18 | 17d | 1 | 0.90mi |
| 1450 NE 16th Ter Oklahoma City, OK | 3.0 | 1.0 | 1096 | $1,295 | $1.18 | 43d | 1 | 0.94mi |
| 3212 NE 15th St Oklahoma City, OK | 3.0 | 1.0 | 825 | $965 | $1.17 | 10d | 1 | 0.96mi |
| 1436 NE 8th St Oklahoma City, OK | 2.0 | 1.0 | 1048 | $1,095 | $1.04 | 43d | 1 | 0.97mi |
| 3333 NE 12th St Oklahoma City, OK | 2.0 | 1.0 | 720 | $1,000 | $1.39 | 43d | 1 | 1.03mi |
| 3317 NE 15th St Oklahoma City, OK | 3.0 | 1.0 | 816 | $1,395 | $1.71 | 43d | 1 | 1.08mi |
| 1148 N Lottie Ave Oklahoma City, OK | 2.0 | 1.0 | 1040 | $1,150 | $1.11 | 3d | 1 | 1.09mi |
| 1330 NE 7th St Unit A Oklahoma City, OK | 1.0 | 1.0 | 534 | $900 | $1.69 | 43d | 1 | 1.11mi |
| 1812 NE 24th St Oklahoma City, OK | 3.0 | 1.0 | 1071 | $1,175 | $1.10 | 2d | 1 | 1.12mi |
| 1931 NE 25th St Unit 10 Oklahoma City, OK | 2.0 | 1.0 | 900 | $875 | $0.97 | 23d | 1 | 1.12mi |
| 1904 NE 25th St Oklahoma City, OK | 2.0 | 1.0 | 939 | $950 | $1.01 | 4d | 1 | 1.12mi |
| 1921 NE 25th St Unit 3 Oklahoma City, OK | 2.0 | 1.0 | 900 | $875 | $0.97 | 20d | 1 | 1.13mi |
| 1220 NE 17th St Oklahoma City, OK | 2.0 | 1.0 | 1100 | $1,195 | $1.09 | 43d | 1 | 1.21mi |
| 1401 NE 22nd St Oklahoma City, OK | 2.0 | 1.0 | 728 | $1,100 | $1.51 | 23d | 1 | 1.25mi |
| 1200 NE 17th St Unit B Oklahoma City, OK | 2.0 | 1.0 | 1002 | $2,100 | $2.10 | 43d | 1 | 1.26mi |
| 1439 NE 24th St Oklahoma City, OK | 3.0 | 1.0 | 874 | $1,025 | $1.17 | 16d | 1 | 1.26mi |
| 2020 NE 30th St Oklahoma City, OK | 3.0 | 1.0 | 1056 | $1,150 | $1.09 | 43d | 1 | 1.36mi |
| 403 Tinker Diagonal St Oklahoma City, OK | 2.0 | 1.0 | 970 | $850 | $0.88 | 23d | 1 | 1.39mi |
| 2312 N Everest Ave Oklahoma City, OK | 3.0 | 1.0 | 1100 | $1,299 | $1.18 | 43d | 1 | 1.40mi |
| 2128 N Stonewall Ave Unit 1 Oklahoma City, OK | 2.0 | 1.0 | 960 | $800 | $0.83 | 3d | 1 | 1.43mi |
| 935 NE 16th St Oklahoma City, OK | 1.0 | 1.0 | 727 | $795 | $1.09 | 43d | 1 | 1.45mi |
| 1438 NE 27th St Oklahoma City, OK | 3.0 | 1.0 | 736 | $1,000 | $1.36 | 43d | 1 | 1.45mi |
Listing history 21 events
-
2026-06-18days on market $119,900 Active 31 DOM
-
2026-06-17days on market $119,900 Active 30 DOM
-
2026-06-16days on market $119,900 Active 29 DOM
-
2026-06-15days on market $119,900 Active 28 DOM
-
2026-06-13days on market $119,900 Active 26 DOM
-
2026-06-09days on market $119,900 Active 22 DOM
-
2026-06-08days on market $119,900 Active 21 DOM
-
2026-06-07days on market $119,900 Active 20 DOM
-
2026-06-05days on market $119,900 Active 17 DOM
-
2026-06-03days on market $119,900 Active 16 DOM
-
2026-06-02days on market $119,900 Active 15 DOM
-
2026-06-01days on market $119,900 Active 14 DOM
-
2026-05-31days on market $119,900 Active 13 DOM
-
2026-05-18$119,900 Active
-
2026-01-09historical $1,000
-
2025-11-25$1,000
-
2025-06-02historical
-
2024-12-17$111,900 Active
-
2024-10-28historical $950
-
2024-10-05price $950
-
2024-09-28$1,050
ⓘ Source: listings_history table (triggers on properties + properties_extension) + one-shot
backfill from property_details.listing_events for pre-trigger history.
Tax reassessment forecast OK · Resets to sale price
- Current annual tax
- $951 · $79/mo
- Projected year-2 tax
- $1,079 · $90/mo
- Expected delta
- +$128/yr (+$11/mo · 13.5%)
ⓘ Screening estimate from a state-policy table — verify with the county assessor before closing.
Climate risk First Street
- Flood 6/10 Major FEMA zone X (shaded) · 66% chance over 30 yrs
- Wildfire 1/10 Low
- Heat 6/10 Major 7 d/yr ≥107°F today · 19 d/yr by 30 yrs out
- Wind 3/10 Moderate 4% chance of damaging wind over 30 yrs
- Air quality 2/10 Low 1 unhealthy d/yr today · 2 by 30 yrs out
Nearby sold comps map
Loading sold comps map…
Walkable amenities ~0.75 mi
Loading nearby amenities…
Taxation est. · year 1
- Rental income
- $13,029
- − Mortgage interest
- −$6,716
- − Property taxes
- −$951
- − Insurance
- −$600
- − Repairs & maintenance
- −$1,042
- − Management
- −$1,042
- − Depreciation
- −$3,488
- Taxable loss
- −$811
- Est. tax savings @ 24.0%
- +$195
- After-tax cash flow
- $1,391/yr
For passive investors: Depreciation is non-cash, so a rental often shows a tax loss while cash-flowing — sheltering income. Rental losses are passive: they offset passive income freely, and up to $25,000/yr can offset ordinary (W-2) income if you actively participate and your MAGI is under $100k (phasing out to $0 by $150k); unused losses carry forward. On sale, claimed depreciation is recaptured at up to 25%, and gains may owe capital-gains tax (a 1031 exchange can defer both). Figures are a year-1 estimate at your 24.0% rate — not tax advice; consult a CPA.
Schools (NCES district)
- District
- Oklahoma City
- NCES district ID
- 4022770
- Math proficiency
- 7% ▼ -5.00%
- Reading proficiency
- 10% ▼ -6.00%
- Median HH income
- $35,606
- Composite
- 7.0/100
- National rank
- #9970
- State rank
- #254 of 270 in OK
Livability — Oklahoma City
- Score
- 80/100
- State rank
- #3
- US rank
- #1635
Category grades
Schools grade is shown separately in the Schools card above.
Census & demographics
- Census place
- Oklahoma City, OK
- County
- Oklahoma County · 771,644 people
- City population
- 498,656
- Metro
- Oklahoma City, OK
- Population (ZIP)
- 6,225
- Household income
- $23,413
- Rent vs Own
- Severe rent burden
- 681.0
Population outlook (Oklahoma County) Hauer SSP2
- Today (2025)
- 911,875 people
- By 2030
- 982,413 · +7.7%
- By 2040
- 1,130,468 · +24.0%
- By 2050
- 1,288,422 · +41.3%
- By 2075
- 1,711,482 · +87.7%
- By 2100
- 2,088,448 · +129.0%
Race, ethnicity, and origin ACS 2023
- Neighborhood character
- Diverse neighborhood (Simpson 0.56)
- Race & ethnicity
- Black 63% White 16% Two or more races 13% Hispanic / Latino 12% Asian 2%
- Hispanic origin (detail)
- Mexican 10%
- Foreign-born
- 10% · Canada, Guatemala, China
- Languages at home
- 87% English-only · Spanish 8% Other Indo-European 1% Other Asian/Pacific 1%
Political lean MEDSL · Oklahoma
- 2024 margin
- Toss-up / Even · D 48.0% · R 49.7% · Other 2.3%
- 2008→2024 swing
- +15.1pp toward D · 2008: -16.8pp · 2024: -1.7pp
- All cycles
- 2024: R+1.7 2020: R+1.1 2016: R+10.5 2012: R+16.7 2008: R+16.8
Not yet ingested
- Civics
- —
Market trends
- HPI YoY
- ▲ 2.42%
- Current HPI
- 192.3185
- Rent YoY
- —
- Metro
- Oklahoma City, OK
- State GDP YoY
- ▲ 1.55%
- F500 in state
- 6
Industry mix (Fortune 500 HQ in OK)
| Industry | F500 HQs | Revenue |
|---|---|---|
| Energy | 3 | $48B |
|
||
Price history
+11319.0% since first listed8 events — show timeline
- 2026-05-18 Listed $119,900 MLSOK
- 2026-01-09 Rental Removed $1,000 BUILDIUM
- 2025-11-25 Listed for Rent $1,000 BUILDIUM
- 2025-06-02 Listing Removed — MLSOK
- 2024-12-17 Listed $111,900 MLSOK
- 2024-10-28 Rental Removed $950 BUILDIUM
- 2024-10-05 Price Changed $950 BUILDIUM
- 2024-09-28 Listed for Rent $1,050 BUILDIUM
Property tax history
+17.7%/yrLatest (2025): $951 · +4.2% YoY. Source: county tax records.
Cash-flow waterfall
monthlySold comps — $/sqft
last 12 mo · ≤1 miLoading sold comps…