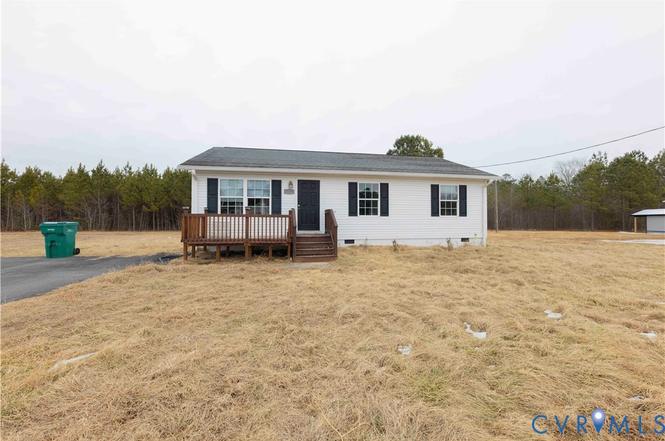
29209 Meadowview Dr · Waverly, VA
Flood risk 1/10 · Minimal
- FEMA flood zone
- X (unshaded)
- Chance of flooding over 30 yrs
- 0.0%
- Est. flood insurance / yr
- $507 – $1,088
Fire risk 4/10 · Minor
- Est. fire insurance / yr
- $666 – $1,236
Heat risk 8/10 · Major
- Hot days now (above 108°F)
- 7 days/yr
- Hot days in 30 yrs
- 15 days/yr
Wind risk 6/10 · Moderate
- Chance of severe wind over 30 yrs
- 57.0%
Air-quality risk 1/10 · Minimal
- Unhealthy air days now
- 0 days/yr
- Unhealthy air days in 30 yrs
- 0 days/yr
Risk factors via First Street. Map © Google.
Why this score? — see what drove the D+ grade
The composite is a weighted blend of 9 inputs, each scored 0–100. Each bar is that input's sub-score; the figure is the points it added to the 100-point composite (weight × sub-score).
- ARV discount +15.0/15.0
- Cash flow +10.8/30.0
- Appreciation +6.3/10.0
- Schools +3.8/10.0
- Livability +3.4/5.0
- DSCR +3.1/10.0
- Rent growth +2.5/5.0
- Condition / age +2.5/5.0
- 1% rule +2.1/10.0
$150,000
🖨 Deal sheet (PDF) 📄 Offer letter ✓ Due diligence
Listing remarks MLS
Welcome to this great home featuring 1120 square feet, 3 bedrooms, 2 full bathrooms in Waverly! Recently updated; this home offers new carpet, new vinyl flooring, painted throughout about a year ago, new light fixtures, new stove and new dishwasher. Enjoy a spacious kitchen with plenty of cabinets and counter space. Move right into this cute home nestled in the country!
Key facts
- 0.36 acre lot
- Parking
- Built 2009
Neighborhood map
What this means for you Summary
Snapshot
- This is a 3-bed/2.0-bath single-family listed at $150k.
Deal economics
- At list price, monthly cash flow is $-69 ($-832/yr) — negative.
- To cash-flow at today's rent, offer at most $138k (8.2% below list).
- To meet the 1% rule (rent ≥ 1% of price), the offer needs to be $106k (29.4% below list).
- Recommended offer: $106k (29.4% below list) — sets the bar for 1% rule.
Location & tenants
- Location reads 67/100 on livability (#305 in VA) — a middle-class / working-renter tenant base. Strengths: crime A+, cost of living A+, health & safety A+; Watch: employment C-, amenities F, commute F.
- Sussex County Public School District (rural): math 36% / reading 56% proficiency, ranked #111 of 131 in VA (top 85%) — families likely to look elsewhere, expect single-tenant / working-renter base with shorter leases; 74% free/reduced lunch — lower-income household profile, screen leases tightly.
- Zoned schools: Sussex Central Elementary (math 27% / reading 52%, grade F, #900 of 1,108 statewide, top 83%, 443 students, 101% FRL); Sussex Central Middle (math 37% / reading 52%, grade D, #278 of 342 statewide, top 82%, 236 students, 102% FRL); Sussex Central High (math 64% / reading 74%, grade B, #159 of 319 statewide, top 53%, 319 students, 101% FRL) — zoned schools average 101% FRL vs 74% district-wide (28 pts higher); higher-poverty schools than district average — tighter screening recommended.
- Market conditions: 35 active listings in the ZIP; 29 units permitted in Sussex County in 2024 (0 in 5+ unit buildings).
Forward outlook
- In year one you build about $5k of equity ($1k loan paydown + $4k appreciation (2.5% local appreciation)).
- Sussex County population projected at -11% by 2050 — secular population decline; favor cash flow + early exit over multi-decade hold.
- At projected returns (2.5% appreciation + 3.0% rent growth), your $42k cash investment doubles in ~8 years — after that, you're playing with house money.
- By year 7, paydown + projected appreciation supports a ~$31k cash-out refi (75% LTV) — recoverable capital for the next deal without selling this one.
Negotiation context
- It's been on market 18 days — a 2% lower offer ($148k) is reasonable based on typical stale-listing flexibility.
- 3 sale attempts since 3y ago; this cycle's ask has dropped $30k (17%) from the opening price — seller is motivated, your offer sets the floor, not the list.
Risks & watch-outs
- Climate carrying-cost: major wind risk, 57% chance of damaging wind over 30y; extreme-heat days projected 7→15/yr by 2055 (HVAC capex compounding) — expect insurance premiums to compound above CPI over the hold.
Questions for the listing agent
- What do current leases actually rent for vs. the listed asking? Can we see a recent rent roll and the last 12 months of T-12 income?
- Is there a deadline driving the sale (1031 exchange, divorce, estate, relocation)? That informs how much negotiation room exists.
- Schools are F-rated, which usually means shorter tenancies and higher turnover. Who's the typical renter profile here, and what's been the actual vacancy rate?
- The area grade is low — what's the realistic commute time and amenity access for the typical tenant pool here? Any planned neighborhood developments (good or bad) we should know about?
- What's the average days-on-market for RENTAL listings here right now (not sales)? A rising rental-DOM trend means longer vacancies and softer asking-rent achievability than the comps imply.
- What's the recent tenant-quality profile in this submarket — average credit score on applications, eviction rate, late-payment / NSF rate, and stable-employment percentage? A property-management company in the area should have these aggregated.
- How much new for-sale + rental construction is in the pipeline within 1–3 miles? Heavy new supply typically softens prices + rents 12–24 months out; constrained supply supports both.
Investment metrics
- 1% rule
- 0.71% ✗
- Cap rate
- 5.74%
- Cash-on-cash
- -1.98%
- DSCR
- 0.91
- GRM
- 11.8
CMA / ARV
- ARV (on-the-fly)
- $248,640
- Comps found
- 2
Show comp detail 2 sales within ~0.75 mi
| Address | Dist | Beds/Ba | Sqft | Sold | Price | $/sf | Match |
|---|---|---|---|---|---|---|---|
| 29219 Meadowview Dr | 0.02mi | 3/2.0 | 1,152 (+3%) | 16mo | $249,000 | $216 | 81 |
| 29209 Forestview Dr | 0.07mi | 3/2.0 | 1,232 (+10%) | 12mo | $273,000 | $222 | 70 |
Match score weights: distance 35% · size 25% · config 20% · recency 20%. Top-matched comps best support the ARV.
Projected returns pro-forma
2.54% appreciation · 3.0% rent growth · sell at horizon
- IRR
- 4.2%
- Equity multiple
- 1.24×
- Total profit
- $9,954
- Equity at exit
- $63,576
- IRR
- 7.6%
- Equity multiple
- 2.10×
- Total profit
- $46,165
- Equity at exit
- $95,070
Cash invested: $42,000 (down + closing). Projections, not guarantees.
Landlord ↔ Tenant lean methodology
- Overall (STATE)
- 55 Moderately Landlord-Leaning
- State Virginia
- 55 Moderately Landlord-Leaning · D+2
- County
- — inherits STATE
- City
- — inherits STATE
ZIP-level market 23890
- Home prices YoY
- 1.4%
- Active inventory
- 35
- Price-to-rent
- 11.8×
Monthly cashflow live
- Estimated rent
- $1,060 medium interval (Pro) →
- Mortgage (P&I)
- −$787
- Tax from tax record
- −$57 /mo · $687/yr
- Insurance
- −$62
- HOA
- −$0
- Vacancy / Maint / Mgmt
- −$223
- Net cashflow
- $-69
Break-even live
Sensitivity live
| Price | -10% $16 | -5% $-27 | +0% $-69 | +5% $-112 | +10% $-154 |
|---|---|---|---|---|---|
| Rent | -10% $-153 | -5% $-111 | +0% $-69 | +5% $-27 | +10% $14 |
| Rate | -1.0pp $6 | -0.5pp $-31 | base $-69 | +0.5pp $-108 | +1.0pp $-148 |
UW: 25.0% down · 7.5% · 30yr · 1.5% tax · 5.0% vac · 8.0% maint · 8.0% mgmt
Financing live
Cash to close
- Down payment
- $37,500
- Closing costs
- $4,500
- Reserves months
- —
- Total cash needed
- —
Loan-product check · same deal, 3 products live
Conventional
25% down · 7.5% · 30yr
- Down + closing
- —
- Monthly P&I
- —
- Monthly cashflow
- —
- DSCR
- —
- Eligible?
- —
Personal DTI + credit; lowest rate.
DSCR
20% down · 8.5% · 30yr
- Down + closing
- —
- Monthly P&I
- —
- Monthly cashflow
- —
- DSCR
- —
- Eligible?
- —
No personal income docs; deal must DSCR.
Hard money
10% down · 12.0% · 12mo
- Down + closing
- —
- Monthly P&I
- —
- Monthly cashflow
- —
- DSCR
- —
- Eligible?
- —
Short-term bridge; refi at stabilization.
Listing history 11 events
-
2026-04-03status Pending
-
2026-04-02status Active
-
2026-03-01status Pending
-
2026-02-16price $150,000
-
2026-02-12$180,000 Active
-
2026-02-04historical $180,000
-
2023-11-13soldstatus $205,000
-
2023-11-09soldstatus $205,000 Closed 372-char remark
Show marketing remark (372 chars)
Welcome to this great home featuring 1120 square feet, 3 bedrooms, 2 full bathrooms in Waverly! Recently updated; this home offers new carpet, new vinyl flooring, painted throughout about a year ago, new light fixtures, new stove and new dishwasher. Enjoy a spacious kitchen with plenty of cabinets and counter space. Move right into this cute home nestled in the country!
-
2023-10-05status Pending 372-char remark
Show marketing remark (372 chars)
Welcome to this great home featuring 1120 square feet, 3 bedrooms, 2 full bathrooms in Waverly! Recently updated; this home offers new carpet, new vinyl flooring, painted throughout about a year ago, new light fixtures, new stove and new dishwasher. Enjoy a spacious kitchen with plenty of cabinets and counter space. Move right into this cute home nestled in the country!
-
2023-09-05$224,950 Active 372-char remark
Show marketing remark (372 chars)
Welcome to this great home featuring 1120 square feet, 3 bedrooms, 2 full bathrooms in Waverly! Recently updated; this home offers new carpet, new vinyl flooring, painted throughout about a year ago, new light fixtures, new stove and new dishwasher. Enjoy a spacious kitchen with plenty of cabinets and counter space. Move right into this cute home nestled in the country!
-
2023-01-25soldstatus $250,000
ⓘ Source: listings_history table (triggers on properties + properties_extension) + one-shot
backfill from property_details.listing_events for pre-trigger history.
Tax reassessment forecast VA · Resets to sale price
- Current annual tax
- $687 · $57/mo
- Projected year-2 tax
- $1,230 · $102/mo
- Expected delta
- +$543/yr (+$45/mo · 78.9%)
ⓘ Screening estimate from a state-policy table — verify with the county assessor before closing.
Climate risk First Street
- Flood 1/10 Low FEMA zone X (unshaded) · 0% chance over 30 yrs
- Wildfire 4/10 Moderate
- Heat 8/10 Severe 7 d/yr ≥108°F today · 15 d/yr by 30 yrs out
- Wind 6/10 Major 57% chance of damaging wind over 30 yrs
- Air quality 1/10 Low 0 unhealthy d/yr today · 0 by 30 yrs out
Nearby sold comps map
Loading sold comps map…
Walkable amenities ~0.75 mi
Loading nearby amenities…
Taxation est. · year 1
- Rental income
- $12,715
- − Mortgage interest
- −$8,402
- − Property taxes
- −$687
- − Insurance
- −$750
- − Repairs & maintenance
- −$1,017
- − Management
- −$1,017
- − Depreciation
- −$4,364
- Taxable loss
- −$3,523
- Est. tax savings @ 24.0%
- +$845
- After-tax cash flow
- $14/yr
For passive investors: Depreciation is non-cash, so a rental often shows a tax loss while cash-flowing — sheltering income. Rental losses are passive: they offset passive income freely, and up to $25,000/yr can offset ordinary (W-2) income if you actively participate and your MAGI is under $100k (phasing out to $0 by $150k); unused losses carry forward. On sale, claimed depreciation is recaptured at up to 25%, and gains may owe capital-gains tax (a 1031 exchange can defer both). Figures are a year-1 estimate at your 24.0% rate — not tax advice; consult a CPA.
Schools (NCES district)
- District
- Sussex County Public School District
- NCES district ID
- 5103780
- Math proficiency
- 36% ▼ -46.00%
- Reading proficiency
- 56% ▼ -22.00%
- Median HH income
- $40,095
- Composite
- 38.44/100
- National rank
- #4198
- State rank
- #111 of 131 in VA
Livability — Waverly
- Score
- 67/100
- State rank
- #305
- US rank
- #10923
Category grades
Schools grade is shown separately in the Schools card above.
Census & demographics
- Census place
- Waverly, VA
- Population (ZIP)
- 4,600
Population outlook (Sussex County) Hauer SSP2
- Today (2025)
- 11,207 people
- By 2030
- 10,897 · -2.8%
- By 2040
- 10,451 · -6.7%
- By 2050
- 9,936 · -11.3%
- By 2075
- 8,643 · -22.9%
- By 2100
- 6,908 · -38.4%
Race, ethnicity, and origin ACS 2023
- Neighborhood character
- Majority Black (60%)
- Race & ethnicity
- Black 60% White 36% Two or more races 3% Hispanic / Latino 1%
- Common ancestry
- Lithuanian 1% Slovak 1% Italian 1%
- Foreign-born
- 0%
- Languages at home
- 99% English-only · Spanish 1%
Political lean MEDSL · Sussex
- 2024 margin
- Toss-up / Even · D 51.9% · R 47.5%
- 2008→2024 swing
- -19.3pp toward R · 2008: 23.8pp · 2024: 4.4pp
- All cycles
- 2024: D+4.4 2020: D+11.9 2016: D+16.3 2012: D+24.5 2008: D+23.8
Not yet ingested
- Civics
- —
Market trends
- HPI YoY
- ▲ 2.54%
- Current HPI
- 180.2394
- Rent YoY
- —
- Metro
- —
- State GDP YoY
- ▲ 2.40%
- F500 in state
- 50
Industry mix (Fortune 500 HQ in VA)
| Industry | F500 HQs | Revenue |
|---|---|---|
| Aerospace / Defense | 4 | $236B |
|
||
| Technology / Defense | 3 | $32B |
|
||
| Financial Services | 2 | $176B |
|
||
| Utilities | 2 | $27B |
|
||
| Insurance | 2 | $25B |
|
||
| Technology | 2 | $15B |
|
||
Price history
-40.0% since first listed11 events — show timeline
- 2026-04-03 Pending — CVRMLS
- 2026-04-02 Relisted — CVRMLS
- 2026-03-01 Pending — CVRMLS
- 2026-02-16 Price Changed $150,000 CVRMLS
- 2026-02-12 Listed $180,000 CVRMLS
- 2026-02-04 Coming Soon $180,000 CVRMLS
- 2023-11-13 Sold (Public Records) $205,000 Public Records
- 2023-11-09 Sold (MLS) $205,000 CVRMLS
- 2023-10-05 Pending — CVRMLS
- 2023-09-05 Listed $224,950 CVRMLS
- 2023-01-25 Sold (Public Records) $250,000 Public Records
Property tax history
+19.8%/yrLatest (2025): $687 · +0.0% YoY. Source: county tax records.
Cash-flow waterfall
monthlySold comps — $/sqft
last 12 mo · ≤1 miLoading sold comps…