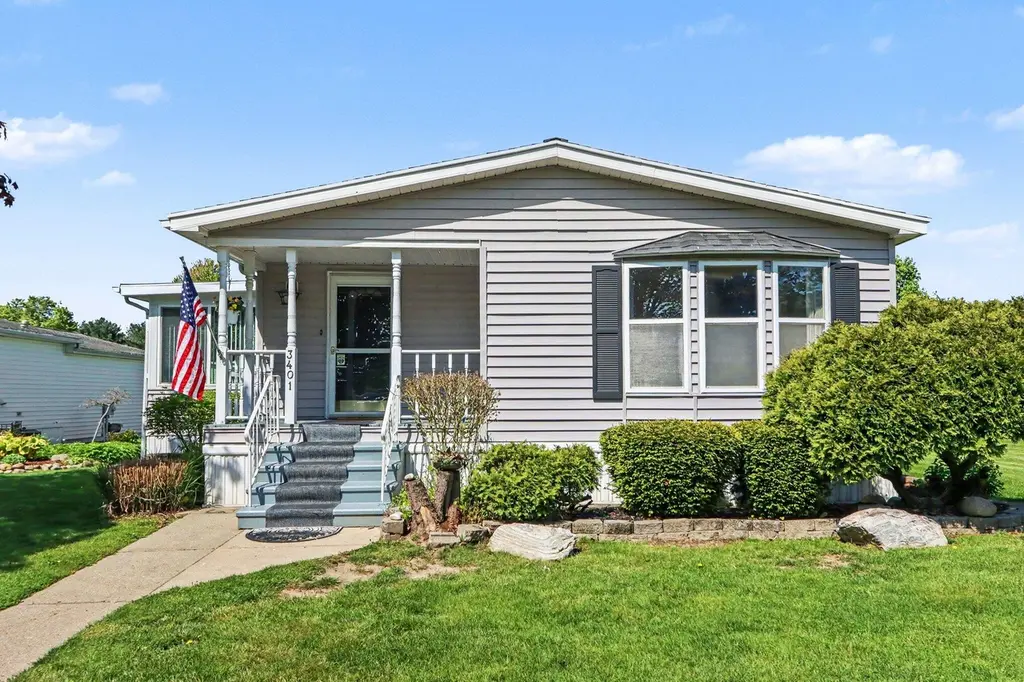
3401 Winter Wheat Rd · Westwood, MI
Flood risk No data
- FEMA flood zone
- —
- Chance of flooding over 30 yrs
- —
- Est. flood insurance / yr
- —
Fire risk No data
- Est. fire insurance / yr
- —
Heat risk No data
- Hot days now (above threshold)
- —
- Hot days in 30 yrs
- —
Wind risk No data
- Chance of severe wind over 30 yrs
- —
Air-quality risk No data
- Unhealthy air days now
- —
- Unhealthy air days in 30 yrs
- —
Risk factors via First Street. Map © Google.
Why this score? — see what drove the C grade
The composite is a weighted blend of 9 inputs, each scored 0–100. Each bar is that input's sub-score; the figure is the points it added to the 100-point composite (weight × sub-score).
- Cash flow +24.3/30.0
- DSCR +7.8/10.0
- ARV discount +7.5/15.0
- 1% rule +6.3/10.0
- Livability +4.0/5.0
- Rent growth +2.5/5.0
- Schools +2.5/10.0
- Condition / age +2.5/5.0
- Appreciation +0.0/10.0
$129,900
🖨 Deal sheet 📄 Offer letter ✓ Due diligence
Listing remarks
Welcome home to this beautifully maintained 2-bedroom, 2-bath manufactured home located in the desirable 55+ community of Country Acres! This home offers comfort, convenience, and thoughtful updates throughout. Enjoy peace of mind with newer double-paned windows, a newer furnace and central A/C, and a whole-house generator that is professionally serviced every year. The inviting newer 3-season porch provides the perfect place to relax, while the beautifully landscaped yard and fenced patio area are ideal for enjoying the outdoors with a small dog. Accessibility features include a newer handicap-accessible ramp, a walk-in shower, and a spacious double-car garage with off-street parking. All
Key facts
- Newer furnace
- Central a/c
- Fenced patio area
Tags
Neighborhood map
What this means for you Summary
Snapshot
- This is a 2-bed/2.0-bath other listed at $130k.
Deal economics
- At list price, monthly cash flow is $262 ($3k/yr) — positive.
- The deal already cash-flows at list — no discount required.
- Meets the 1% rule at list price ($1k rent vs $130k).
- Recommended offer: $126k (3.0% below list) — sets the bar for market timing.
- Cap rate 8.7% vs local median 3.3% in Westwood — top-decile yield for the area; either an underpriced asset or a hidden risk that comps aren't pricing in. Stress-test before assuming the spread holds.
Location & tenants
- Location reads 80/100 on livability (#75 in MI, #1,649 nationally) — a professional / high-income tenant draw. Strengths: schools A+, cost of living A+, housing A+; Watch: amenities F, commute F.
- Parchment School District (suburban): math 22% / reading 36% proficiency, ranked #372 of 540 in MI (top 69%) — low school quality limits family demand, transient renter base, plan for 1-2y turnover.
- Market conditions: 99 active listings in the ZIP; 3 comparable units currently listed for rent nearby; rentals leasing fast (median 13d on market — plan ~1-2 weeks tenant-placement turnaround); 339 units permitted in Kalamazoo County in 2024 (22 in 5+ unit buildings).
Forward outlook
- Local home prices are declining (-3.0%/yr); year-one equity from $898 of loan paydown is wiped out by about $4k of value loss. Plan a longer hold.
- Kalamazoo County population projected at +18% by 2050 — long-run rental-demand tailwind backs the buy-and-hold thesis.
Negotiation context
- It's been on market 33 days — a 3% lower offer ($126k) is reasonable based on typical stale-listing flexibility.
- 2 sale attempts with the ask held roughly flat each time — persistent listings suggest the price (not the market) is what's stuck; bring a comps-based counter.
Questions for the listing agent
- It's been on market 33 days. Have you received any prior offers? Is the seller open to a 3% concession, seller financing, or rate buy-down credit?
- Is there a deadline driving the sale (1031 exchange, divorce, estate, relocation)? That informs how much negotiation room exists.
- Schools are A-rated — typically a magnet for longer-tenancy family renters. What's the average tenant stay here, and is there a school-zone premium baked into asking?
- What's the average days-on-market for RENTAL listings here right now (not sales)? A rising rental-DOM trend means longer vacancies and softer asking-rent achievability than the comps imply.
- What's the recent tenant-quality profile in this submarket — average credit score on applications, eviction rate, late-payment / NSF rate, and stable-employment percentage? A property-management company in the area should have these aggregated.
- How much new for-sale + rental construction is in the pipeline within 1–3 miles? Heavy new supply typically softens prices + rents 12–24 months out; constrained supply supports both.
Investment metrics
- 1% rule
- 1.13% ✓
- Cap rate
- 8.71%
- Cash-on-cash
- 8.64%
- DSCR
- 1.38
- GRM
- 7.4
CMA / ARV
No comps found within radius.
Projected returns pro-forma
-3.0% appreciation · 3.0% rent growth · sell at horizon
- IRR
- -3.2%
- Equity multiple
- 0.88×
- Total profit
- $-4,352
- Equity at exit
- $19,369
- IRR
- 6.5%
- Equity multiple
- 1.49×
- Total profit
- $17,772
- Equity at exit
- $11,231
Cash invested: $36,372 (down + closing). Projections, not guarantees.
Landlord ↔ Tenant lean methodology
- Overall (STATE)
- 62 Landlord-Friendly
- State Michigan
- 62 Landlord-Friendly · EVEN
- County
- — inherits STATE
- City
- — inherits STATE
ZIP-level market 49004
- Active inventory
- 99
- Price-to-rent
- 7.4×
Monthly cashflow live
- Estimated rent
- $1,468 medium interval (Pro) →
- Mortgage (P&I)
- −$681
- Tax est. 1.5%
- −$162 /mo · $1,948/yr
- Insurance
- −$54
- HOA
- −$0
- Vacancy / Maint / Mgmt
- −$308
- Net cashflow
- $262
Break-even live
UW: 25.0% down · 7.5% · 30yr · 1.5% tax · 5.0% vac · 8.0% maint · 8.0% mgmt
Financing live
Cash to close
- Down payment
- $32,475
- Closing costs
- $3,897
- Reserves months
- —
- Total cash needed
- —
Loan-product check · same deal, 3 products live
Conventional
25% down · 7.5% · 30yr
- Down + closing
- —
- Monthly P&I
- —
- Monthly cashflow
- —
- DSCR
- —
- Eligible?
- —
Personal DTI + credit; lowest rate.
DSCR
20% down · 8.5% · 30yr
- Down + closing
- —
- Monthly P&I
- —
- Monthly cashflow
- —
- DSCR
- —
- Eligible?
- —
No personal income docs; deal must DSCR.
Hard money
10% down · 12.0% · 12mo
- Down + closing
- —
- Monthly P&I
- —
- Monthly cashflow
- —
- DSCR
- —
- Eligible?
- —
Short-term bridge; refi at stabilization.
Rent comps 3 comps
| Address | Beds | Baths | Sqft | Rent | $/sqft | DOM | Units | Dist |
|---|---|---|---|---|---|---|---|---|
| 3205 Douglas Ave Kalamazoo, MI | 2.0–3.0 | 1.0–2.0 | 912 | $1,169 | $1.28 | 13d | 1 | 0.91mi |
| 1925 Nichols Rd Kalamazoo, MI | 2.0 | 1.0 | 1249 | $1,199 | $0.96 | 21d | 1 | 1.01mi |
| 3510 N Drake Rd Kalamazoo, MI | 1.0–3.0 | 1.0–1.5 | 1100 | $7,755 | $7.05 | 13d | 4 | 1.30mi |
Listing history 16 events
-
2026-06-15days on market $129,900 Active 33 DOM
-
2026-06-14days on market $129,900 Active 31 DOM
-
2026-06-13days on market $129,900 Active 30 DOM
-
2026-06-10days on market $129,900 Active 28 DOM
-
2026-06-09days on market $129,900 Active 27 DOM
-
2026-06-08days on market $129,900 Active 26 DOM
-
2026-06-07days on market $129,900 Active 25 DOM
-
2026-06-03days on market $129,900 Active 21 DOM
-
2026-06-02days on market $129,900 Active 20 DOM
-
2026-06-01days on market $129,900 Active 19 DOM
-
2026-06-01price $129,900 Active 18 DOM
-
2026-05-31days on market $134,900 Active 18 DOM
-
2026-05-30days on market $134,900 Active 17 DOM
-
2026-05-13$134,900 Active 999-char remark
-
2026-05-13$134,900 Active 1002-char remark
-
2026-05-13$134,900 Active
ⓘ Source: listings_history table (triggers on properties + properties_extension) + one-shot
backfill from property_details.listing_events for pre-trigger history.
Nearby sold comps map
Loading sold comps map…
Walkable amenities ~0.75 mi
Loading nearby amenities…
Taxation est. · year 1
- Rental income
- $17,613
- − Mortgage interest
- −$7,276
- − Property taxes
- −$1,948
- − Insurance
- −$650
- − Repairs & maintenance
- −$1,409
- − Management
- −$1,409
- − Depreciation
- −$3,779
- Taxable income
- $1,142
- Est. tax owed @ 24.0%
- −$274
- After-tax cash flow
- $2,868/yr
For passive investors: Depreciation is non-cash, so a rental often shows a tax loss while cash-flowing — sheltering income. Rental losses are passive: they offset passive income freely, and up to $25,000/yr can offset ordinary (W-2) income if you actively participate and your MAGI is under $100k (phasing out to $0 by $150k); unused losses carry forward. On sale, claimed depreciation is recaptured at up to 25%, and gains may owe capital-gains tax (a 1031 exchange can defer both). Figures are a year-1 estimate at your 24.0% rate — not tax advice; consult a CPA.
Schools (NCES district)
- District
- Parchment School District
- NCES district ID
- 2627420
- Math proficiency
- 22% ▼ -10.00%
- Reading proficiency
- 36% ▼ -6.00%
- Median HH income
- $49,525
- Composite
- 25.27/100
- National rank
- #7494
- State rank
- #372 of 540 in MI
Livability — Westwood
- Score
- 80/100
- State rank
- #75
- US rank
- #1649
Category grades
Schools grade is shown separately in the Schools card above.
Census & demographics
- County
- Kalamazoo County · 224,317 people
- City population
- 25,888
- Metro
- Kalamazoo-Portage, MI
- Population (ZIP)
- 17,815
- Household income
- $73,453
- Rent vs Own
- Severe rent burden
- 330.0
Population outlook (Kalamazoo County) Hauer SSP2
- Today (2025)
- 280,982 people
- By 2030
- 292,068 · +3.9%
- By 2040
- 312,191 · +11.1%
- By 2050
- 331,196 · +17.9%
- By 2075
- 379,021 · +34.9%
- By 2100
- 396,579 · +41.1%
Race, ethnicity, and origin ACS 2023
- Neighborhood character
- Predominantly White (79%)
- Race & ethnicity
- White 79% Two or more races 9% Black 8% Hispanic / Latino 5% Asian 2%
- Hispanic origin (detail)
- Mexican 2%
- Common ancestry
- Iranian 10% Romanian 5% Lithuanian 3%
- Foreign-born
- 3% · Canada
- Languages at home
- 97% English-only · Spanish 1% Tagalog/Filipino 1%
Political lean MEDSL · Kalamazoo
- 2024 margin
- D (+17.7) · D 58.0% · R 40.3% · Other 1.7%
- 2008→2024 swing
- -1.8pp toward R · 2008: 19.5pp · 2024: 17.7pp
- All cycles
- 2024: D+17.7 2020: D+18.7 2016: D+12.8 2012: D+13.3 2008: D+19.5
Not yet ingested
- Civics
- —
Market trends
- HPI YoY
- ▼ -247.79%
- Current HPI
- 202.6197
- Rent YoY
- —
- Metro
- Kalamazoo-Portage, MI
- State GDP YoY
- ▲ 1.37%
- F500 in state
- 28
Industry mix (Fortune 500 HQ in MI)
| Industry | F500 HQs | Revenue |
|---|---|---|
| Automotive Parts | 3 | $48B |
|
||
| Automotive | 2 | $372B |
|
||
| Chemicals | 1 | $45B |
|
||
| Automotive Retail | 1 | $29B |
|
||
| Healthcare / Medical Devices | 1 | $23B |
|
||
| Automotive Technology | 1 | $20B |
|
||
Price history
-3.7% since first listed7 events — show timeline
- 2026-06-15 Listing Removed — MiRealSource-MiMLS
- 2026-06-15 Listing Removed — REALCOMP
- 2026-05-31 Price Changed $129,900 MiRealSource-MiMLS
- 2026-05-31 Price Changed $129,900 REALCOMP
- 2026-05-31 Price Changed $129,900 SW Michigan MLS
- 2026-05-13 Listed $134,900 REALCOMP
- 2026-05-13 Listed $134,900 MiRealSource-MiMLS
Property tax history
+1.2%/yrLatest (2025): $136 · +0.9% YoY. Source: county tax records.
Cash-flow waterfall
monthlySold comps — $/sqft
last 12 mo · ≤1 miLoading sold comps…