 Duplex
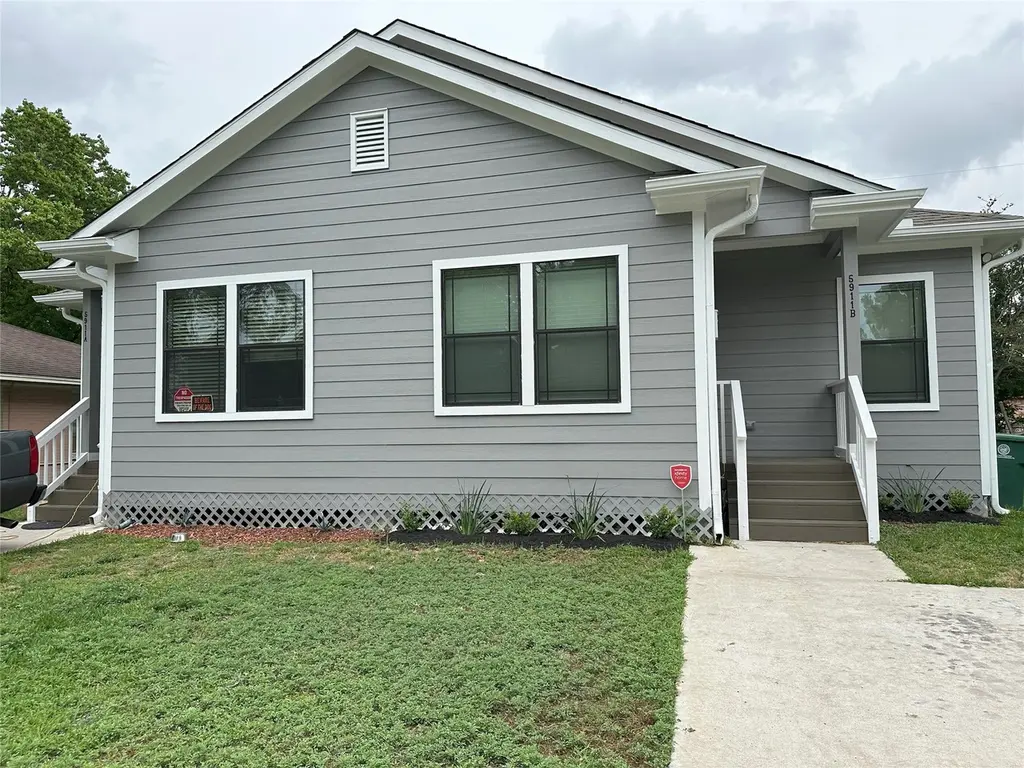
5911 Westover St · Houston, TX
Flood risk 6/10 · Moderate
- FEMA flood zone
- AE
- Chance of flooding over 30 yrs
- 0.67%
- Est. flood insurance / yr
- $1,737 – $8,500
Fire risk 1/10 · Minimal
- Est. fire insurance / yr
- $1,222 – $2,270
Heat risk 9/10 · Severe
- Hot days now (above 109°F)
- 6 days/yr
- Hot days in 30 yrs
- 19 days/yr
Wind risk 9/10 · Severe
- Chance of severe wind over 30 yrs
- 99.0%
Air-quality risk 2/10 · Minimal
- Unhealthy air days now
- 2 days/yr
- Unhealthy air days in 30 yrs
- 2 days/yr
Risk factors via First Street. Map © Google.
Why this score? — see what drove the D+ grade
The composite is a weighted blend of 9 inputs, each scored 0–100. Each bar is that input's sub-score; the figure is the points it added to the 100-point composite (weight × sub-score).
- ARV discount +14.1/15.0
- Cash flow +14.0/30.0
- DSCR +4.3/10.0
- 1% rule +4.1/10.0
- Rent growth +3.9/5.0
- Livability +3.7/5.0
- Schools +2.7/10.0
- Condition / age +2.5/5.0
- Appreciation +0.0/10.0
$399,900
🖨 Deal sheet (PDF) 📄 Offer letter ✓ Due diligence
Multi-family units
County records classify this as Multi-Family (2-4 Unit). Listing-text estimate: 2 units. confirmed
Listing remarks MLS
Beautiful DUPLEX in booming Sunnyside! Both sides have 3 bedrooms and 2 baths with a GREAT open layout! This modern and stylish duplex boasts an open floor plan with elevated ceilings and large windows that provide abundant natural light throughout! Your tenants will be greeted with a layout that flows seamlessly into the dining area, kitchen and living area. The kitchen features stainless steel appliances, granite countertops, and a pantry for all your storage needs. Modern fixtures, vinyl plank flooring, ceiling fans, crisp neutral paint, walk-in closet and so much more! You have ample parking and a fenced backyard! You have close access to major roadways to make your commute a breeze! Call for an appointment today!! Both sides have been leased, but unit B is vacating Nov 30th, so can be purchased as owner/occupant now! Call for details!
Key facts
- Large windows
- Pantry
- Open layout
Tags
Neighborhood map
What this means for you Summary
Snapshot
- This is a 2 × 3-bed/2.0-bath units multifamily listed at $400k.
Deal economics
- At list price, monthly cash flow is $-372 ($-4k/yr) — negative. Per door: $-186/mo.
- To cash-flow at today's rent, offer at most $334k (16.4% below list).
- To meet the 1% rule (rent ≥ 1% of price), the offer needs to be $366k (8.5% below list).
- Recommended offer: $334k (16.4% below list) — sets the bar for cash-flow.
- Cap rate 6.5% vs local median 3.2% in Houston — top-decile yield for the area; either an underpriced asset or a hidden risk that comps aren't pricing in. Stress-test before assuming the spread holds.
Location & tenants
- Location reads 74/100 on livability (#184 in TX, #4,771 nationally) — a middle-class / working-renter tenant base. Strengths: amenities A+, cost of living A+, housing A+; Watch: crime F.
- Houston ISD (urban): math 27% / reading 35% proficiency, ranked #593 of 826 in TX (top 72%) — families likely to look elsewhere, expect single-tenant / working-renter base with shorter leases; 71% free/reduced lunch — lower-income household profile, screen leases tightly.
- Zoned schools: Mading El (math 22% / reading 27%, grade F, #3,052 of 4,322 statewide, top 74%, 339 students, 96% FRL); Thomas Middle (math 3% / reading 13%, grade F, #1,654 of 1,662 statewide, top 100%, 526 students, 98% FRL); Sterling H S (math 16% / reading 27%, grade F, #1,377 of 1,632 statewide, top 85%, 1,421 students, 92% FRL) — zoned schools average 96% FRL vs 71% district-wide (24 pts higher); higher-poverty schools than district average — tighter screening recommended.
- Zoned-school proficiency averages 18% at this address vs 31% district-wide (-13 pts) — the specific schools serving this property underperform the Houston ISD average; the district grade overstates school quality for this exact location.
- Market conditions: Rents rising fast (+5.5%/yr); 345 active listings in the ZIP; 18 comparable units currently listed for rent nearby; rentals at typical pace (median 26d on market — plan ~3-4 weeks tenant-placement turnaround); 44% of comp listings sitting > 30 days — soft ceiling on asking rent; lower-income renter base — watch delinquency; 29,883 units permitted in Harris County in 2024 (8,621 in 5+ unit buildings).
- At $3,658/mo this rent would consume 115% of the median local household income ($38k/yr) (locally 1728% of renters already pay >50% of income on rent) — very limited rent-growth headroom before tenants either downsize or default.
Forward outlook
- Local home prices are declining (-3.0%/yr); year-one equity from $3k of loan paydown is wiped out by about $12k of value loss. Plan a longer hold.
- Harris County population projected at +47% by 2050 — long-run rental-demand tailwind backs the buy-and-hold thesis.
Negotiation context
- It's been on market 155 days — a 12% lower offer ($352k) is reasonable based on typical stale-listing flexibility.
- 3 sale attempts since 7y ago with the ask held roughly flat each time — persistent listings suggest the price (not the market) is what's stuck; bring a comps-based counter.
Risks & watch-outs
- Watch-outs: flood insurance adds $427/mo.
- Climate carrying-cost: in FEMA flood zone AE (mandatory federal flood insurance); severe wind risk, 99% chance of damaging wind over 30y; extreme-heat days projected 6→19/yr by 2055 (HVAC capex compounding) — expect insurance premiums to compound above CPI over the hold.
Questions for the listing agent
- What do current leases actually rent for vs. the listed asking? Can we see a recent rent roll and the last 12 months of T-12 income?
- It's been on market 155 days. Have you received any prior offers? Is the seller open to a 16% concession, seller financing, or rate buy-down credit?
- Can we see the unit-by-unit rent roll, current vacancy, and any below-market leases? What's the average tenancy length?
- What capital expenditures (roof, boiler, parking lot, exteriors) have been made in the last 5 years, and what's planned in the next 2?
- What's the actual annual flood-insurance premium (NFIP or private), and is the property in a SFHA with mandatory coverage?
- Why hasn't it sold? Are there any deal-killer items the seller is aware of (foundation, flood, title, zoning, code violations)?
- Is there a deadline driving the sale (1031 exchange, divorce, estate, relocation)? That informs how much negotiation room exists.
- Schools are D-rated, which usually means shorter tenancies and higher turnover. Who's the typical renter profile here, and what's been the actual vacancy rate?
- Crime grade is F in this area — have there been break-ins, vandalism, or insurance claims at this property in the last 3 years? What carrier currently insures it and at what premium?
- The area grade is low — what's the realistic commute time and amenity access for the typical tenant pool here? Any planned neighborhood developments (good or bad) we should know about?
- What's the average days-on-market for RENTAL listings here right now (not sales)? A rising rental-DOM trend means longer vacancies and softer asking-rent achievability than the comps imply.
- What's the recent tenant-quality profile in this submarket — average credit score on applications, eviction rate, late-payment / NSF rate, and stable-employment percentage? A property-management company in the area should have these aggregated.
- How much new apartment / multifamily construction is in the pipeline within 1–3 miles? Heavy new supply (>2% of stock underway) typically softens rents 12–24 months out; light construction supports rent growth.
Investment metrics
- 1% rule
- 0.91% ✗
- Cap rate
- 6.46%
- Cash-on-cash
- 0.59%
- DSCR
- 1.03
- GRM
- 9.1
CMA / ARV
- ARV (median comp)
- $468,076
- List price
- $399,900
- Delta
- -14.57%
- Verdict
- UNDERPRICED
- Comps
- 8 within 1.0 mi
Projected returns pro-forma
-3.0% appreciation · 5.45% rent growth · sell at horizon
- IRR
- -19.7%
- Equity multiple
- 0.30×
- Total profit
- $-78,876
- Equity at exit
- $59,626
- IRR
- -7.2%
- Equity multiple
- 0.48×
- Total profit
- $-57,840
- Equity at exit
- $34,576
Cash invested: $111,972 (down + closing). Projections, not guarantees.
Landlord ↔ Tenant lean methodology
- Overall (STATE)
- 87 Strongly Landlord-Friendly
- State Texas
- 87 Strongly Landlord-Friendly · R+5
- County
- — inherits STATE
- City
- — inherits STATE
ZIP-level market 77033
- Home prices YoY
- -16.3%
- Rents YoY
- 5.5%
- Active inventory
- 345
- Price-to-rent
- 18.2×
Monthly cashflow live
- Estimated rent
- $3,658 high interval (Pro) →
- Mortgage (P&I)
- −$2,097
- Tax from tax record
- −$571 /mo · $6,855/yr
- Insurance
- −$167
- Flood insurance flood zone
- −$427 /mo · $5,118/yr
- HOA
- −$0
- Vacancy / Maint / Mgmt
- −$768
- Net cashflow
- $-372
Break-even live
Sensitivity live
| Price | -10% $-145 | -5% $-259 | +0% $-372 | +5% $-485 | +10% $-598 |
|---|---|---|---|---|---|
| Rent | -10% $-661 | -5% $-516 | +0% $-372 | +5% $-227 | +10% $-83 |
| Rate | -1.0pp $-170 | -0.5pp $-270 | base $-372 | +0.5pp $-475 | +1.0pp $-581 |
2-unit breakdown (identical units grouped — click to expand)
| Units | Beds | Baths | Est. rent |
|---|---|---|---|
| 2× units | 3 | 2 | $3,658 |
| #1 | 3 | 2 | $1,829 |
| #2 | 3 | 2 | $1,829 |
| Total (2 units) | $3,658 | ||
UW: 25.0% down · 7.5% · 30yr · 1.5% tax · 5.0% vac · 8.0% maint · 8.0% mgmt
Financing live
Cash to close
- Down payment
- $99,975
- Closing costs
- $11,997
- Reserves months
- —
- Total cash needed
- —
Loan-product check · same deal, 3 products live
Conventional
25% down · 7.5% · 30yr
- Down + closing
- —
- Monthly P&I
- —
- Monthly cashflow
- —
- DSCR
- —
- Eligible?
- —
Personal DTI + credit; lowest rate.
DSCR
20% down · 8.5% · 30yr
- Down + closing
- —
- Monthly P&I
- —
- Monthly cashflow
- —
- DSCR
- —
- Eligible?
- —
No personal income docs; deal must DSCR.
Hard money
10% down · 12.0% · 12mo
- Down + closing
- —
- Monthly P&I
- —
- Monthly cashflow
- —
- DSCR
- —
- Eligible?
- —
Short-term bridge; refi at stabilization.
Rent comps 18 comps
| Address | Beds | Baths | Sqft | Rent | $/sqft | DOM | Units | Dist |
|---|---|---|---|---|---|---|---|---|
| 5942 Ridgeway Dr Houston, TX | 4.0 | 2.0 | 1490 | $2,250 | $1.51 | 45d | 1 | 0.35mi |
| 5767 Belcrest St Houston, TX | 4.0 | 2.0 | 1480 | $1,790 | $1.21 | 45d | 1 | 0.35mi |
| 5818 Glenhurst Dr Houston, TX | 3.0 | 2.0 | 1441 | $1,750 | $1.21 | 1d | 1 | 0.59mi |
| 5407 Thrush Dr Houston, TX | 4.0 | 1.0 | 1407 | $1,495 | $1.06 | 15d | 1 | 0.93mi |
| 9509 Merle St Unit 9509A Houston, TX | 4.0 | 2.5 | 1404 | $1,500 | $1.07 | 45d | 1 | 1.01mi |
| 6418 Hirondel St Houston, TX | 3.0 | 2.0 | 1602 | $1,999 | $1.25 | 45d | 1 | 1.02mi |
| 6850 Southbank St Unit A Houston, TX | 3.0 | 3.0 | 2000 | $2,200 | $1.10 | 6d | 1 | 1.03mi |
| 6850 Southbank St Unit A Houston, TX | 3.0 | 3.0 | 2000 | $2,200 | $1.10 | 5d | 1 | 1.03mi |
| 5314 Longmeadow St Houston, TX | 3.0 | 3.0 | 1646 | $1,900 | $1.15 | 45d | 1 | 1.05mi |
| 5201 Kenilwood Dr Unit B Houston, TX | 3.0 | 2.0 | 2442 | $1,725 | $0.71 | 15d | 1 | 1.16mi |
| 5036 Mallow St Houston, TX | 3.0 | 3.0 | 1472 | $2,050 | $1.39 | 45d | 1 | 1.18mi |
| 7339 Krueger Rd Houston, TX | 3.0 | 2.0 | 2440 | $1,900 | $0.78 | 45d | 1 | 1.30mi |
| 5726 Waterford Dr Houston, TX | 3.0 | 2.0 | 2000 | $1,850 | $0.93 | 12d | 1 | 1.31mi |
| 7710 Darnay Dr Houston, TX | 3.0 | 3.0 | 1635 | $2,095 | $1.28 | 45d | 1 | 1.37mi |
| 5012 Higgins St Unit B Houston, TX | 3.0 | 2.5 | 1611 | $1,650 | $1.02 | 26d | 1 | 1.39mi |
| 5408 Groveton St Houston, TX | 4.0 | 2.0 | 1472 | $1,983 | $1.35 | 1d | 1 | 1.44mi |
| 5317 Chennault Rd Unit A Houston, TX | 3.0 | 2.5 | 1608 | $1,849 | $1.15 | 0d | 1 | 1.47mi |
| 4921a Pederson St Unit A Houston, TX | 3.0 | 2.0 | 1765 | $2,150 | $1.22 | 14d | 1 | 1.49mi |
Listing history 24 events
-
2026-06-21days on market $399,900 Active 155 DOM
-
2026-06-18days on market $399,900 Active 152 DOM
-
2026-06-17days on market $399,900 Active 151 DOM
-
2026-06-16days on market $399,900 Active 150 DOM
-
2026-06-15days on market $399,900 Active 149 DOM
-
2026-06-13days on market $399,900 Active 147 DOM
-
2026-06-10days on market $399,900 Active 143 DOM
-
2026-06-08days on market $399,900 Active 142 DOM
-
2026-06-07days on market $399,900 Active 141 DOM
-
2026-06-04days on market $399,900 Active 138 DOM
-
2026-06-01days on market $399,900 Active 135 DOM
-
2026-05-31days on market $399,900 Active 134 DOM
-
2026-01-17$399,900 Active 851-char remark
Show marketing remark (851 chars)
Beautiful DUPLEX in booming Sunnyside! Both sides have 3 bedrooms and 2 baths with a GREAT open layout! This modern and stylish duplex boasts an open floor plan with elevated ceilings and large windows that provide abundant natural light throughout! Your tenants will be greeted with a layout that flows seamlessly into the dining area, kitchen and living area. The kitchen features stainless steel appliances, granite countertops, and a pantry for all your storage needs. Modern fixtures, vinyl plank flooring, ceiling fans, crisp neutral paint, walk-in closet and so much more! You have ample parking and a fenced backyard! You have close access to major roadways to make your commute a breeze! Call for an appointment today!! Both sides have been leased, but unit B is vacating Nov 30th, so can be purchased as owner/occupant now! Call for details!
-
2026-01-17historical
Show marketing remark (851 chars)
Beautiful DUPLEX in booming Sunnyside! Both sides have 3 bedrooms and 2 baths with a GREAT open layout! This modern and stylish duplex boasts an open floor plan with elevated ceilings and large windows that provide abundant natural light throughout! Your tenants will be greeted with a layout that flows seamlessly into the dining area, kitchen and living area. The kitchen features stainless steel appliances, granite countertops, and a pantry for all your storage needs. Modern fixtures, vinyl plank flooring, ceiling fans, crisp neutral paint, walk-in closet and so much more! You have ample parking and a fenced backyard! You have close access to major roadways to make your commute a breeze! Call for an appointment today!! Both sides have been leased, but unit B is vacating Nov 30th, so can be purchased as owner/occupant now! Call for details!
-
2025-03-24price $399,900
-
2024-06-11price $414,900
-
2024-05-20price $429,900
-
2024-05-01$449,900 Active
-
2022-01-20soldstatus
-
2019-10-25soldstatus Sold
-
2019-10-25soldstatus
-
2019-06-18price $33,650
-
2019-02-13$34,650 Active
-
1988-01-02soldstatus
ⓘ Source: listings_history table (triggers on properties + properties_extension) + one-shot
backfill from property_details.listing_events for pre-trigger history.
Tax reassessment forecast TX · Resets to sale price
- Current annual tax
- $6,855 · $571/mo
- Projected year-2 tax
- $7,318 · $610/mo
- Expected delta
- +$463/yr (+$39/mo · 6.8%)
ⓘ Screening estimate from a state-policy table — verify with the county assessor before closing.
Climate risk First Street
- Flood 6/10 Major FEMA zone AE · 67% chance over 30 yrs
- Wildfire 1/10 Low
- Heat 9/10 Extreme 6 d/yr ≥109°F today · 19 d/yr by 30 yrs out
- Wind 9/10 Extreme 99% chance of damaging wind over 30 yrs
- Air quality 2/10 Low 2 unhealthy d/yr today · 2 by 30 yrs out
Nearby sold comps map
Loading sold comps map…
Walkable amenities ~0.75 mi
Loading nearby amenities…
Taxation est. · year 1
- Rental income
- $43,896
- − Mortgage interest
- −$22,401
- − Property taxes
- −$6,855
- − Insurance
- −$7,118
- − Repairs & maintenance
- −$3,512
- − Management
- −$3,512
- − Depreciation
- −$11,633
- Taxable loss
- −$11,134
- Est. tax savings @ 24.0%
- +$2,672
- After-tax cash flow
- $-1,788/yr
For passive investors: Depreciation is non-cash, so a rental often shows a tax loss while cash-flowing — sheltering income. Rental losses are passive: they offset passive income freely, and up to $25,000/yr can offset ordinary (W-2) income if you actively participate and your MAGI is under $100k (phasing out to $0 by $150k); unused losses carry forward. On sale, claimed depreciation is recaptured at up to 25%, and gains may owe capital-gains tax (a 1031 exchange can defer both). Figures are a year-1 estimate at your 24.0% rate — not tax advice; consult a CPA.
Schools (NCES district)
- District
- Houston ISD
- NCES district ID
- 4823640
- Math proficiency
- 27% ▼ -18.00%
- Reading proficiency
- 35% ▼ -6.00%
- Median HH income
- $46,054
- Composite
- 26.63/100
- National rank
- #7173
- State rank
- #593 of 826 in TX
Livability — Houston
- Score
- 74/100
- State rank
- #184
- US rank
- #4771
Category grades
Schools grade is shown separately in the Schools card above.
Census & demographics
- Census place
- Houston, TX
- County
- Harris County · 4,702,590 people
- City population
- 3,226,434
- Metro
- Houston-The Woodlands-Sugar Land, TX
- Population (ZIP)
- 29,154
- Household income
- $38,071
- Rent vs Own
- Severe rent burden
- 1728.0
Population outlook (Harris County) Hauer SSP2
- Today (2025)
- 5,571,493 people
- By 2030
- 6,089,821 · +9.3%
- By 2040
- 7,142,806 · +28.2%
- By 2050
- 8,185,864 · +46.9%
- By 2075
- 10,574,329 · +89.8%
- By 2100
- 12,109,958 · +117.4%
Race, ethnicity, and origin ACS 2023
- Neighborhood character
- Majority Black (55%)
- Race & ethnicity
- Black 55% Hispanic / Latino 43% Two or more races 17% Native American 1%
- Hispanic origin (detail)
- Mexican 35%
- Common ancestry
- Lithuanian 1%
- Foreign-born
- 18% · Canada
- Languages at home
- 61% English-only · Spanish 39%
Political lean MEDSL · Harris
- 2024 margin
- Lean D (+5.5) · D 52.0% · R 46.4% · Other 1.6%
- 2008→2024 swing
- +3.9pp toward D · 2008: 1.6pp · 2024: 5.5pp
- All cycles
- 2024: D+5.5 2020: D+13.3 2016: D+12.4 2012: D+0.1 2008: D+1.6
Not yet ingested
- Civics
- —
Market trends
- HPI YoY
- ▼ -41.49%
- Current HPI
- 212.6472
- Rent YoY
- ▲ 5.45%
- Metro
- Houston-The Woodlands-Sugar Land, TX
- State GDP YoY
- ▲ 3.95%
- F500 in state
- 110
Industry mix (Fortune 500 HQ in TX)
| Industry | F500 HQs | Revenue |
|---|---|---|
| Energy | 16 | $1,198B |
|
||
| Technology | 5 | $198B |
|
||
| Engineering / Construction | 4 | $72B |
|
||
| Energy Services | 3 | $60B |
|
||
| Utilities | 3 | $41B |
|
||
| Healthcare | 2 | $330B |
|
||
Price history
+1054.1% since first listed12 events — show timeline
- 2026-01-17 Listing Removed — HARMLS
- 2026-01-17 Listed $399,900 HARMLS
- 2025-03-24 Price Changed $399,900 HARMLS
- 2024-06-11 Price Changed $414,900 HARMLS
- 2024-05-20 Price Changed $429,900 HARMLS
- 2024-05-01 Listed $449,900 HARMLS
- 2022-01-20 Sold (Public Records) — Public Records
- 2019-10-25 Sold (Public Records) — Public Records
- 2019-10-25 Sold (MLS) — HARMLS
- 2019-06-18 Price Changed $33,650 HARMLS
- 2019-02-13 Listed $34,650 HARMLS
- 1988-01-02 Sold (Public Records) — Public Records
Property tax history
+13.4%/yrLatest (2025): $6,855 · +21.9% YoY. Source: county tax records.
Cash-flow waterfall
monthlySold comps — $/sqft
last 12 mo · ≤1 miLoading sold comps…