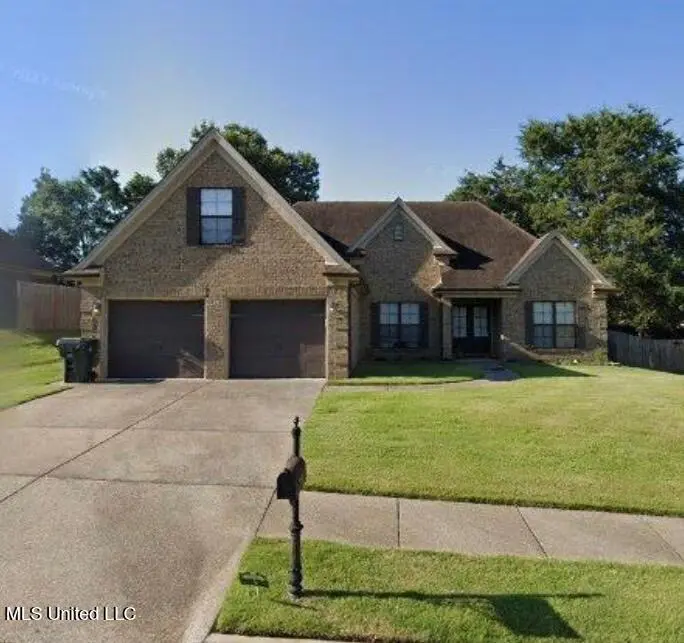
67 E Shady Lane Cv · Hernando, MS
Flood risk 1/10 · Minimal
- FEMA flood zone
- X (unshaded)
- Chance of flooding over 30 yrs
- 0.0%
- Est. flood insurance / yr
- $507 – $1,088
Fire risk 4/10 · Minor
- Est. fire insurance / yr
- $1,241 – $2,305
Heat risk 7/10 · Major
- Hot days now (above 109°F)
- 7 days/yr
- Hot days in 30 yrs
- 22 days/yr
Wind risk 4/10 · Minor
- Chance of severe wind over 30 yrs
- 23.0%
Air-quality risk 2/10 · Minimal
- Unhealthy air days now
- 2 days/yr
- Unhealthy air days in 30 yrs
- 2 days/yr
Risk factors via First Street. Map © Google.
Why this score? — see what drove the D- grade
The composite is a weighted blend of 9 inputs, each scored 0–100. Each bar is that input's sub-score; the figure is the points it added to the 100-point composite (weight × sub-score).
- Cash flow +11.6/30.0
- ARV discount +6.7/15.0
- Schools +4.0/10.0
- Livability +3.5/5.0
- DSCR +3.4/10.0
- 1% rule +2.5/10.0
- Condition / age +2.5/5.0
- Rent growth +2.4/5.0
- Appreciation +0.0/10.0
$359,900
🖨 Deal sheet (PDF) 📄 Offer letter ✓ Due diligence
Listing remarks MLS
Attractive one-owner brick & siding low maintenance home. Just minutes from the historic Hernando town square. Interior has fresh new paint to brighten your home. This home is just like new!
Key facts
- Brick siding
- Low maintenance
- 0.23 acre lot
Tags
Neighborhood map
What this means for you Summary
Snapshot
- This is a 4-bed/3.0-bath single-family listed at $360k.
Deal economics
- At list price, monthly cash flow is $-110 ($-1k/yr) — negative.
- To cash-flow at today's rent, offer at most $340k (5.4% below list).
- To meet the 1% rule (rent ≥ 1% of price), the offer needs to be $269k (25.3% below list).
- Recommended offer: $269k (25.3% below list) — sets the bar for 1% rule.
- Cap rate 5.9% vs local median 4.3% in Hernando — top-decile yield for the area; either an underpriced asset or a hidden risk that comps aren't pricing in. Stress-test before assuming the spread holds.
Location & tenants
- Location reads 70/100 on livability (#44 in MS) — a middle-class / working-renter tenant base. Strengths: crime A+, cost of living A+, housing A+; Watch: amenities F, commute F, health & safety F.
- Desoto County School District (suburban): math 48% / reading 42% proficiency, ranked #20 of 130 in MS (top 15%) — families likely to look elsewhere, expect single-tenant / working-renter base with shorter leases.
- Zoned schools: Hernando Elem (779 students, 100% FRL); Hernando Middle School (math 75% / reading 57%, grade A-, #2 of 179 statewide, top 1%, 1,150 students, 100% FRL); Hernando High School (math 69% / reading 62%, grade B, #2 of 197 statewide, top 1%, 1,419 students, 100% FRL) — zoned schools average 100% FRL vs 43% district-wide (56 pts higher); higher-poverty schools than district average — tighter screening recommended.
- Zoned-school proficiency averages 66% at this address vs 45% district-wide (+21 pts) — the actual schools serving this property are materially stronger than the Desoto County School District average implies; a family-tenant draw the district grade alone would hide.
- Market conditions: Rents soft (-0.4%/yr); 408 active listings in the ZIP; 4 comparable units currently listed for rent nearby; rentals lingering (median 46d on market — plan ~5-8 weeks vacancy on turnover, expect pricing pressure); 75% of comp listings sitting > 30 days — soft ceiling on asking rent; solid renter incomes; 1,155 units permitted in DeSoto County in 2024 (0 in 5+ unit buildings).
- This rent runs 34% of the median local income ($94k/yr) — at the standard rent-burdened threshold; future hikes will face affordability resistance.
Forward outlook
- Local home prices are declining (-3.0%/yr); year-one equity from $2k of loan paydown is wiped out by about $11k of value loss. Plan a longer hold.
- DeSoto County population projected at +33% by 2050 — long-run rental-demand tailwind backs the buy-and-hold thesis.
Negotiation context
- It's been on market 152 days — a 12% lower offer ($317k) is reasonable based on typical stale-listing flexibility.
- 4 sale attempts since 14y ago with the ask held roughly flat each time — persistent listings suggest the price (not the market) is what's stuck; bring a comps-based counter.
Risks & watch-outs
- Climate carrying-cost: extreme-heat days projected 7→22/yr by 2055 (HVAC capex compounding) — expect insurance premiums to compound above CPI over the hold.
Questions for the listing agent
- What do current leases actually rent for vs. the listed asking? Can we see a recent rent roll and the last 12 months of T-12 income?
- It's been on market 152 days. Have you received any prior offers? Is the seller open to a 25% concession, seller financing, or rate buy-down credit?
- Why hasn't it sold? Are there any deal-killer items the seller is aware of (foundation, flood, title, zoning, code violations)?
- Is there a deadline driving the sale (1031 exchange, divorce, estate, relocation)? That informs how much negotiation room exists.
- Schools are B-rated — typically a magnet for longer-tenancy family renters. What's the average tenant stay here, and is there a school-zone premium baked into asking?
- The area grade is low — what's the realistic commute time and amenity access for the typical tenant pool here? Any planned neighborhood developments (good or bad) we should know about?
- What's the average days-on-market for RENTAL listings here right now (not sales)? A rising rental-DOM trend means longer vacancies and softer asking-rent achievability than the comps imply.
- What's the recent tenant-quality profile in this submarket — average credit score on applications, eviction rate, late-payment / NSF rate, and stable-employment percentage? A property-management company in the area should have these aggregated.
- How much new for-sale + rental construction is in the pipeline within 1–3 miles? Heavy new supply typically softens prices + rents 12–24 months out; constrained supply supports both.
Investment metrics
- 1% rule
- 0.75% ✗
- Cap rate
- 5.93%
- Cash-on-cash
- -1.31%
- DSCR
- 0.94
- GRM
- 11.2
CMA / ARV
- ARV (median comp)
- $353,431
- List price
- $359,900
- Delta
- 1.83%
- Verdict
- FAIR
- Comps
- 20 within 1.0 mi
Show comp detail 12 sales within ~0.75 mi
| Address | Dist | Beds/Ba | Sqft | Sold | Price | $/sf | Match |
|---|---|---|---|---|---|---|---|
| 112 Forked Creek Pkwy | 0.09mi | 3/2.0 (-1) | 1,661 (-2%) | 2mo | $299,900 | $181 | 83 |
| 139 Tanner Cv | 0.08mi | 3/2.0 (-1) | 1,700 (+1%) | 11mo | $299,900 | $176 | 77 |
| 83 Spotted Fawn Cv | 0.16mi | 3/2.0 (-1) | 1,684 (-0%) | 19mo | $295,000 | $175 | 68 |
| 1106 Fawn Dr | 0.49mi | 3/2.0 (-1) | 1,735 (+3%) | 3mo | $307,000 | $177 | 61 |
| 41 Cross Creek Dr | 0.59mi | 3/2.0 (-1) | 1,632 (-3%) | 10mo | $288,000 | $176 | 49 |
| 216 Shady Lane Cove West | 0.13mi | 3/2.0 (-1) | 1,912 (+13%) | 20mo | $299,999 | $157 | 46 |
| 277 Pontotoc Cv | 0.58mi | 3/2.0 (-1) | 1,650 (-2%) | 18mo | $299,900 | $182 | 45 |
| 1109 Peggy Cv | 0.66mi | 4/2.0 | 1,625 (-4%) | 17mo | $320,000 | $197 | 45 |
| 1230 E Cross Creek Dr | 0.50mi | 3/2.5 (-1) | 1,921 (+14%) | 7mo | $319,900 | $167 | 41 |
| 1139 Tara Dr | 0.42mi | 4/2.0 | 1,933 (+14%) | 18mo | $319,900 | $165 | 37 |
| 230 Dogwood Dr | 0.62mi | 3/2.0 (-1) | 1,850 (+10%) | 20mo | $235,000 | $127 | 29 |
| 1380 Tara Dr | 0.72mi | 3/2.0 (-1) | 1,551 (-8%) | 20mo | $283,900 | $183 | 27 |
Match score weights: distance 35% · size 25% · config 20% · recency 20%. Top-matched comps best support the ARV.
Projected returns pro-forma
-3.0% appreciation · 0.0% rent growth · sell at horizon
- IRR
- -21.5%
- Equity multiple
- 0.27×
- Total profit
- $-73,313
- Equity at exit
- $53,662
- IRR
- -23.4%
- Equity multiple
- -0.03×
- Total profit
- $-103,767
- Equity at exit
- $31,118
Cash invested: $100,772 (down + closing). Projections, not guarantees.
Landlord ↔ Tenant lean methodology
- Overall (STATE)
- 90 Strongly Landlord-Friendly
- State Mississippi
- 90 Strongly Landlord-Friendly · R+11
- County
- — inherits STATE
- City
- — inherits STATE
ZIP-level market 38632
- Home prices YoY
- -31.8%
- Rents YoY
- -0.4%
- Active inventory
- 408
- Price-to-rent
- 11.2×
Monthly cashflow live
- Estimated rent
- $2,688 medium interval (Pro) →
- Mortgage (P&I)
- −$1,887
- Tax from tax record
- −$196 /mo · $2,354/yr
- Insurance
- −$150
- HOA
- −$0
- Lot rent
- −$0
- Vacancy / Maint / Mgmt
- −$564
- Net cashflow
- $-110
Break-even live
Sensitivity live
| Price | -10% $94 | -5% $-8 | +0% $-110 | +5% $-212 | +10% $-314 |
|---|---|---|---|---|---|
| Rent | -10% $-322 | -5% $-216 | +0% $-110 | +5% $-4 | +10% $102 |
| Rate | -1.0pp $71 | -0.5pp $-18 | base $-110 | +0.5pp $-203 | +1.0pp $-298 |
UW: 25.0% down · 7.5% · 30yr · 1.5% tax · 5.0% vac · 8.0% maint · 8.0% mgmt
Financing live
Cash to close
- Down payment
- $89,975
- Closing costs
- $10,797
- Reserves months
- —
- Total cash needed
- —
Loan-product check · same deal, 3 products live
Conventional
25% down · 7.5% · 30yr
- Down + closing
- —
- Monthly P&I
- —
- Monthly cashflow
- —
- DSCR
- —
- Eligible?
- —
Personal DTI + credit; lowest rate.
DSCR
20% down · 8.5% · 30yr
- Down + closing
- —
- Monthly P&I
- —
- Monthly cashflow
- —
- DSCR
- —
- Eligible?
- —
No personal income docs; deal must DSCR.
Hard money
10% down · 12.0% · 12mo
- Down + closing
- —
- Monthly P&I
- —
- Monthly cashflow
- —
- DSCR
- —
- Eligible?
- —
Short-term bridge; refi at stabilization.
Rent comps 4 comps
| Address | Beds | Baths | Sqft | Rent | $/sqft | DOM | Units | Dist |
|---|---|---|---|---|---|---|---|---|
| 1324 Biloxi St Hernando, MS | 3.0 | 2.0 | 1594 | $1,950 | $1.22 | 26d | 1 | 0.63mi |
| 947 Clubhouse Dr Hernando, MS | 4.0 | 2.0 | 1713 | $2,495 | $1.46 | 46d | 1 | 1.02mi |
| 272 Fairway Trace Dr Lot $3800 Hernando, MS | 4.0 | 2.0 | 2000 | $3,800 | $1.90 | 46d | 1 | 1.14mi |
| 1670 Timber Creek Dr Hernando, MS | 3.0 | 2.0 | 1672 | $1,945 | $1.16 | 46d | 1 | 1.16mi |
Listing history 9 events
-
2026-05-09status Pending 197-char remark
Show marketing remark (197 chars)
Attractive one-owner brick & siding low maintenance home. Just minutes from the historic Hernando town square. Interior has fresh new paint to brighten your home. This home is just like new!
-
2026-01-13status Active 197-char remark
Show marketing remark (197 chars)
Attractive one-owner brick & siding low maintenance home. Just minutes from the historic Hernando town square. Interior has fresh new paint to brighten your home. This home is just like new!
-
2026-01-01status Pending 197-char remark
Show marketing remark (197 chars)
Attractive one-owner brick & siding low maintenance home. Just minutes from the historic Hernando town square. Interior has fresh new paint to brighten your home. This home is just like new!
-
2025-11-26status Active 197-char remark
Show marketing remark (197 chars)
Attractive one-owner brick & siding low maintenance home. Just minutes from the historic Hernando town square. Interior has fresh new paint to brighten your home. This home is just like new!
-
2025-11-25historical 197-char remark
Show marketing remark (197 chars)
Attractive one-owner brick & siding low maintenance home. Just minutes from the historic Hernando town square. Interior has fresh new paint to brighten your home. This home is just like new!
-
2025-11-24$359,900 Active 197-char remark
Show marketing remark (197 chars)
Attractive one-owner brick & siding low maintenance home. Just minutes from the historic Hernando town square. Interior has fresh new paint to brighten your home. This home is just like new!
-
2013-02-11historical
-
2012-08-20$189,900
-
2012-08-01soldstatus
ⓘ Source: listings_history table (triggers on properties + properties_extension) + one-shot
backfill from property_details.listing_events for pre-trigger history.
Tax reassessment forecast MS · Resets to sale price
- Current annual tax
- $2,354 · $196/mo
- Projected year-2 tax
- $2,843 · $237/mo
- Expected delta
- +$489/yr (+$41/mo · 20.8%)
ⓘ Screening estimate from a state-policy table — verify with the county assessor before closing.
Climate risk First Street
- Flood 1/10 Low FEMA zone X (unshaded) · 0% chance over 30 yrs
- Wildfire 4/10 Moderate
- Heat 7/10 Severe 7 d/yr ≥109°F today · 22 d/yr by 30 yrs out
- Wind 4/10 Moderate 23% chance of damaging wind over 30 yrs
- Air quality 2/10 Low 2 unhealthy d/yr today · 2 by 30 yrs out
Nearby sold comps map
Loading sold comps map…
Walkable amenities ~0.75 mi
Loading nearby amenities…
Taxation est. · year 1
- Rental income
- $32,256
- − Mortgage interest
- −$20,160
- − Property taxes
- −$2,354
- − Insurance
- −$1,800
- − Repairs & maintenance
- −$2,581
- − Management
- −$2,581
- − Depreciation
- −$10,470
- Taxable loss
- −$7,688
- Est. tax savings @ 24.0%
- +$1,845
- After-tax cash flow
- $526/yr
For passive investors: Depreciation is non-cash, so a rental often shows a tax loss while cash-flowing — sheltering income. Rental losses are passive: they offset passive income freely, and up to $25,000/yr can offset ordinary (W-2) income if you actively participate and your MAGI is under $100k (phasing out to $0 by $150k); unused losses carry forward. On sale, claimed depreciation is recaptured at up to 25%, and gains may owe capital-gains tax (a 1031 exchange can defer both). Figures are a year-1 estimate at your 24.0% rate — not tax advice; consult a CPA.
Schools (NCES district)
- District
- Desoto County School District
- NCES district ID
- 2801320
- Math proficiency
- 48% ▼ -13.00%
- Reading proficiency
- 42% ▼ -6.00%
- Median HH income
- $59,272
- Composite
- 39.56/100
- National rank
- #3933
- State rank
- #20 of 130 in MS
Livability — Hernando
- Score
- 70/100
- State rank
- #44
- US rank
- #8034
Category grades
Schools grade is shown separately in the Schools card above.
Census & demographics
- Census place
- Hernando, MS
- County
- DeSoto County · 176,513 people
- City population
- 31,374
- Metro
- Memphis, TN-MS-AR
- Population (ZIP)
- 31,374
- Household income
- $93,583
- Rent vs Own
- Severe rent burden
- 24.0
Population outlook (DeSoto County) Hauer SSP2
- Today (2025)
- 203,338 people
- By 2030
- 217,692 · +7.1%
- By 2040
- 245,320 · +20.6%
- By 2050
- 270,133 · +32.8%
- By 2075
- 323,341 · +59.0%
- By 2100
- 348,742 · +71.5%
Race, ethnicity, and origin ACS 2023
- Neighborhood character
- Predominantly White (81%)
- Race & ethnicity
- White 81% Black 13% Two or more races 4% Hispanic / Latino 2%
- Common ancestry
- Italian 2% Serbian 2% Slovak 1%
- Foreign-born
- 2% · Canada
- Languages at home
- 98% English-only · Spanish 1% Arabic 1%
Political lean MEDSL · DeSoto
- 2024 margin
- Strong R (+24.1) · D 36.7% · R 60.8% · Other 2.5%
- 2008→2024 swing
- +14.2pp toward D · 2008: -38.2pp · 2024: -24.1pp
- All cycles
- 2024: R+24.1 2020: R+23.9 2016: R+34.8 2012: R+33.5 2008: R+38.2
Not yet ingested
- Civics
- —
Market trends
- HPI YoY
- ▼ -82.49%
- Current HPI
- 176.8843
- Rent YoY
- ▼ -0.43%
- Metro
- Memphis, TN-MS-AR
- State GDP YoY
- —
- F500 in state
- 0
Price history
+89.5% since first listed9 events — show timeline
- 2026-05-09 Pending — MLSU
- 2026-01-13 Relisted — MLSU
- 2026-01-01 Pending — MLSU
- 2025-11-26 Relisted — MLSU
- 2025-11-25 Listing Removed — MLSU
- 2025-11-24 Listed $359,900 MLSU
- 2013-02-11 Listing Removed — MLSU
- 2012-08-20 Listed $189,900 MLSU
- 2012-08-01 Sold (Public Records) — Public Records
Property tax history
+13.5%/yrLatest (2025): $2,354 · +15.9% YoY. Source: county tax records.
Cash-flow waterfall
monthlySold comps — $/sqft
last 12 mo · ≤1 miLoading sold comps…