 Fourplex
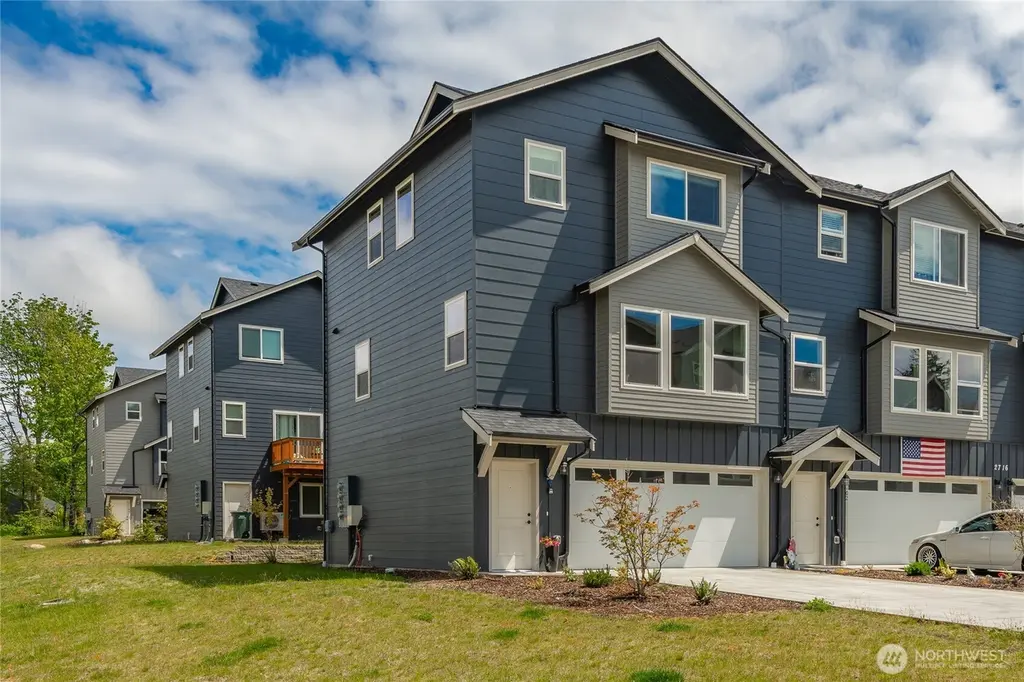
2966 Sweet Gum Loop · Blaine, WA
Flood risk No data
- FEMA flood zone
- —
- Chance of flooding over 30 yrs
- —
- Est. flood insurance / yr
- —
Fire risk No data
- Est. fire insurance / yr
- —
Heat risk No data
- Hot days now (above threshold)
- —
- Hot days in 30 yrs
- —
Wind risk No data
- Chance of severe wind over 30 yrs
- —
Air-quality risk No data
- Unhealthy air days now
- —
- Unhealthy air days in 30 yrs
- —
Risk factors via First Street. Map © Google.
Why this score? — see what drove the D- grade
The composite is a weighted blend of 9 inputs, each scored 0–100. Each bar is that input's sub-score; the figure is the points it added to the 100-point composite (weight × sub-score).
- Appreciation +10.0/10.0
- Cash flow +6.6/30.0
- ARV discount +4.9/15.0
- Schools +4.7/10.0
- Livability +3.9/5.0
- Rent growth +3.3/5.0
- Condition / age +2.5/5.0
- 1% rule +1.8/10.0
- DSCR +0.8/10.0
$1,575,000
🖨 Deal sheet (PDF) 📄 Offer letter ✓ Due diligence
Multi-family units
County records classify this as Multi-Family (2-4 Unit). Listing-text estimate: 4 units. confirmed
Listing remarks
This presale 4-plex at The Ridge presents a rare opportunity for both investors and owner-occupants seeking flexibility, location, and long-term value. Each unit includes a private single-car garage and a well-designed layout with the main living, dining, kitchen, and powder room located on the second level, creating an open and light-filled living space. Kitchens feature quartz countertops and durable luxury vinyl plank flooring throughout the main living areas. Each unit offers a primary bedroom with a walk-in closet and an ensuite bath, along with two additional guest bedrooms and a full bathroom, providing comfortable and functional living. Whether expanding an existing investment portf
Key facts
- Quartz countertops
- Well-designed layout
- Walk-in closet
Tags
Neighborhood map
What this means for you Summary
Snapshot
- This is a 4 × 3-bed/3.5-bath units multifamily listed at $1.57M.
Deal economics
- At list price, monthly cash flow is $-3k ($-31k/yr) — negative. Per door: $-654/mo.
- To cash-flow at today's rent, offer at most $1.20M (24.0% below list).
- To meet the 1% rule (rent ≥ 1% of price), the offer needs to be $1.06M (32.4% below list).
- Recommended offer: $1.06M (32.4% below list) — sets the bar for 1% rule.
- Cap rate 4.3% vs local median 2.1% in Blaine — top-decile yield for the area; either an underpriced asset or a hidden risk that comps aren't pricing in. Stress-test before assuming the spread holds.
Location & tenants
- Location reads 78/100 on livability (#125 in WA, #2,491 nationally) — a middle-class / working-renter tenant base. Strengths: commute A+, health & safety A+, housing A; Watch: amenities F, cost of living F.
- Blaine School District (town): math 49% / reading 55% proficiency, ranked #120 of 291 in WA (top 41%) — acceptable for families but not a draw, mixed tenant base, ~2y average lease.
- Market conditions: Rents rising (+3.1%/yr); 454 active listings in the ZIP; solid renter incomes; 1,190 units permitted in Whatcom County in 2024 (327 in 5+ unit buildings).
- At $10,646/mo this rent would consume 147% of the median local household income ($87k/yr) (locally 454% of renters already pay >50% of income on rent) — very limited rent-growth headroom before tenants either downsize or default.
Forward outlook
- In year one you build about $168k of equity ($11k loan paydown + $158k appreciation (10.0% local appreciation)).
- Whatcom County population projected at +28% by 2050 — long-run rental-demand tailwind backs the buy-and-hold thesis.
- By year 2, paydown + projected appreciation supports a ~$271k cash-out refi (75% LTV) — recoverable capital for the next deal without selling this one.
Negotiation context
- It's been on market 149 days — a 12% lower offer ($1.39M) is reasonable based on typical stale-listing flexibility.
Questions for the listing agent
- What do current leases actually rent for vs. the listed asking? Can we see a recent rent roll and the last 12 months of T-12 income?
- It's been on market 149 days. Have you received any prior offers? Is the seller open to a 32% concession, seller financing, or rate buy-down credit?
- Can we see the unit-by-unit rent roll, current vacancy, and any below-market leases? What's the average tenancy length?
- What capital expenditures (roof, boiler, parking lot, exteriors) have been made in the last 5 years, and what's planned in the next 2?
- What does the HOA fee cover, when was the last increase, and are there any pending special assessments or reserve-fund shortfalls?
- Why hasn't it sold? Are there any deal-killer items the seller is aware of (foundation, flood, title, zoning, code violations)?
- Is there a deadline driving the sale (1031 exchange, divorce, estate, relocation)? That informs how much negotiation room exists.
- Schools are B-rated — typically a magnet for longer-tenancy family renters. What's the average tenant stay here, and is there a school-zone premium baked into asking?
- The area grade is low — what's the realistic commute time and amenity access for the typical tenant pool here? Any planned neighborhood developments (good or bad) we should know about?
- What's the average days-on-market for RENTAL listings here right now (not sales)? A rising rental-DOM trend means longer vacancies and softer asking-rent achievability than the comps imply.
- What's the recent tenant-quality profile in this submarket — average credit score on applications, eviction rate, late-payment / NSF rate, and stable-employment percentage? A property-management company in the area should have these aggregated.
- How much new apartment / multifamily construction is in the pipeline within 1–3 miles? Heavy new supply (>2% of stock underway) typically softens rents 12–24 months out; light construction supports rent growth.
Investment metrics
- 1% rule
- 0.68% ✗
- Cap rate
- 4.30%
- Cash-on-cash
- -7.11%
- DSCR
- 0.68
- GRM
- 12.3
CMA / ARV
- ARV (median comp)
- $1,490,279
- List price
- $1,575,000
- Delta
- 5.68%
- Verdict
- FAIR
- Comps
- 1 within 2.0 mi
Projected returns pro-forma
10.0% appreciation · 3.1% rent growth · sell at horizon
- IRR
- 19.3%
- Equity multiple
- 2.57×
- Total profit
- $692,610
- Equity at exit
- $1,418,885
- IRR
- 17.8%
- Equity multiple
- 5.93×
- Total profit
- $2,173,229
- Equity at exit
- $3,059,879
Cash invested: $441,000 (down + closing). Projections, not guarantees.
Landlord ↔ Tenant lean methodology
- Overall (STATE)
- 28 Tenant-Leaning
- State Washington
- 28 Tenant-Leaning · D+8
- County
- — inherits STATE
- City
- — inherits STATE
ZIP-level market 98230
- Home prices YoY
- 14.0%
- Rents YoY
- 3.1%
- Active inventory
- 454
- Price-to-rent
- 49.3×
Monthly cashflow live
- Estimated rent
- $10,646 medium interval (Pro) →
- Mortgage (P&I)
- −$8,259
- Tax est. 1.5%
- −$1,969 /mo · $23,625/yr
- Insurance
- −$656
- HOA
- −$140
- Vacancy / Maint / Mgmt
- −$2,236
- Net cashflow
- $-2,614
Break-even live
Sensitivity live
| Price | -10% $-1,526 | -5% $-2,070 | +0% $-2,614 | +5% $-3,158 | +10% $-3,703 |
|---|---|---|---|---|---|
| Rent | -10% $-3,455 | -5% $-3,035 | +0% $-2,614 | +5% $-2,194 | +10% $-1,773 |
| Rate | -1.0pp $-1,821 | -0.5pp $-2,214 | base $-2,614 | +0.5pp $-3,022 | +1.0pp $-3,437 |
4-unit breakdown (identical units grouped — click to expand)
| Units | Beds | Baths | Est. rent |
|---|---|---|---|
| 4× units | 3 | 3.5 | $10,648 |
| #1 | 3 | 3.5 | $2,662 |
| #2 | 3 | 3.5 | $2,662 |
| #3 | 3 | 3.5 | $2,662 |
| #4 | 3 | 3.5 | $2,662 |
| Total (4 units) | $10,646 | ||
UW: 25.0% down · 7.5% · 30yr · 1.5% tax · 5.0% vac · 8.0% maint · 8.0% mgmt
Financing live
Cash to close
- Down payment
- $393,750
- Closing costs
- $47,250
- Reserves months
- —
- Total cash needed
- —
Loan-product check · same deal, 3 products live
Conventional
25% down · 7.5% · 30yr
- Down + closing
- —
- Monthly P&I
- —
- Monthly cashflow
- —
- DSCR
- —
- Eligible?
- —
Personal DTI + credit; lowest rate.
DSCR
20% down · 8.5% · 30yr
- Down + closing
- —
- Monthly P&I
- —
- Monthly cashflow
- —
- DSCR
- —
- Eligible?
- —
No personal income docs; deal must DSCR.
Hard money
10% down · 12.0% · 12mo
- Down + closing
- —
- Monthly P&I
- —
- Monthly cashflow
- —
- DSCR
- —
- Eligible?
- —
Short-term bridge; refi at stabilization.
HOA detail
- Monthly dues
- $140 · $1,680/yr
Listing history 16 events
-
2026-06-18days on market $1,575,000 Active 149 DOM
-
2026-06-17days on market $1,575,000 Active 148 DOM
-
2026-06-16days on market $1,575,000 Active 147 DOM
-
2026-06-15days on market $1,575,000 Active 146 DOM
-
2026-06-14days on market $1,575,000 Active 144 DOM
-
2026-06-13days on market $1,575,000 Active 143 DOM
-
2026-06-10days on market $1,575,000 Active 141 DOM
-
2026-06-09days on market $1,575,000 Active 140 DOM
-
2026-06-08days on market $1,575,000 Active 139 DOM
-
2026-06-07days on market $1,575,000 Active 138 DOM
-
2026-06-05days on market $1,575,000 Active 135 DOM
-
2026-06-02days on market $1,575,000 Active 133 DOM
-
2026-06-01days on market $1,575,000 Active 132 DOM
-
2026-05-31days on market $1,575,000 Active 131 DOM
-
2026-05-30days on market $1,575,000 Active 130 DOM
-
2026-01-20$1,575,000 Active
ⓘ Source: listings_history table (triggers on properties + properties_extension) + one-shot
backfill from property_details.listing_events for pre-trigger history.
Nearby sold comps map
Loading sold comps map…
Walkable amenities ~0.75 mi
Loading nearby amenities…
Taxation est. · year 1
- Rental income
- $127,752
- − Mortgage interest
- −$88,224
- − Property taxes
- −$23,625
- − Insurance
- −$7,875
- − Repairs & maintenance
- −$10,220
- − Management
- −$10,220
- − HOA
- −$1,680
- − Depreciation
- −$45,818
- Taxable loss
- −$59,911
- Est. tax savings @ 24.0%
- +$14,379
- After-tax cash flow
- $-16,991/yr
For passive investors: Depreciation is non-cash, so a rental often shows a tax loss while cash-flowing — sheltering income. Rental losses are passive: they offset passive income freely, and up to $25,000/yr can offset ordinary (W-2) income if you actively participate and your MAGI is under $100k (phasing out to $0 by $150k); unused losses carry forward. On sale, claimed depreciation is recaptured at up to 25%, and gains may owe capital-gains tax (a 1031 exchange can defer both). Figures are a year-1 estimate at your 24.0% rate — not tax advice; consult a CPA.
Schools (NCES district)
- District
- Blaine School District
- NCES district ID
- 5300570
- Math proficiency
- 49% ▼ -1.00%
- Reading proficiency
- 55% ▼ -2.00%
- Median HH income
- $57,085
- Composite
- 47.05/100
- National rank
- #5128
- State rank
- #120 of 291 in WA
Livability — Blaine
- Score
- 78/100
- State rank
- #125
- US rank
- #2491
Category grades
Schools grade is shown separately in the Schools card above.
Census & demographics
- Census place
- Blaine, WA
- County
- Whatcom County · 209,776 people
- Metro
- Bellingham, WA
- Population (ZIP)
- 18,744
- Household income
- $86,623
- Rent vs Own
- Severe rent burden
- 454.0
Population outlook (Whatcom County) Hauer SSP2
- Today (2025)
- 240,408 people
- By 2030
- 254,667 · +5.9%
- By 2040
- 281,365 · +17.0%
- By 2050
- 307,592 · +27.9%
- By 2075
- 375,576 · +56.2%
- By 2100
- 421,637 · +75.4%
Race, ethnicity, and origin ACS 2023
- Neighborhood character
- Predominantly White (77%)
- Race & ethnicity
- White 77% Two or more races 11% Hispanic / Latino 9% Asian 3% Pacific Islander 2% Black 1%
- Hispanic origin (detail)
- Mexican 5%
- Common ancestry
- Portuguese 6% Iranian 4% Lithuanian 3%
- Foreign-born
- 13% · Canada, China
- Languages at home
- 89% English-only · Spanish 4% Russian/Polish/Slavic 1% Other Indo-European 1%
Political lean MEDSL · Whatcom
- 2024 margin
- Strong D (+24.9) · D 60.8% · R 35.9% · Other 3.3%
- 2008→2024 swing
- +6.9pp toward D · 2008: 18.0pp · 2024: 24.9pp
- All cycles
- 2024: D+24.9 2020: D+23.9 2016: D+17.7 2012: D+12.1 2008: D+18.0
Not yet ingested
- Civics
- —
Market trends
- HPI YoY
- ▲ 106.58%
- Current HPI
- 868.68
- Rent YoY
- ▲ 3.10%
- Metro
- Bellingham, WA
- State GDP YoY
- ▲ 4.65%
- F500 in state
- 22
Industry mix (Fortune 500 HQ in WA)
| Industry | F500 HQs | Revenue |
|---|---|---|
| Retail | 2 | $269B |
|
||
| Technology / Retail | 1 | $638B |
|
||
| Technology | 1 | $245B |
|
||
| Telecommunications | 1 | $38B |
|
||
| Food / Beverage | 1 | $36B |
|
||
| Automotive / Trucks | 1 | $34B |
|
||
Price history
1 event — show timeline
- 2026-01-20 Listed $1,575,000 NWMLS as Distributed by MLS Grid
Cash-flow waterfall
monthlySold comps — $/sqft
last 12 mo · ≤1 miLoading sold comps…