 🏗️ New Construction
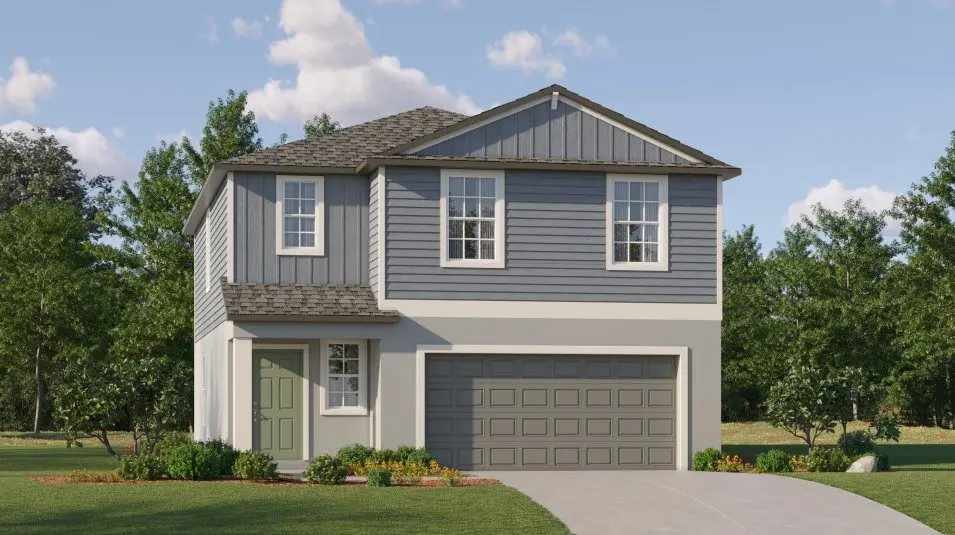
Atlanta Plan · Ellenton, FL
Flood risk No data
- FEMA flood zone
- —
- Chance of flooding over 30 yrs
- —
- Est. flood insurance / yr
- —
Fire risk No data
- Est. fire insurance / yr
- —
Heat risk No data
- Hot days now (above threshold)
- —
- Hot days in 30 yrs
- —
Wind risk No data
- Chance of severe wind over 30 yrs
- —
Air-quality risk No data
- Unhealthy air days now
- —
- Unhealthy air days in 30 yrs
- —
Risk factors via First Street. Map © Google.
Why this score? — see what drove the F grade
The composite is a weighted blend of 9 inputs, each scored 0–100. Each bar is that input's sub-score; the figure is the points it added to the 100-point composite (weight × sub-score).
- Cash flow +8.9/30.0
- ARV discount +7.5/15.0
- Schools +4.4/10.0
- Livability +3.8/5.0
- 1% rule +2.7/10.0
- DSCR +2.5/10.0
- Condition / age +2.5/5.0
- Rent growth +1.8/5.0
- Appreciation +0.0/10.0
$331,400
🖨 Deal sheet 📄 Offer letter ✓ Due diligence
Key facts
- 2 garage spots
- Listed 9 days
Property features AI
Finance
- Other: Living area approximately 1,870 (internal record); Address: 9032 Bay Leaf Dr, Parrish, FL 34219
- Financial info: List price $349,400
Exterior
- Home design: Single-family home (Atlanta plan); Active listing
- Construction: Built as part of new construction inventory
- Exterior features: Property is a new construction plan (Atlanta plan)
Interior
- Bedrooms: 4 bedrooms
- Bathrooms: 2 full bathrooms and 1 half bathroom (2.5 total)
- Interior features: Open plan living area
Neighborhood map
What this means for you Summary
Snapshot
- This is a 4-bed/2.5-bath single-family listed at $331k.
Deal economics
- At list price, monthly cash flow is $-300 ($-4k/yr) — negative.
- To cash-flow at today's rent, offer at most $331k (0.3% below list).
- To meet the 1% rule (rent ≥ 1% of price), the offer needs to be $289k (12.7% below list).
- Recommended offer: $289k (12.7% below list) — sets the bar for 1% rule.
Location & tenants
- Location reads 76/100 on livability (#232 in FL, #3,666 nationally) — a middle-class / working-renter tenant base. Strengths: cost of living A+, housing A+, health & safety A+; Watch: schools D+, amenities F, commute F.
- Manatee (suburban): math 54% / reading 50% proficiency, ranked #26 of 73 in FL (top 36%) — acceptable for families but not a draw, mixed tenant base, ~2y average lease.
- Market conditions: Rents soft (-3.0%/yr); 1160 active listings in the ZIP; 20 comparable units currently listed for rent nearby; rentals at typical pace (median 16d on market — plan ~3-4 weeks tenant-placement turnaround); solid renter incomes; 7,472 units permitted in Manatee County in 2024 (1,782 in 5+ unit buildings).
- This rent runs 45% of the median local income ($78k/yr) — at the standard rent-burdened threshold; future hikes will face affordability resistance.
Forward outlook
- Local home prices are declining (-3.0%/yr); year-one equity from $3k of loan paydown is wiped out by about $11k of value loss. Plan a longer hold.
- Manatee County population projected at +43% by 2050 — long-run rental-demand tailwind backs the buy-and-hold thesis.
Negotiation context
- Only 9 days on market — expect competitive offers; lowballing is unlikely to land.
Questions for the listing agent
- What do current leases actually rent for vs. the listed asking? Can we see a recent rent roll and the last 12 months of T-12 income?
- Is there a deadline driving the sale (1031 exchange, divorce, estate, relocation)? That informs how much negotiation room exists.
- Schools are D-rated, which usually means shorter tenancies and higher turnover. Who's the typical renter profile here, and what's been the actual vacancy rate?
- The area grade is low — what's the realistic commute time and amenity access for the typical tenant pool here? Any planned neighborhood developments (good or bad) we should know about?
- What's the average days-on-market for RENTAL listings here right now (not sales)? A rising rental-DOM trend means longer vacancies and softer asking-rent achievability than the comps imply.
- What's the recent tenant-quality profile in this submarket — average credit score on applications, eviction rate, late-payment / NSF rate, and stable-employment percentage? A property-management company in the area should have these aggregated.
- How much new for-sale + rental construction is in the pipeline within 1–3 miles? Heavy new supply typically softens prices + rents 12–24 months out; constrained supply supports both.
Investment metrics
- 1% rule
- 0.77% ✗
- Cap rate
- 5.33%
- Cash-on-cash
- -3.44%
- DSCR
- 0.85
- GRM
- 10.8
CMA / ARV
- ARV (on-the-fly)
- $374,000
- Comps found
- 12
Show comp detail 12 sales within ~0.75 mi
| Address | Dist | Beds/Ba | Sqft | Sold | Price | $/sf | Match |
|---|---|---|---|---|---|---|---|
| 8428 Sea Ray Run | 0.07mi | 4/2.5 | 1,870 (0%) | 12mo | $369,900 | $198 | 87 |
| 8444 Sea Ray Run | 0.09mi | 4/2.5 | 1,870 (0%) | 11mo | $379,900 | $203 | 87 |
| 8518 Sea Ray Run | 0.13mi | 4/2.5 | 1,870 (0%) | 10mo | $369,900 | $198 | 86 |
| 8520 Bella Mar Trl | 0.12mi | 4/2.0 | 1,817 (-3%) | 10mo | $364,300 | $200 | 79 |
| 8822 Bahama Mia Ln | 0.32mi | 4/2.0 | 1,828 (-2%) | 1mo | $362,000 | $198 | 79 |
| 8544 Bella Mar Trl | 0.16mi | 4/2.0 | 1,817 (-3%) | 10mo | $325,900 | $179 | 77 |
| 8548 Bella Mar Trl | 0.17mi | 4/2.0 | 1,936 (+4%) | 10mo | $334,150 | $173 | 76 |
| 9432 Bella Mar Trl | 0.33mi | 4/2.5 | 2,045 (+9%) | 1mo | $390,000 | $191 | 68 |
| 8808 Clear View St | 0.27mi | 4/2.0 | 1,665 (-11%) | 0mo | $334,000 | $201 | 67 |
| 9009 Sandy Shores St | 0.17mi | 3/2.0 (-1) | 1,657 (-11%) | 2mo | $400,000 | $241 | 64 |
| 9423 Bella Mar Trl | 0.37mi | 4/2.5 | 2,045 (+9%) | 4mo | $415,000 | $203 | 64 |
| 8814 Bahama Mia Ln | 0.30mi | 3/2.0 (-1) | 1,672 (-11%) | 1mo | $337,000 | $202 | 60 |
Match score weights: distance 35% · size 25% · config 20% · recency 20%. Top-matched comps best support the ARV.
Projected returns pro-forma
-3.0% appreciation · 0.0% rent growth · sell at horizon
- IRR
- -25.5%
- Equity multiple
- 0.16×
- Total profit
- $-88,154
- Equity at exit
- $55,765
- IRR
- -34.9%
- Equity multiple
- -0.28×
- Total profit
- $-133,955
- Equity at exit
- $32,337
Cash invested: $104,720 (down + closing). Projections, not guarantees.
Landlord ↔ Tenant lean methodology
- Overall (STATE)
- 87 Strongly Landlord-Friendly
- State Florida
- 87 Strongly Landlord-Friendly · R+3
- County
- — inherits STATE
- City
- — inherits STATE
ZIP-level market 34221
- Rents YoY
- -3.0%
- Active inventory
- 1160
- Price-to-rent
- 9.6×
Monthly cashflow live
- Estimated rent
- $2,892 high interval (Pro) →
- Mortgage (P&I)
- −$1,961
- Tax est. 1.5%
- −$468 /mo · $5,610/yr
- Insurance
- −$156
- HOA
- −$0
- Vacancy / Maint / Mgmt
- −$607
- Net cashflow
- $-300
Break-even live
UW: 25.0% down · 7.5% · 30yr · 1.5% tax · 5.0% vac · 8.0% maint · 8.0% mgmt
Financing live
Cash to close
- Down payment
- $93,500
- Closing costs
- $11,220
- Reserves months
- —
- Total cash needed
- —
Loan-product check · same deal, 3 products live
Conventional
25% down · 7.5% · 30yr
- Down + closing
- —
- Monthly P&I
- —
- Monthly cashflow
- —
- DSCR
- —
- Eligible?
- —
Personal DTI + credit; lowest rate.
DSCR
20% down · 8.5% · 30yr
- Down + closing
- —
- Monthly P&I
- —
- Monthly cashflow
- —
- DSCR
- —
- Eligible?
- —
No personal income docs; deal must DSCR.
Hard money
10% down · 12.0% · 12mo
- Down + closing
- —
- Monthly P&I
- —
- Monthly cashflow
- —
- DSCR
- —
- Eligible?
- —
Short-term bridge; refi at stabilization.
Rent comps 20 comps
| Address | Beds | Baths | Sqft | Rent | $/sqft | DOM | Units | Dist |
|---|---|---|---|---|---|---|---|---|
| 8505 Bella Mar Trl Parrish, FL | 4.0 | 2.5 | 1870 | $2,750 | $1.47 | 16d | 1 | 0.10mi |
| 9276 Bonita Mar Dr Parrish, FL | 4.0 | 2.5 | 2466 | $4,250 | $1.72 | 24d | 1 | 0.14mi |
| 8541 Bella Mar Trl Parrish, FL | 5.0 | 3.0 | 2389 | $2,800 | $1.17 | 10d | 1 | 0.16mi |
| 9224 Bonita Mar Dr Parrish, FL | 3.0 | 2.5 | 1799 | $2,290 | $1.27 | 24d | 1 | 0.16mi |
| 9207 Bonita Mar Dr Parrish, FL | 3.0 | 2.5 | 1666 | $2,275 | $1.37 | 24d | 1 | 0.19mi |
| 9432 Bella Mar Trl Parrish, FL | 4.0 | 2.5 | 2045 | $2,699 | $1.32 | 16d | 1 | 0.33mi |
| 9009 Moccasin Wallow Rd Parrish, FL | 3.0–4.0 | 2.5 | 1581 | $2,304 | $1.46 | 2d | 32 | 0.40mi |
| 9262 Gulf Haven Dr Palmetto, FL | 3.0 | 2.5 | 2043 | $2,750 | $1.35 | 14d | 1 | 0.42mi |
| 7566 Sea Oak Ct Palmetto, FL | 3.0 | 2.5 | 1807 | $2,700 | $1.49 | 21d | 1 | 0.50mi |
| 7562 Sea Oak Ct Palmetto, FL | 3.0 | 2.0 | 1433 | $2,400 | $1.67 | 21d | 1 | 0.50mi |
| 7122 87th Ln E Palmetto, FL | 4.0 | 2.0 | 1593 | $2,750 | $1.73 | 24d | 1 | 0.84mi |
| 10120 Abrazo DR Palmetto, FL | 1.0–3.0 | 1.0–2.5 | 1122 | $2,675 | $2.38 | 2d | 24 | 0.84mi |
| 9962 Last Light Gln Parrish, FL | 4.0 | 2.0 | 1740 | $2,495 | $1.43 | 3d | 1 | 0.96mi |
| 10225 Daybreak Gln Parrish, FL | 4.0 | 3.0 | 1978 | $2,600 | $1.31 | 3d | 1 | 1.14mi |
| 10455 Wet Marsh Cv Parrish, FL | 3.0 | 2.0 | 1635 | $2,650 | $1.62 | 10d | 1 | 1.30mi |
| 10416 High Noon Trl Parrish, FL | 3.0 | 2.0 | 1412 | $2,400 | $1.70 | 3d | 1 | 1.30mi |
| 8330 Abalone Loop Parrish, FL | 3.0 | 2.5 | 2473 | $2,900 | $1.17 | 16d | 1 | 1.31mi |
| 8132 Tea Olive Ter Palmetto, FL | 4.0 | 3.0 | 1698 | $2,500 | $1.47 | 24d | 1 | 1.34mi |
| 9544 Sandy Bluffs Cir Parrish, FL | 5.0 | 3.0 | 2557 | $2,950 | $1.15 | 3d | 1 | 1.37mi |
| 6210 Terra Lago Cir Palmetto, FL | 1.0–3.0 | 1.0–2.0 | 1015 | $2,405 | $2.37 | 3d | 50 | 1.49mi |
Listing history 14 events
-
2026-06-18days on market $331,400 Active 9 DOM
-
2026-06-17days on market $331,400 Active 8 DOM
-
2026-06-16days on market $331,400 Active 7 DOM
-
2026-06-15days on market $331,400 Active 6 DOM
-
2026-06-13days on market $331,400 Active 4 DOM
-
2026-06-13days on market $331,400 Active 3 DOM
-
2026-06-10pricedays on market $331,400 Active 1 DOM
-
2026-06-09days on market $359,400 Active 601 DOM
-
2026-06-08days on market $359,400 Active 600 DOM
-
2026-06-08days on market $359,400 Active 599 DOM
-
2026-06-03days on market $359,400 Active 595 DOM
-
2026-06-02days on market $359,400 Active 594 DOM
-
2026-06-01days on market $359,400 Active 593 DOM
-
2026-05-31days on market $359,400 Active 592 DOM
ⓘ Source: listings_history table (triggers on properties + properties_extension) + one-shot
backfill from property_details.listing_events for pre-trigger history.
Nearby sold comps map
Loading sold comps map…
Walkable amenities ~0.75 mi
Loading nearby amenities…
Taxation est. · year 1
- Rental income
- $34,700
- − Mortgage interest
- −$20,950
- − Property taxes
- −$5,610
- − Insurance
- −$1,870
- − Repairs & maintenance
- −$2,776
- − Management
- −$2,776
- − Depreciation
- −$10,880
- Taxable loss
- −$10,161
- Est. tax savings @ 24.0%
- +$2,439
- After-tax cash flow
- $-1,163/yr
For passive investors: Depreciation is non-cash, so a rental often shows a tax loss while cash-flowing — sheltering income. Rental losses are passive: they offset passive income freely, and up to $25,000/yr can offset ordinary (W-2) income if you actively participate and your MAGI is under $100k (phasing out to $0 by $150k); unused losses carry forward. On sale, claimed depreciation is recaptured at up to 25%, and gains may owe capital-gains tax (a 1031 exchange can defer both). Figures are a year-1 estimate at your 24.0% rate — not tax advice; consult a CPA.
Schools (NCES district)
- District
- Manatee
- NCES district ID
- 1201230
- Math proficiency
- 54% ▼ -6.00%
- Reading proficiency
- 50% ▼ -2.00%
- Median HH income
- $49,607
- Composite
- 44.43/100
- National rank
- #2806
- State rank
- #26 of 73 in FL
Livability — Ellenton
- Score
- 76/100
- State rank
- #232
- US rank
- #3666
Category grades
Schools grade is shown separately in the Schools card above.
Census & demographics
- County
- Manatee County · 416,364 people
- Metro
- North Port-Sarasota-Bradenton, FL
- Population (ZIP)
- 56,208
- Household income
- $77,712
- Rent vs Own
- Severe rent burden
- 1193.0
Population outlook (Manatee County) Hauer SSP2
- Today (2025)
- 447,342 people
- By 2030
- 488,911 · +9.3%
- By 2040
- 567,934 · +27.0%
- By 2050
- 637,995 · +42.6%
- By 2075
- 781,970 · +74.8%
- By 2100
- 848,272 · +89.6%
Race, ethnicity, and origin ACS 2023
- Neighborhood character
- Diverse neighborhood (Simpson 0.58)
- Race & ethnicity
- White 59% Hispanic / Latino 22% Black 14% Two or more races 11%
- Hispanic origin (detail)
- Mexican 14% Puerto Rican 3%
- Common ancestry
- Romanian 2% Lithuanian 2% Italian 2%
- Foreign-born
- 10% · Canada, Dominican Republic, Jamaica
- Languages at home
- 81% English-only · Spanish 16% Other Indo-European 1%
Political lean MEDSL · Manatee
- 2024 margin
- Strong R (+23.5) · D 37.9% · R 61.4%
- 2008→2024 swing
- -16.5pp toward R · 2008: -7.0pp · 2024: -23.5pp
- All cycles
- 2024: R+23.5 2020: R+16.1 2016: R+17.1 2012: R+12.5 2008: R+7.0
Not yet ingested
- Civics
- —
Market trends
- HPI YoY
- ▼ -383.53%
- Current HPI
- 302.1458
- Rent YoY
- ▼ -2.98%
- Metro
- North Port-Sarasota-Bradenton, FL
- State GDP YoY
- ▲ 3.28%
- F500 in state
- 36
Industry mix (Fortune 500 HQ in FL)
| Industry | F500 HQs | Revenue |
|---|---|---|
| Industrial Technology | 2 | $29B |
|
||
| Insurance | 2 | $17B |
|
||
| Retail | 1 | $60B |
|
||
| Technology Distribution | 1 | $58B |
|
||
| Homebuilding | 1 | $35B |
|
||
| Technology Manufacturing | 1 | $35B |
|
||
Cash-flow waterfall
monthlySold comps — $/sqft
last 12 mo · ≤1 miLoading sold comps…