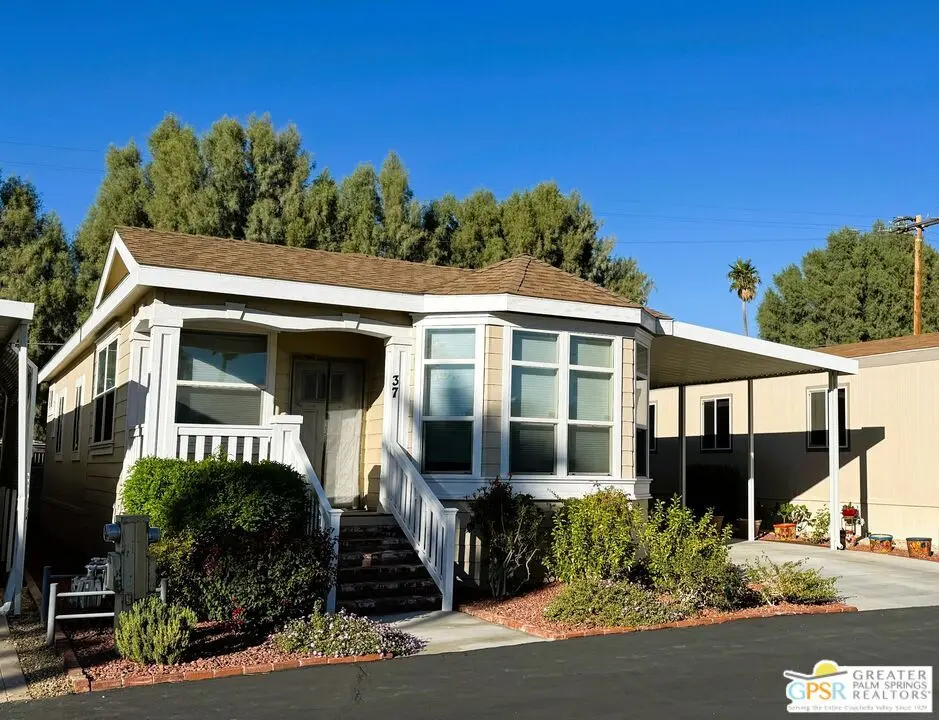
17640 Corkill Rd #37 · Desert Edge, CA
Flood risk 1/10 · Minimal
- FEMA flood zone
- X (unshaded)
- Chance of flooding over 30 yrs
- 0.0%
- Est. flood insurance / yr
- $507 – $1,088
Fire risk 5/10 · Moderate
- Est. fire insurance / yr
- $659 – $1,223
Heat risk 8/10 · Major
- Hot days now (above 109°F)
- 4 days/yr
- Hot days in 30 yrs
- 10 days/yr
Wind risk 1/10 · Minimal
- Chance of severe wind over 30 yrs
- —
Air-quality risk 5/10 · Moderate
- Unhealthy air days now
- 6 days/yr
- Unhealthy air days in 30 yrs
- 8 days/yr
Risk factors via First Street. Map © Google.
Why this score? — see what drove the C+ grade
The composite is a weighted blend of 9 inputs, each scored 0–100. Each bar is that input's sub-score; the figure is the points it added to the 100-point composite (weight × sub-score).
- Cash flow +25.8/30.0
- DSCR +8.6/10.0
- ARV discount +7.5/15.0
- 1% rule +6.8/10.0
- Condition / age +4.0/5.0
- Livability +3.4/5.0
- Schools +2.7/10.0
- Rent growth +2.5/5.0
- Appreciation +0.0/10.0
$149,000
🖨 Deal sheet (PDF) 📄 Offer letter ✓ Due diligence
Listing remarks MLS
Welcome to the beautiful quaint 55+ community of Corkill Palms. This home is only 6 years old and it has been very well maintained and it comes PARTIALLY FURNISHED! It has only been used as a seasonal home so there is very little wear and tear. There are 2 large bedrooms and 2 baths. High ceilings in living room and dining/kitchen area with a spacious open concept. Beautiful solid wood cabinets in kitchen and baths with laminate counters and higher grade appliances. The primary bedroom is large with lots of closet space with a closet organizer system. The second bedroom is extra large with office or craft space like the sellers are using it plus that has a closet organizer system as well. There is a cozy porch on the front of the house plus space under the 2-car carport perfect for patio furniture and outdoor dining. There is also a great storage shed there as well. Some doorways are extra wide for wheelchair accessibility. The home also has a sprinkler and fire alarm system. Relax in the Therapeutic Hot Natural Mineral Springs at the Clubhouse or have some fun on the putting green or in the billiard room located very close by. This home is very clean and move in ready. Buyers must be approved by park before opening escrow. Monthly space rent is approximately $540 but buyer will need to verity that with park manager as well as any utility charge amounts passed on to home owners. Contact us today to set up and appointment to see this wonderful home!
Key facts
- Solid wood cabinets
- Storage shed
- Completely furnished
Tags
Neighborhood map
What this means for you Summary
Snapshot
- This is a 2-bed/2.0-bath manufactured listed at $149k. Condition is rated good.
Deal economics
- At list price, monthly cash flow is $363 ($4k/yr) — positive.
- The deal already cash-flows at list — no discount required.
- Meets the 1% rule at list price ($2k rent vs $149k).
- Recommended offer: $131k (12.0% below list) — sets the bar for market timing.
- Cap rate 9.2% vs local median 14.6% in Desert Edge — below-typical yield; the buyer is paying a premium for something (appreciation thesis, condition, location) that the cap rate doesn't capture.
Location & tenants
- Location reads 68/100 on livability (#297 in CA) — a middle-class / working-renter tenant base. Strengths: cost of living A+, housing A+; Watch: crime C-, commute D-, employment F.
- Palm Springs Unified (suburban): math 21% / reading 42% proficiency, ranked #328 of 517 in CA (top 63%) — families likely to look elsewhere, expect single-tenant / working-renter base with shorter leases; 73% free/reduced lunch — lower-income household profile, screen leases tightly.
- Zoned schools: Julius Corsini Elementary (409 students, 98% FRL); Desert Springs Middle (803 students, 99% FRL); Desert Hot Springs High (math 27% / reading 52%, grade F, #532 of 1,170 statewide, top 48%, 1,742 students, 98% FRL) — zoned schools average 98% FRL vs 73% district-wide (25 pts higher); higher-poverty schools than district average — tighter screening recommended.
- Market conditions: 218 active listings in the ZIP; 6 comparable units currently listed for rent nearby; rentals lingering (median 46d on market — plan ~5-8 weeks vacancy on turnover, expect pricing pressure); 67% of comp listings sitting > 30 days — soft ceiling on asking rent; 9,195 units permitted in Riverside County in 2024 (1,512 in 5+ unit buildings).
Forward outlook
- Local home prices are declining (-3.0%/yr); year-one equity from $1k of loan paydown is wiped out by about $4k of value loss. Plan a longer hold.
- Riverside County population projected at +22% by 2050 — long-run rental-demand tailwind backs the buy-and-hold thesis.
Negotiation context
- It's been on market 225 days — a 12% lower offer ($131k) is reasonable based on typical stale-listing flexibility.
Risks & watch-outs
- Climate carrying-cost: moderate wildfire risk; extreme-heat days projected 4→10/yr by 2055 (HVAC capex compounding) — expect insurance premiums to compound above CPI over the hold.
Questions for the listing agent
- It's been on market 225 days. Have you received any prior offers? Is the seller open to a 12% concession, seller financing, or rate buy-down credit?
- Why hasn't it sold? Are there any deal-killer items the seller is aware of (foundation, flood, title, zoning, code violations)?
- Is there a deadline driving the sale (1031 exchange, divorce, estate, relocation)? That informs how much negotiation room exists.
- Schools are F-rated, which usually means shorter tenancies and higher turnover. Who's the typical renter profile here, and what's been the actual vacancy rate?
- What's the average days-on-market for RENTAL listings here right now (not sales)? A rising rental-DOM trend means longer vacancies and softer asking-rent achievability than the comps imply.
- What's the recent tenant-quality profile in this submarket — average credit score on applications, eviction rate, late-payment / NSF rate, and stable-employment percentage? A property-management company in the area should have these aggregated.
- How much new for-sale + rental construction is in the pipeline within 1–3 miles? Heavy new supply typically softens prices + rents 12–24 months out; constrained supply supports both.
Investment metrics
- 1% rule
- 1.18% ✓
- Cap rate
- 9.21%
- Cash-on-cash
- 10.43%
- DSCR
- 1.46
- GRM
- 7.0
CMA / ARV
- ARV (median comp)
- $70,000
- List price
- $149,000
- Delta
- 112.86%
- Verdict
- OVERPRICED
- Comps
- 20 within 1.0 mi
Show comp detail 12 sales within ~0.75 mi
| Address | Dist | Beds/Ba | Sqft | Sold | Price | $/sf | Match |
|---|---|---|---|---|---|---|---|
| 17640 Corkill #78 Rd | 0.00mi | 2/2.0 | 1,248 (+3%) | 1mo | $69,999 | $56 | 94 |
| 17640 Corkill Rd #27 | 0.00mi | 3/2.0 (+1) | 1,248 (+3%) | 7mo | $60,000 | $48 | 84 |
| 17640 Corkill Rd #74 | 0.00mi | 2/2.0 | 1,056 (-13%) | 2mo | $55,000 | $52 | 78 |
| 17555 Corkill Rd | 0.13mi | 2/2.0 | 1,344 (+11%) | 7mo | $105,000 | $78 | 69 |
| 17555 Corkill Rd #53 | 0.13mi | 3/2.0 (+1) | 1,056 (-13%) | 1mo | $70,000 | $66 | 67 |
| 17625 Langlois Rd Spc 13 | 0.33mi | 2/2.0 | 1,344 (+11%) | 0mo | $65,000 | $48 | 66 |
| 18070 Langlois #206 | 0.59mi | 2/2.0 | 1,250 (+3%) | 2mo | $185,000 | $148 | 66 |
| 69525 Dillon Rd #88 | 0.50mi | 3/2.0 (+1) | 1,248 (+3%) | 6mo | $180,000 | $144 | 61 |
| 18131 Langlois Rd Unit G-14 | 0.49mi | 2/1.5 | 1,104 (-9%) | 7mo | $55,000 | $50 | 55 |
| 69525 Dillon Rd #85 | 0.50mi | 2/2.0 | 1,050 (-13%) | 7mo | $119,000 | $113 | 48 |
| 17800 Langlois Rd #219 | 0.50mi | 2/2.0 | 1,040 (-14%) | 6mo | $42,500 | $41 | 48 |
| 16821 Lakeside Ct | 0.73mi | 3/2.0 (+1) | 1,368 (+13%) | 5mo | $170,000 | $124 | 35 |
Match score weights: distance 35% · size 25% · config 20% · recency 20%. Top-matched comps best support the ARV.
Projected returns pro-forma
-3.0% appreciation · 3.0% rent growth · sell at horizon
- IRR
- -0.6%
- Equity multiple
- 0.98×
- Total profit
- $-1,017
- Equity at exit
- $22,216
- IRR
- 9.0%
- Equity multiple
- 1.69×
- Total profit
- $28,969
- Equity at exit
- $12,883
Cash invested: $41,720 (down + closing). Projections, not guarantees.
Landlord ↔ Tenant lean methodology
- Overall (STATE)
- 18 Strongly Tenant-Friendly
- State California
- 18 Strongly Tenant-Friendly · D+13
- County
- — inherits STATE
- City
- — inherits STATE
ZIP-level market 92241
- Home prices YoY
- -22.8%
- Active inventory
- 218
- Price-to-rent
- 7.0×
Monthly cashflow live
- Estimated rent
- $1,763 high interval (Pro) →
- Mortgage (P&I)
- −$781
- Tax est. 1.5%
- −$186 /mo · $2,235/yr
- Insurance
- −$62
- HOA
- −$0
- Vacancy / Maint / Mgmt
- −$370
- Net cashflow
- $363
Break-even live
Sensitivity live
| Price | -10% $466 | -5% $414 | +0% $363 | +5% $311 | +10% $260 |
|---|---|---|---|---|---|
| Rent | -10% $223 | -5% $293 | +0% $363 | +5% $432 | +10% $502 |
| Rate | -1.0pp $438 | -0.5pp $401 | base $363 | +0.5pp $324 | +1.0pp $285 |
UW: 25.0% down · 7.5% · 30yr · 1.5% tax · 5.0% vac · 8.0% maint · 8.0% mgmt
Financing live
Cash to close
- Down payment
- $37,250
- Closing costs
- $4,470
- Reserves months
- —
- Total cash needed
- —
Loan-product check · same deal, 3 products live
Conventional
25% down · 7.5% · 30yr
- Down + closing
- —
- Monthly P&I
- —
- Monthly cashflow
- —
- DSCR
- —
- Eligible?
- —
Personal DTI + credit; lowest rate.
DSCR
20% down · 8.5% · 30yr
- Down + closing
- —
- Monthly P&I
- —
- Monthly cashflow
- —
- DSCR
- —
- Eligible?
- —
No personal income docs; deal must DSCR.
Hard money
10% down · 12.0% · 12mo
- Down + closing
- —
- Monthly P&I
- —
- Monthly cashflow
- —
- DSCR
- —
- Eligible?
- —
Short-term bridge; refi at stabilization.
Rent comps 6 comps
| Address | Beds | Baths | Sqft | Rent | $/sqft | DOM | Units | Dist |
|---|---|---|---|---|---|---|---|---|
| 18070 Langlois Rd Dsrt Hot Spgs, CA | 2.0 | 2.0 | 950 | $1,850 | $1.95 | 26d | 1 | 0.59mi |
| 18070 Langlois Rd Dsrt Hot Spgs, CA | 2.0 | 2.0 | 950 | $1,850 | $1.95 | 1d | 1 | 0.59mi |
| 18070 Langlois Rd #257 Desert Hot Springs, CA | 2.0 | 2.0 | 1056 | $1,850 | $1.75 | 45d | 1 | 0.59mi |
| 69510 Parkside Dr Desert Hot Springs, CA | 1.0 | 1.0 | 1150 | $1,450 | $1.26 | 45d | 1 | 0.77mi |
| 70875 Dillon Rd Desert Hot Springs, CA | 2.0 | 2.0 | 720 | $2,200 | $3.06 | 45d | 1 | 0.80mi |
| 69470 Midpark Dr Desert Hot Springs, CA | 1.0 | 1.0 | 1298 | $1,500 | $1.16 | 45d | 1 | 0.81mi |
Listing history 16 events
-
2026-06-21days on market $149,000 Active 225 DOM
-
2026-06-18days on market $149,000 Active 222 DOM
-
2026-06-17days on market $149,000 Active 221 DOM
-
2026-06-16days on market $149,000 Active 220 DOM
-
2026-06-15days on market $149,000 Active 219 DOM
-
2026-06-13days on market $149,000 Active 217 DOM
-
2026-06-13days on market $149,000 Active 216 DOM
-
2026-06-09days on market $149,000 Active 213 DOM
-
2026-06-08days on market $149,000 Active 212 DOM
-
2026-06-07days on market $149,000 Active 211 DOM
-
2026-06-04days on market $149,000 Active 208 DOM
-
2026-06-03days on market $149,000 Active 207 DOM
-
2026-06-02days on market $149,000 Active 206 DOM
-
2026-06-01days on market $149,000 Active 205 DOM
-
2026-05-31days on market $149,000 Active 204 DOM
-
2025-11-07$149,000 Active 1474-char remark
Show marketing remark (1474 chars)
Welcome to the beautiful quaint 55+ community of Corkill Palms. This home is only 6 years old and it has been very well maintained and it comes PARTIALLY FURNISHED! It has only been used as a seasonal home so there is very little wear and tear. There are 2 large bedrooms and 2 baths. High ceilings in living room and dining/kitchen area with a spacious open concept. Beautiful solid wood cabinets in kitchen and baths with laminate counters and higher grade appliances. The primary bedroom is large with lots of closet space with a closet organizer system. The second bedroom is extra large with office or craft space like the sellers are using it plus that has a closet organizer system as well. There is a cozy porch on the front of the house plus space under the 2-car carport perfect for patio furniture and outdoor dining. There is also a great storage shed there as well. Some doorways are extra wide for wheelchair accessibility. The home also has a sprinkler and fire alarm system. Relax in the Therapeutic Hot Natural Mineral Springs at the Clubhouse or have some fun on the putting green or in the billiard room located very close by. This home is very clean and move in ready. Buyers must be approved by park before opening escrow. Monthly space rent is approximately $540 but buyer will need to verity that with park manager as well as any utility charge amounts passed on to home owners. Contact us today to set up and appointment to see this wonderful home!
ⓘ Source: listings_history table (triggers on properties + properties_extension) + one-shot
backfill from property_details.listing_events for pre-trigger history.
Climate risk First Street
- Flood 1/10 Low FEMA zone X (unshaded) · 0% chance over 30 yrs
- Wildfire 5/10 Major
- Heat 8/10 Severe 4 d/yr ≥109°F today · 10 d/yr by 30 yrs out
- Wind 1/10 Low
- Air quality 5/10 Major 6 unhealthy d/yr today · 8 by 30 yrs out
Nearby sold comps map
Loading sold comps map…
Walkable amenities ~0.75 mi
Loading nearby amenities…
Taxation est. · year 1
- Rental income
- $21,151
- − Mortgage interest
- −$8,346
- − Property taxes
- −$2,235
- − Insurance
- −$745
- − Repairs & maintenance
- −$1,692
- − Management
- −$1,692
- − Depreciation
- −$4,335
- Taxable income
- $2,106
- Est. tax owed @ 24.0%
- −$505
- After-tax cash flow
- $3,847/yr
For passive investors: Depreciation is non-cash, so a rental often shows a tax loss while cash-flowing — sheltering income. Rental losses are passive: they offset passive income freely, and up to $25,000/yr can offset ordinary (W-2) income if you actively participate and your MAGI is under $100k (phasing out to $0 by $150k); unused losses carry forward. On sale, claimed depreciation is recaptured at up to 25%, and gains may owe capital-gains tax (a 1031 exchange can defer both). Figures are a year-1 estimate at your 24.0% rate — not tax advice; consult a CPA.
Condition & rehab AI · 12 photos
This 55+ community home is in good condition with minimal repairs needed. It offers a spacious layout and modern updates, making it a great investment opportunity.
Value-add opportunities
- Both Paint exterior trim — Enhances curb appeal and value
- Both Clean gutters — Improves drainage and property value
Renovation cost estimate screening
Value-add ROI direction
- Both Paint exterior trim — Enhances curb appeal and value ↑
- Both Clean gutters — Improves drainage and property value ↑
ⓘ Cost ranges are severity-bucket heuristics (US national rule-of-thumb). Get contractor quotes + a written scope before underwriting a rehab budget.
Schools (NCES district)
- District
- Palm Springs Unified
- NCES district ID
- 0629550
- Math proficiency
- 21% ▼ -7.00%
- Reading proficiency
- 42% ▬ 0.00%
- Median HH income
- $43,638
- Composite
- 26.76/100
- National rank
- #7131
- State rank
- #328 of 517 in CA
Livability — Desert Edge
- Score
- 68/100
- State rank
- #297
- US rank
- #9953
Category grades
Schools grade is shown separately in the Schools card above.
Census & demographics
- Census place
- Desert Edge, CA
- Population (ZIP)
- 8,624
Population outlook (Riverside County) Hauer SSP2
- Today (2025)
- 2,664,475 people
- By 2030
- 2,802,692 · +5.2%
- By 2040
- 3,050,904 · +14.5%
- By 2050
- 3,256,783 · +22.2%
- By 2075
- 3,655,058 · +37.2%
- By 2100
- 3,766,594 · +41.4%
Race, ethnicity, and origin ACS 2023
- Race & ethnicity
- White 50% Hispanic / Latino 46% Two or more races 16% Asian 2% Native American 1%
- Hispanic origin (detail)
- Mexican 36%
- Common ancestry
- Lithuanian 3% Slovak 2% Portuguese 2%
- Foreign-born
- 28% · Canada, South Korea
- Languages at home
- 57% English-only · Spanish 38% Chinese 1% Russian/Polish/Slavic 1%
Political lean MEDSL · Riverside
- 2024 margin
- Toss-up / Even · D 48.0% · R 49.3% · Other 2.6%
- 2008→2024 swing
- -3.6pp toward R · 2008: 2.3pp · 2024: -1.3pp
- All cycles
- 2024: R+1.3 2020: D+8.0 2016: D+4.3 2012: R+0.4 2008: D+2.3
Not yet ingested
- Civics
- —
Market trends
- HPI YoY
- ▼ -118.23%
- Current HPI
- 400.5663
- Rent YoY
- —
- Metro
- —
- State GDP YoY
- ▲ 3.21%
- F500 in state
- 116
Industry mix (Fortune 500 HQ in CA)
| Industry | F500 HQs | Revenue |
|---|---|---|
| Technology | 27 | $1,492B |
|
||
| Financial Services | 3 | $174B |
|
||
| Retail | 3 | $44B |
|
||
| Insurance | 3 | $26B |
|
||
| Media / Entertainment | 2 | $115B |
|
||
| Pharmaceuticals / Biotech | 2 | $62B |
|
||
Price history
1 event — show timeline
- 2025-11-07 Listed $149,000 TheMLS
Cash-flow waterfall
monthlySold comps — $/sqft
last 12 mo · ≤1 miLoading sold comps…