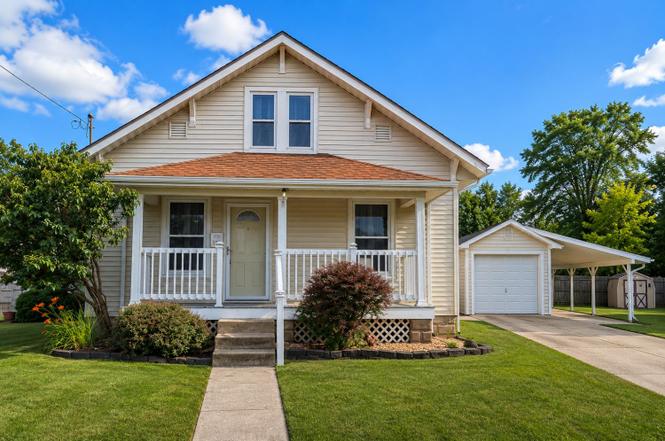
609 Myrtle Place Pl · Batesville, IN
Flood risk 1/10 · Minimal
- FEMA flood zone
- X (unshaded)
- Chance of flooding over 30 yrs
- 0.0%
- Est. flood insurance / yr
- $473 – $860
Fire risk 1/10 · Minimal
- Est. fire insurance / yr
- $717 – $1,331
Heat risk 4/10 · Minor
- Hot days now (above 100°F)
- 7 days/yr
- Hot days in 30 yrs
- 20 days/yr
Wind risk 2/10 · Minimal
- Chance of severe wind over 30 yrs
- 1.0%
Air-quality risk 2/10 · Minimal
- Unhealthy air days now
- 0 days/yr
- Unhealthy air days in 30 yrs
- 1 days/yr
Risk factors via First Street. Map © Google.
Why this score? — see what drove the D+ grade
The composite is a weighted blend of 9 inputs, each scored 0–100. Each bar is that input's sub-score; the figure is the points it added to the 100-point composite (weight × sub-score).
- Cash flow +20.0/30.0
- DSCR +6.4/10.0
- Schools +4.7/10.0
- 1% rule +4.1/10.0
- Livability +4.1/5.0
- ARV discount +3.7/15.0
- Rent growth +2.5/5.0
- Condition / age +2.5/5.0
- Appreciation +0.0/10.0
$225,000
🖨 Deal sheet (PDF) 📄 Offer letter ✓ Due diligence
Listing remarks
Charming 3-bedroom Craftsman bungalow offering classic character and practical living space. Beautiful hardwood floors and original built-ins add warmth and timeless appeal throughout the home. The main level includes a convenient first-floor bedroom, while the full unfinished basement provides abundant storage and potential for future use. Enjoy outdoor living from the spacious covered front porch or the rear deck overlooking the fenced backyard. Additional exterior features include a detached one-car garage with attached carport and a storage shed for tools and equipment. Conveniently located near a public park, this property offers easy access to outdoor recreation while maintainin
Key facts
- Covered front porch
- Original built-ins
- First-floor bedroom
Tags
Property features AI
Exterior
- Parking: 1-car garage; 1-car carport; Gravel and on-street parking available
- Utilities: Public water; Public sewer; Natural gas available
- Home design: Single family residence; One and one half levels; 1 story reported
- Construction: Vinyl siding
- Exterior features: Shingle roof; Shed(s) on the property; Publicly maintained road
Interior
- Kitchen: Range, Oven, Refrigerator
- Bedrooms: 6 total rooms (includes bedrooms and living spaces)
- Bathrooms: 1 full bathroom
- Heating & cooling: Forced air heating; Central air conditioning; Ceiling fans
- Interior features: Range, Oven, Refrigerator, Gas water heater; Full unfinished basement
- Laundry & utility: Gas water heater
Neighborhood map
What this means for you Summary
Snapshot
- This is a 3-bed/1.0-bath single-family listed at $225k.
Deal economics
- At list price, monthly cash flow is $278 ($3k/yr) — positive.
- The deal already cash-flows at list — no discount required.
- To meet the 1% rule (rent ≥ 1% of price), the offer needs to be $205k (8.7% below list).
- Recommended offer: $205k (8.7% below list) — sets the bar for 1% rule.
- Cap rate 7.8% vs local median 2.2% in Batesville — top-decile yield for the area; either an underpriced asset or a hidden risk that comps aren't pricing in. Stress-test before assuming the spread holds.
Location & tenants
- Location reads 82/100 on livability (#13 in IN, #1,187 nationally) — a professional / high-income tenant draw. Strengths: crime A+, cost of living A+, housing A+; Watch: employment C-, amenities F, commute F.
- Batesville Community School Corporation (rural): math 51% / reading 56% proficiency, ranked #33 of 301 in IN (top 11%) — acceptable for families but not a draw, mixed tenant base, ~2y average lease.
- Zoned schools: Batesville Primary School (547 students, 26% FRL); Batesville Middle School (math 42% / reading 56%, grade C-, #53 of 330 statewide, top 16%, 487 students, 30% FRL); Batesville High School (math 57% / reading 72%, grade B-, #34 of 369 statewide, top 10%, 715 students, 23% FRL).
- Market conditions: 83 active listings in the ZIP; 2 comparable units currently listed for rent nearby; 110 units permitted in Ripley County in 2024 (0 in 5+ unit buildings).
Forward outlook
- Local home prices are declining (-3.0%/yr); year-one equity from $2k of loan paydown is wiped out by about $7k of value loss. Plan a longer hold.
- Ripley County population projected at -10% by 2050 — secular population decline; favor cash flow + early exit over multi-decade hold.
Negotiation context
- Only 5 days on market — expect competitive offers; lowballing is unlikely to land.
Risks & watch-outs
- Watch-outs: built in 1917 — expect roof / HVAC / electrical / plumbing capex.
Questions for the listing agent
- Built in 1917 — when were the roof, HVAC, electrical panel, plumbing, and water heater last replaced?
- Is there a deadline driving the sale (1031 exchange, divorce, estate, relocation)? That informs how much negotiation room exists.
- Schools are B-rated — typically a magnet for longer-tenancy family renters. What's the average tenant stay here, and is there a school-zone premium baked into asking?
- The area grade is low — what's the realistic commute time and amenity access for the typical tenant pool here? Any planned neighborhood developments (good or bad) we should know about?
- What's the average days-on-market for RENTAL listings here right now (not sales)? A rising rental-DOM trend means longer vacancies and softer asking-rent achievability than the comps imply.
- What's the recent tenant-quality profile in this submarket — average credit score on applications, eviction rate, late-payment / NSF rate, and stable-employment percentage? A property-management company in the area should have these aggregated.
- How much new for-sale + rental construction is in the pipeline within 1–3 miles? Heavy new supply typically softens prices + rents 12–24 months out; constrained supply supports both.
Investment metrics
- 1% rule
- 0.91% ✗
- Cap rate
- 7.77%
- Cash-on-cash
- 5.29%
- DSCR
- 1.24
- GRM
- 9.1
CMA / ARV
- ARV (on-the-fly)
- $207,480
- Comps found
- 12
Show comp detail 12 sales within ~0.75 mi
| Address | Dist | Beds/Ba | Sqft | Sold | Price | $/sf | Match |
|---|---|---|---|---|---|---|---|
| 405 Liberty St | 0.04mi | 3/1.0 | 1,589 (+2%) | 2mo | $237,000 | $149 | 94 |
| 312 S Eastern Ave | 0.12mi | 3/2.0 | 1,750 (+12%) | 4mo | $222,000 | $127 | 66 |
| 517 Western Ave | 0.10mi | 2/1.0 (-1) | 1,712 (+10%) | 11mo | $175,000 | $102 | 65 |
| 585 Cedar Ln | 0.70mi | 3/2.0 | 1,559 (-0%) | 1mo | $263,000 | $169 | 62 |
| 320 N Park Ave | 0.47mi | 3/1.0 | 1,554 (-0%) | 19mo | $200,000 | $129 | 61 |
| 323 S Walnut St | 0.47mi | 3/2.0 | 1,698 (+9%) | 2mo | $215,000 | $127 | 58 |
| 323 S Park Ave | 0.25mi | 4/2.0 (+1) | 1,672 (+7%) | 13mo | $222,000 | $133 | 56 |
| 24 Helena St | 0.50mi | 3/2.0 | 1,620 (+4%) | 13mo | $205,000 | $127 | 55 |
| 160 N Township Line Rd | 0.58mi | 3/2.5 | 1,545 (-1%) | 15mo | $339,000 | $219 | 53 |
| 304 N Park Ave | 0.43mi | 2/1.0 (-1) | 1,735 (+11%) | 9mo | $220,000 | $127 | 49 |
| 829 S Park Ave | 0.41mi | 3/2.0 | 1,440 (-8%) | 19mo | $245,000 | $170 | 48 |
| 559 Cedar Ln | 0.67mi | 3/3.0 | 1,635 (+5%) | 12mo | $275,000 | $168 | 42 |
Match score weights: distance 35% · size 25% · config 20% · recency 20%. Top-matched comps best support the ARV.
Projected returns pro-forma
-3.0% appreciation · 3.0% rent growth · sell at horizon
- IRR
- -8.1%
- Equity multiple
- 0.70×
- Total profit
- $-18,875
- Equity at exit
- $33,548
- IRR
- 1.3%
- Equity multiple
- 1.09×
- Total profit
- $5,933
- Equity at exit
- $19,454
Cash invested: $63,000 (down + closing). Projections, not guarantees.
Landlord ↔ Tenant lean methodology
- Overall (STATE)
- 90 Strongly Landlord-Friendly
- State Indiana
- 90 Strongly Landlord-Friendly · R+11
- County
- — inherits STATE
- City
- — inherits STATE
ZIP-level market 47006
- Active inventory
- 83
- Price-to-rent
- 9.1×
Monthly cashflow live
- Estimated rent
- $2,053 medium interval (Pro) →
- Mortgage (P&I)
- −$1,180
- Tax from tax record
- −$71 /mo · $849/yr
- Insurance
- −$94
- HOA
- −$0
- Vacancy / Maint / Mgmt
- −$431
- Net cashflow
- $278
Break-even live
Sensitivity live
| Price | -10% $405 | -5% $341 | +0% $278 | +5% $214 | +10% $150 |
|---|---|---|---|---|---|
| Rent | -10% $115 | -5% $197 | +0% $278 | +5% $359 | +10% $440 |
| Rate | -1.0pp $391 | -0.5pp $335 | base $278 | +0.5pp $219 | +1.0pp $160 |
UW: 25.0% down · 7.5% · 30yr · 1.5% tax · 5.0% vac · 8.0% maint · 8.0% mgmt
Financing live
Cash to close
- Down payment
- $56,250
- Closing costs
- $6,750
- Reserves months
- —
- Total cash needed
- —
Loan-product check · same deal, 3 products live
Conventional
25% down · 7.5% · 30yr
- Down + closing
- —
- Monthly P&I
- —
- Monthly cashflow
- —
- DSCR
- —
- Eligible?
- —
Personal DTI + credit; lowest rate.
DSCR
20% down · 8.5% · 30yr
- Down + closing
- —
- Monthly P&I
- —
- Monthly cashflow
- —
- DSCR
- —
- Eligible?
- —
No personal income docs; deal must DSCR.
Hard money
10% down · 12.0% · 12mo
- Down + closing
- —
- Monthly P&I
- —
- Monthly cashflow
- —
- DSCR
- —
- Eligible?
- —
Short-term bridge; refi at stabilization.
Rent comps 2 comps
| Address | Beds | Baths | Sqft | Rent | $/sqft | DOM | Units | Dist |
|---|---|---|---|---|---|---|---|---|
| 1139 Tekulve Rd Batesville, IN | 1.0–3.0 | 1.0–1.5 | 975 | $1,300 | $1.33 | 26d | 4 | 0.58mi |
| 815 W Pearl St Batesville, IN | 2.0 | 1.5 | 1150 | $2,995 | $2.60 | 26d | 1 | 0.86mi |
Listing history 5 events
-
2026-06-21days on market $225,000 Active 5 DOM
-
2026-06-21days on market $225,000 Active 4 DOM
-
2026-06-18days on market $225,000 Active 2 DOM
-
2026-06-17remarks 699-char remark
-
2026-06-17$225,000 Active 1 DOM
ⓘ Source: listings_history table (triggers on properties + properties_extension) + one-shot
backfill from property_details.listing_events for pre-trigger history.
Tax reassessment forecast IN · Partial reset (capped growth)
- Current annual tax
- $849 · $71/mo
- Projected year-2 tax
- $1,381 · $115/mo
- Expected delta
- +$532/yr (+$44/mo · 62.7%)
ⓘ Screening estimate from a state-policy table — verify with the county assessor before closing.
Climate risk First Street
- Flood 1/10 Low FEMA zone X (unshaded) · 0% chance over 30 yrs
- Wildfire 1/10 Low
- Heat 4/10 Moderate 7 d/yr ≥100°F today · 20 d/yr by 30 yrs out
- Wind 2/10 Low 100% chance of damaging wind over 30 yrs
- Air quality 2/10 Low 0 unhealthy d/yr today · 1 by 30 yrs out
Nearby sold comps map
Loading sold comps map…
Walkable amenities ~0.75 mi
Loading nearby amenities…
Taxation est. · year 1
- Rental income
- $24,638
- − Mortgage interest
- −$12,603
- − Property taxes
- −$849
- − Insurance
- −$1,125
- − Repairs & maintenance
- −$1,971
- − Management
- −$1,971
- − Depreciation
- −$6,545
- Taxable loss
- −$426
- Est. tax savings @ 24.0%
- +$102
- After-tax cash flow
- $3,434/yr
For passive investors: Depreciation is non-cash, so a rental often shows a tax loss while cash-flowing — sheltering income. Rental losses are passive: they offset passive income freely, and up to $25,000/yr can offset ordinary (W-2) income if you actively participate and your MAGI is under $100k (phasing out to $0 by $150k); unused losses carry forward. On sale, claimed depreciation is recaptured at up to 25%, and gains may owe capital-gains tax (a 1031 exchange can defer both). Figures are a year-1 estimate at your 24.0% rate — not tax advice; consult a CPA.
Schools (NCES district)
- District
- Batesville Community School Corporation
- NCES district ID
- 1800390
- Math proficiency
- 51% ▼ -6.00%
- Reading proficiency
- 56% ▼ -6.00%
- Median HH income
- $61,570
- Composite
- 46.78/100
- National rank
- #2384
- State rank
- #33 of 301 in IN
Livability — Batesville
- Score
- 82/100
- State rank
- #13
- US rank
- #1187
Category grades
Schools grade is shown separately in the Schools card above.
Census & demographics
- Census place
- Batesville, IN
- City population
- 12,607
- Population (ZIP)
- 12,607
Population outlook (Ripley County) Hauer SSP2
- Today (2025)
- 28,713 people
- By 2030
- 28,400 · -1.1%
- By 2040
- 27,288 · -5.0%
- By 2050
- 25,691 · -10.5%
- By 2075
- 22,222 · -22.6%
- By 2100
- 17,965 · -37.4%
Race, ethnicity, and origin ACS 2023
- Neighborhood character
- Predominantly White (94%)
- Race & ethnicity
- White 94% Hispanic / Latino 3% Two or more races 2%
- Common ancestry
- Lithuanian 4% Slovak 1% Iranian 1%
- Foreign-born
- 1% · Canada
- Languages at home
- 99% English-only · Spanish 1%
Political lean MEDSL · Ripley
- 2024 margin
- Solid R (+61.5) · D 18.6% · R 80.1% · Other 1.2%
- 2008→2024 swing
- -31.9pp toward R · 2008: -29.6pp · 2024: -61.5pp
- All cycles
- 2024: R+61.5 2020: R+59.5 2016: R+57.4 2012: R+38.6 2008: R+29.6
Not yet ingested
- Civics
- —
Market trends
- HPI YoY
- ▼ -109.15%
- Current HPI
- 202.3679
- Rent YoY
- —
- Metro
- —
- State GDP YoY
- ▲ 2.90%
- F500 in state
- 18
Industry mix (Fortune 500 HQ in IN)
| Industry | F500 HQs | Revenue |
|---|---|---|
| Industrial Machinery | 2 | $37B |
|
||
| Healthcare | 1 | $177B |
|
||
| Pharmaceuticals | 1 | $45B |
|
||
| Metals / Steel | 1 | $18B |
|
||
| Agriculture | 1 | $17B |
|
||
| Packaging | 1 | $12B |
|
||
Price history
1 event — show timeline
- 2026-06-16 Listed $225,000 SEIBR
Property tax history
+4.7%/yrLatest (2024): $849 · +20.3% YoY. Source: county tax records.
Cash-flow waterfall
monthlySold comps — $/sqft
last 12 mo · ≤1 miLoading sold comps…