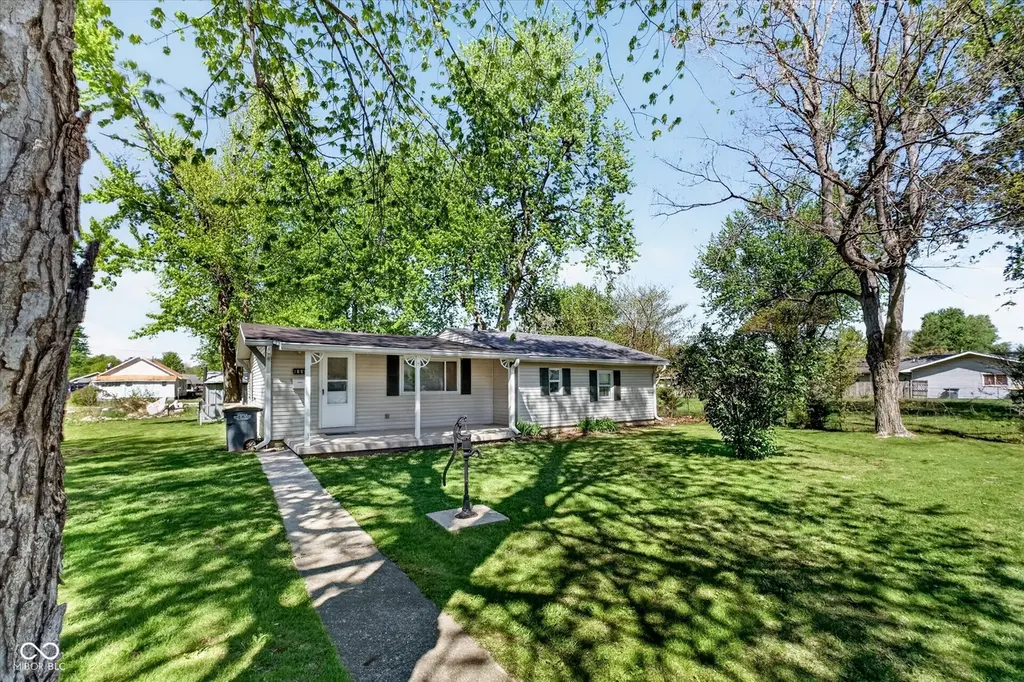
806 Oak St · Tipton, IN
Flood risk 1/10 · Minimal
- FEMA flood zone
- X (unshaded)
- Chance of flooding over 30 yrs
- 0.0%
- Est. flood insurance / yr
- $507 – $1,088
Fire risk 1/10 · Minimal
- Est. fire insurance / yr
- $717 – $1,331
Heat risk 3/10 · Minor
- Hot days now (above 100°F)
- 7 days/yr
- Hot days in 30 yrs
- 18 days/yr
Wind risk 2/10 · Minimal
- Chance of severe wind over 30 yrs
- 0.0%
Air-quality risk 3/10 · Minor
- Unhealthy air days now
- 2 days/yr
- Unhealthy air days in 30 yrs
- 4 days/yr
Risk factors via First Street. Map © Google.
Why this score? — see what drove the D grade
The composite is a weighted blend of 9 inputs, each scored 0–100. Each bar is that input's sub-score; the figure is the points it added to the 100-point composite (weight × sub-score).
- Cash flow +16.3/30.0
- DSCR +5.0/10.0
- ARV discount +4.9/15.0
- Livability +4.0/5.0
- Schools +3.5/10.0
- 1% rule +3.4/10.0
- Rent growth +2.5/5.0
- Condition / age +2.5/5.0
- Appreciation +0.0/10.0
$162,500
🖨 Deal sheet (PDF) 📄 Offer letter ✓ Due diligence
Listing remarks MLS
2 bedroom, 1 bath home. Rubber roof approximately 2 years old. New ceramic tile in dining area. Refrigerator and range stay. W/D hookups in kitchen. Newer carpet. 2 open porches (East and West sides of home). Built-in storage area on back porch, with an additional 8x10 shed. Taxes show no exemptions. REALTOR has interest.
Key facts
- Covered front porch
- Open patio
- Eat-in kitchen
Tags
Property features AI
Exterior
- Parking: No designated parking
- Utilities: Public water; Municipal sewer; Electricity connected; Natural gas connected
- Home design: Single family residence; One story
- Construction: Vinyl siding; Block foundation
- Exterior features: Patio; Porch; Storage shed
Interior
- Kitchen: Gas oven; Range hood; Refrigerator
- Bedrooms: 2 bedrooms on the main level
- Bathrooms: 1 full bathroom (main level)
- Heating & cooling: Forced air heating (natural gas); Central air conditioning
- Interior features: Attic access
- Laundry & utility: Washer; Dryer; Gas water heater
Neighborhood map
What this means for you Summary
Snapshot
- This is a 2-bed/1.0-bath single-family listed at $162k.
Deal economics
- At list price, monthly cash flow is $89 ($1k/yr) — positive.
- The deal already cash-flows at list — no discount required.
- To meet the 1% rule (rent ≥ 1% of price), the offer needs to be $136k (16.5% below list).
- Recommended offer: $136k (16.5% below list) — sets the bar for 1% rule.
- Cap rate 6.9% vs local median 4.0% in Tipton — top-decile yield for the area; either an underpriced asset or a hidden risk that comps aren't pricing in. Stress-test before assuming the spread holds.
Location & tenants
- Location reads 81/100 on livability (#16 in IN, #1,419 nationally) — a professional / high-income tenant draw. Strengths: crime A+, cost of living A+, housing A+; Watch: commute F.
- Tipton Community School Corporation (town): math 38% / reading 43% proficiency, ranked #130 of 301 in IN (top 43%) — families likely to look elsewhere, expect single-tenant / working-renter base with shorter leases.
- Zoned schools: Tipton Elementary School (math 55% / reading 44%, grade D, #279 of 994 statewide, top 30%, 668 students, 48% FRL); Tipton Middle School (math 25% / reading 39%, grade F, #190 of 330 statewide, top 59%, 335 students, 44% FRL); Tipton High School (math 32% / reading 52%, grade F, #197 of 369 statewide, top 57%, 439 students, 33% FRL).
- Market conditions: 52 active listings in the ZIP; 4 comparable units currently listed for rent nearby; rentals at typical pace (median 26d on market — plan ~3-4 weeks tenant-placement turnaround); 32 units permitted in Tipton County in 2024 (0 in 5+ unit buildings).
Forward outlook
- Local home prices are declining (-3.0%/yr); year-one equity from $1k of loan paydown is wiped out by about $5k of value loss. Plan a longer hold.
- Tipton County population projected at -23% by 2050 — secular population decline; favor cash flow + early exit over multi-decade hold.
Negotiation context
- Only 11 days on market — expect competitive offers; lowballing is unlikely to land.
- 3 sale attempts since 9y ago with the ask held roughly flat each time — persistent listings suggest the price (not the market) is what's stuck; bring a comps-based counter.
- Current owner paid $59k; list at $162k implies a 176% gain — meaningful room to come down on a strong offer.
Risks & watch-outs
- Watch-outs: built in 1945 — expect roof / HVAC / electrical / plumbing capex.
Questions for the listing agent
- Built in 1945 — when were the roof, HVAC, electrical panel, plumbing, and water heater last replaced?
- Is there a deadline driving the sale (1031 exchange, divorce, estate, relocation)? That informs how much negotiation room exists.
- Schools are D-rated, which usually means shorter tenancies and higher turnover. Who's the typical renter profile here, and what's been the actual vacancy rate?
- The area grade is low — what's the realistic commute time and amenity access for the typical tenant pool here? Any planned neighborhood developments (good or bad) we should know about?
- What's the average days-on-market for RENTAL listings here right now (not sales)? A rising rental-DOM trend means longer vacancies and softer asking-rent achievability than the comps imply.
- What's the recent tenant-quality profile in this submarket — average credit score on applications, eviction rate, late-payment / NSF rate, and stable-employment percentage? A property-management company in the area should have these aggregated.
- How much new for-sale + rental construction is in the pipeline within 1–3 miles? Heavy new supply typically softens prices + rents 12–24 months out; constrained supply supports both.
Investment metrics
- 1% rule
- 0.84% ✗
- Cap rate
- 6.95%
- Cash-on-cash
- 2.34%
- DSCR
- 1.10
- GRM
- 10.0
CMA / ARV
- ARV (median comp)
- $153,495
- List price
- $162,500
- Delta
- 5.87%
- Verdict
- FAIR
- Comps
- 20 within 1.0 mi
Show comp detail 12 sales within ~0.75 mi
| Address | Dist | Beds/Ba | Sqft | Sold | Price | $/sf | Match |
|---|---|---|---|---|---|---|---|
| 911 N East St | 0.15mi | 2/1.0 | 1,046 (-1%) | 8mo | $157,000 | $150 | 85 |
| 814 Mill St | 0.07mi | 3/1.0 (+1) | 1,008 (-4%) | 1mo | $143,000 | $142 | 84 |
| 608 Mill St | 0.19mi | 3/1.0 (+1) | 1,091 (+3%) | 8mo | $185,000 | $170 | 74 |
| 812 Poplar St | 0.14mi | 2/1.0 | 1,152 (+9%) | 17mo | $114,000 | $99 | 64 |
| 721 Poplar St | 0.18mi | 3/1.0 (+1) | 912 (-14%) | 7mo | $113,900 | $125 | 58 |
| 229 E Washington St | 0.69mi | 2/1.0 | 1,064 (+1%) | 11mo | $118,000 | $111 | 57 |
| 120 W North St | 0.57mi | 2/1.5 | 1,098 (+4%) | 11mo | $104,900 | $96 | 56 |
| 823 N Independence St | 0.19mi | 3/1.0 (+1) | 1,200 (+14%) | 16mo | $140,000 | $117 | 50 |
| 304 Oak St | 0.56mi | 2/1.0 | 1,184 (+12%) | 6mo | $184,900 | $156 | 49 |
| 409 E Washington St | 0.67mi | 3/1.5 (+1) | 1,080 (+2%) | 12mo | $215,000 | $199 | 48 |
| 217 Mound St | 0.37mi | 2/1.0 | 936 (-11%) | 20mo | $90,000 | $96 | 48 |
| 1014 Lincoln Dr | 0.62mi | 1/1.0 (-1) | 1,161 (+10%) | 12mo | $165,000 | $142 | 39 |
Match score weights: distance 35% · size 25% · config 20% · recency 20%. Top-matched comps best support the ARV.
Projected returns pro-forma
-3.0% appreciation · 3.0% rent growth · sell at horizon
- IRR
- -12.6%
- Equity multiple
- 0.54×
- Total profit
- $-20,739
- Equity at exit
- $24,229
- IRR
- -3.7%
- Equity multiple
- 0.76×
- Total profit
- $-11,038
- Equity at exit
- $14,050
Cash invested: $45,500 (down + closing). Projections, not guarantees.
Landlord ↔ Tenant lean methodology
- Overall (STATE)
- 90 Strongly Landlord-Friendly
- State Indiana
- 90 Strongly Landlord-Friendly · R+11
- County
- — inherits STATE
- City
- — inherits STATE
ZIP-level market 46072
- Home prices YoY
- -28.7%
- Active inventory
- 52
- Price-to-rent
- 10.0×
Monthly cashflow live
- Estimated rent
- $1,358 medium interval (Pro) →
- Mortgage (P&I)
- −$852
- Tax from tax record
- −$64 /mo · $765/yr
- Insurance
- −$68
- HOA
- −$0
- Vacancy / Maint / Mgmt
- −$285
- Net cashflow
- $89
Break-even live
Sensitivity live
| Price | -10% $181 | -5% $135 | +0% $89 | +5% $43 | +10% $-3 |
|---|---|---|---|---|---|
| Rent | -10% $-18 | -5% $35 | +0% $89 | +5% $142 | +10% $196 |
| Rate | -1.0pp $171 | -0.5pp $130 | base $89 | +0.5pp $47 | +1.0pp $4 |
UW: 25.0% down · 7.5% · 30yr · 1.5% tax · 5.0% vac · 8.0% maint · 8.0% mgmt
Financing live
Cash to close
- Down payment
- $40,625
- Closing costs
- $4,875
- Reserves months
- —
- Total cash needed
- —
Loan-product check · same deal, 3 products live
Conventional
25% down · 7.5% · 30yr
- Down + closing
- —
- Monthly P&I
- —
- Monthly cashflow
- —
- DSCR
- —
- Eligible?
- —
Personal DTI + credit; lowest rate.
DSCR
20% down · 8.5% · 30yr
- Down + closing
- —
- Monthly P&I
- —
- Monthly cashflow
- —
- DSCR
- —
- Eligible?
- —
No personal income docs; deal must DSCR.
Hard money
10% down · 12.0% · 12mo
- Down + closing
- —
- Monthly P&I
- —
- Monthly cashflow
- —
- DSCR
- —
- Eligible?
- —
Short-term bridge; refi at stabilization.
Rent comps 4 comps
| Address | Beds | Baths | Sqft | Rent | $/sqft | DOM | Units | Dist |
|---|---|---|---|---|---|---|---|---|
| 836 Maple St Unit A Tipton, IN | 3.0 | 2.0 | 1050 | $1,595 | $1.52 | 25d | 1 | 0.09mi |
| 627 N Main St Tipton, IN | 1.0 | 1.0 | 900 | $795 | $0.88 | 45d | 1 | 0.28mi |
| 319 Terrace Ct Tipton, IN | 1.0–2.0 | 1.0 | 754 | $1,096 | $1.45 | 0d | 2 | 0.64mi |
| 501 Canterbury Ct Tipton, IN | 2.0–3.0 | 1.0–2.0 | 960 | $1,092 | $1.14 | 0d | 5 | 0.66mi |
Listing history 8 events
-
2026-05-03status Pending 1018-char remark
-
2026-04-22$162,500 Active 1018-char remark
-
2017-09-29soldstatus $58,900 Sold 323-char remark
Show marketing remark (324 chars)
2 bedroom, 1 bath home. Rubber roof approximately 2 years old. New ceramic tile in dining area. Refrigerator and range stay. W/ D hookups in kitchen. Newer carpet. 2 open porches (East and West sides of home). Built-in storage area on back porch, with an additional 8x10 shed. Taxes show no exemptions. REALTOR has interest.
-
2017-09-29soldstatus $58,900
Show marketing remark (324 chars)
2 bedroom, 1 bath home. Rubber roof approximately 2 years old. New ceramic tile in dining area. Refrigerator and range stay. W/ D hookups in kitchen. Newer carpet. 2 open porches (East and West sides of home). Built-in storage area on back porch, with an additional 8x10 shed. Taxes show no exemptions. REALTOR has interest.
-
2017-07-19$58,900 Active 323-char remark
Show marketing remark (323 chars)
2 bedroom, 1 bath home. Rubber roof approximately 2 years old. New ceramic tile in dining area. Refrigerator and range stay. W/D hookups in kitchen. Newer carpet. 2 open porches (East and West sides of home). Built-in storage area on back porch, with an additional 8x10 shed. Taxes show no exemptions. REALTOR has interest.
-
2017-07-12$58,900
Show marketing remark (324 chars)
2 bedroom, 1 bath home. Rubber roof approximately 2 years old. New ceramic tile in dining area. Refrigerator and range stay. W/ D hookups in kitchen. Newer carpet. 2 open porches (East and West sides of home). Built-in storage area on back porch, with an additional 8x10 shed. Taxes show no exemptions. REALTOR has interest.
-
2012-04-16soldstatus $54,272
-
2012-04-16soldstatus $54,272
ⓘ Source: listings_history table (triggers on properties + properties_extension) + one-shot
backfill from property_details.listing_events for pre-trigger history.
Tax reassessment forecast IN · Partial reset (capped growth)
- Current annual tax
- $765 · $64/mo
- Projected year-2 tax
- $1,073 · $89/mo
- Expected delta
- +$308/yr (+$26/mo · 40.3%)
ⓘ Screening estimate from a state-policy table — verify with the county assessor before closing.
Climate risk First Street
- Flood 1/10 Low FEMA zone X (unshaded) · 0% chance over 30 yrs
- Wildfire 1/10 Low
- Heat 3/10 Moderate 7 d/yr ≥100°F today · 18 d/yr by 30 yrs out
- Wind 2/10 Low 0% chance of damaging wind over 30 yrs
- Air quality 3/10 Moderate 2 unhealthy d/yr today · 4 by 30 yrs out
Nearby sold comps map
Loading sold comps map…
Walkable amenities ~0.75 mi
Loading nearby amenities…
Taxation est. · year 1
- Rental income
- $16,290
- − Mortgage interest
- −$9,103
- − Property taxes
- −$765
- − Insurance
- −$812
- − Repairs & maintenance
- −$1,303
- − Management
- −$1,303
- − Depreciation
- −$4,727
- Taxable loss
- −$1,723
- Est. tax savings @ 24.0%
- +$414
- After-tax cash flow
- $1,480/yr
For passive investors: Depreciation is non-cash, so a rental often shows a tax loss while cash-flowing — sheltering income. Rental losses are passive: they offset passive income freely, and up to $25,000/yr can offset ordinary (W-2) income if you actively participate and your MAGI is under $100k (phasing out to $0 by $150k); unused losses carry forward. On sale, claimed depreciation is recaptured at up to 25%, and gains may owe capital-gains tax (a 1031 exchange can defer both). Figures are a year-1 estimate at your 24.0% rate — not tax advice; consult a CPA.
Schools (NCES district)
- District
- Tipton Community School Corporation
- NCES district ID
- 1811400
- Math proficiency
- 38% ▼ -10.00%
- Reading proficiency
- 43% ▼ -9.00%
- Median HH income
- $51,073
- Composite
- 35.0/100
- National rank
- #5048
- State rank
- #130 of 301 in IN
Livability — Tipton
- Score
- 81/100
- State rank
- #16
- US rank
- #1419
Category grades
Schools grade is shown separately in the Schools card above.
Census & demographics
- Census place
- Tipton, IN
- Population (ZIP)
- 8,751
Population outlook (Tipton County) Hauer SSP2
- Today (2025)
- 14,332 people
- By 2030
- 13,717 · -4.3%
- By 2040
- 12,357 · -13.8%
- By 2050
- 11,032 · -23.0%
- By 2075
- 8,640 · -39.7%
- By 2100
- 6,544 · -54.3%
Race, ethnicity, and origin ACS 2023
- Neighborhood character
- Predominantly White (93%)
- Race & ethnicity
- White 93% Hispanic / Latino 4% Two or more races 3% Black 1%
- Common ancestry
- Italian 2% Slovak 2% Lithuanian 2%
- Foreign-born
- 2% · Canada
- Languages at home
- 97% English-only · Spanish 2%
Political lean MEDSL · Tipton
- 2024 margin
- Solid R (+50.8) · D 23.7% · R 74.5% · Other 1.7%
- 2008→2024 swing
- -35.5pp toward R · 2008: -15.4pp · 2024: -50.8pp
- All cycles
- 2024: R+50.8 2020: R+52.7 2016: R+53.3 2012: R+31.8 2008: R+15.4
Not yet ingested
- Civics
- —
Market trends
- HPI YoY
- ▼ -105.28%
- Current HPI
- 261.1877
- Rent YoY
- —
- Metro
- —
- State GDP YoY
- ▲ 2.90%
- F500 in state
- 18
Industry mix (Fortune 500 HQ in IN)
| Industry | F500 HQs | Revenue |
|---|---|---|
| Industrial Machinery | 2 | $37B |
|
||
| Healthcare | 1 | $177B |
|
||
| Pharmaceuticals | 1 | $45B |
|
||
| Metals / Steel | 1 | $18B |
|
||
| Agriculture | 1 | $17B |
|
||
| Packaging | 1 | $12B |
|
||
Price history
+199.4% since first listed8 events — show timeline
- 2026-05-03 Pending — MIBOR as Distributed by MLS Grid
- 2026-04-22 Listed $162,500 MIBOR as Distributed by MLS Grid
- 2017-09-29 Sold (MLS) $58,900 IRMLS
- 2017-09-29 Sold (MLS) $58,900 MIBOR as Distributed by MLS Grid
- 2017-07-19 Listed $58,900 MIBOR as Distributed by MLS Grid
- 2017-07-12 Listed $58,900 IRMLS
- 2012-04-16 Sold (Public Records) $54,272 Public Records
- 2012-04-16 Sold (Public Records) $54,272 Public Records
Property tax history
-7.5%/yrLatest (2024): $765 · +13.3% YoY. Source: county tax records.
Cash-flow waterfall
monthlySold comps — $/sqft
last 12 mo · ≤1 miLoading sold comps…