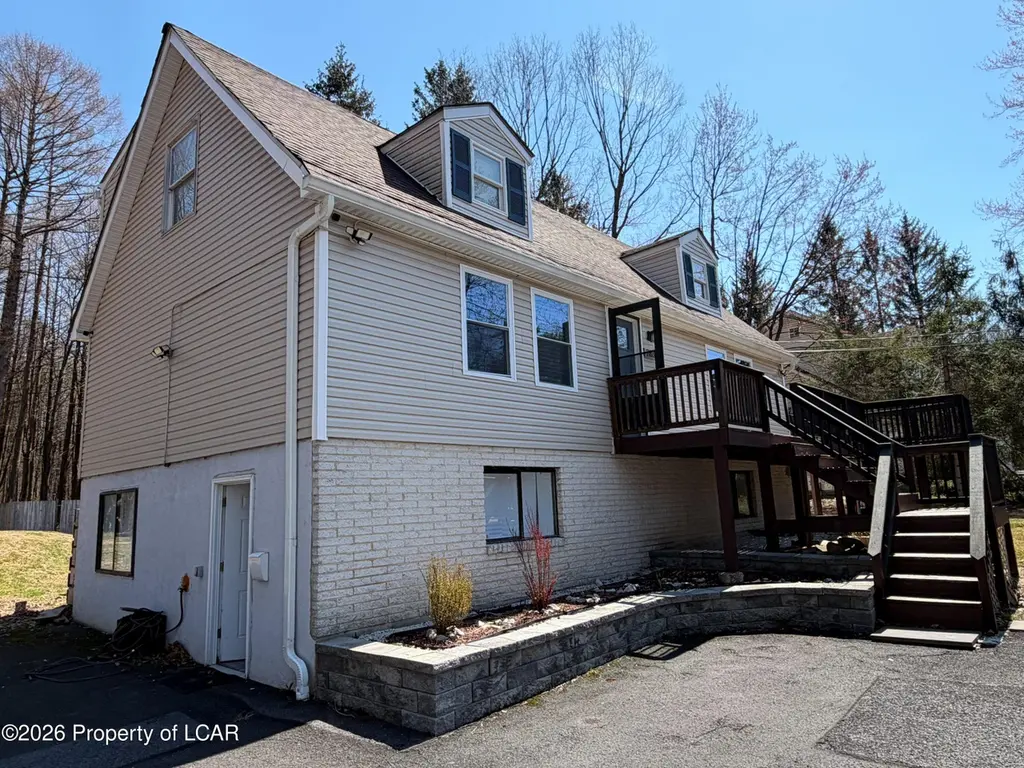
2832 Long Pond Rd · Tobyhanna, PA
Flood risk 1/10 · Minimal
- FEMA flood zone
- X (unshaded)
- Chance of flooding over 30 yrs
- 0.0%
- Est. flood insurance / yr
- $473 – $860
Fire risk 3/10 · Minor
- Est. fire insurance / yr
- $511 – $949
Heat risk 2/10 · Minimal
- Hot days now (above 90°F)
- 7 days/yr
- Hot days in 30 yrs
- 15 days/yr
Wind risk 4/10 · Minor
- Chance of severe wind over 30 yrs
- 7.0%
Air-quality risk 2/10 · Minimal
- Unhealthy air days now
- 1 days/yr
- Unhealthy air days in 30 yrs
- 2 days/yr
Risk factors via First Street. Map © Google.
Why this score? — see what drove the D grade
The composite is a weighted blend of 9 inputs, each scored 0–100. Each bar is that input's sub-score; the figure is the points it added to the 100-point composite (weight × sub-score).
- Cash flow +11.5/30.0
- ARV discount +8.4/15.0
- Appreciation +4.5/10.0
- Schools +4.0/10.0
- DSCR +3.4/10.0
- 1% rule +2.7/10.0
- Rent growth +2.5/5.0
- Livability +2.5/5.0
- Condition / age +2.5/5.0
$365,000
🖨 Deal sheet (PDF) 📄 Offer letter ✓ Due diligence
Listing remarks MLS
Cape Cod style home with endless possibilities! large living room, dining room with sliders, Master bedroom with private deck, 2 baths, front and rear decks and full unfinished basement. Community Amenities include: beaches, lakes, clubhouse and more!
Key facts
- Indoor pool
- Basketball courts
- 0.52 acre lot
Tags
Property features AI
Finance
- Financial info: Annual tax amount: $6,165
- HOA & community: Located in the Emerald Lakes subdivision
Exterior
- Utilities: Private well water
- Home design: Single-family residence; Two levels; Residential zoning
- Construction: Vinyl siding
- Exterior features: Balcony; Deck
Interior
- Bedrooms: 12 total rooms (bedroom count not specified)
- Flooring: Hardwood
- Bathrooms: 2 full bathrooms
- Heating & cooling: Electric baseboard heating
- Interior features: Hardwood flooring; Dining room fireplace; Finished basement
Neighborhood map
What this means for you Summary
Snapshot
- This is a 3-bed/2.0-bath single-family listed at $365k.
Deal economics
- At list price, monthly cash flow is $-119 ($-1k/yr) — negative.
- To cash-flow at today's rent, offer at most $344k (5.7% below list).
- To meet the 1% rule (rent ≥ 1% of price), the offer needs to be $282k (22.7% below list).
- Recommended offer: $282k (22.7% below list) — sets the bar for 1% rule.
Location & tenants
- Location reads: area grade D — affects rentability + tenant quality, not the cash-flow math above.
- Pocono Mountain SD (rural): math 37% / reading 55% proficiency, ranked #245 of 539 in PA (top 46%) — families likely to look elsewhere, expect single-tenant / working-renter base with shorter leases.
- Market conditions: 108 active listings in the ZIP; 2 comparable units currently listed for rent nearby; 278 units permitted in Monroe County in 2024 (52 in 5+ unit buildings).
Forward outlook
- Local home prices are declining (-0.9%/yr); year-one equity from $3k of loan paydown is wiped out by about $3k of value loss. Plan a longer hold.
- Monroe County population projected at -11% by 2050 — secular population decline; favor cash flow + early exit over multi-decade hold.
Negotiation context
- It's been on market 61 days — a 6% lower offer ($343k) is reasonable based on typical stale-listing flexibility.
- 3 sale attempts since 6y ago with the ask held roughly flat each time — persistent listings suggest the price (not the market) is what's stuck; bring a comps-based counter.
- Current owner paid $315k; 16% above their basis — modest negotiation headroom, anchor on the comps not their cost.
Questions for the listing agent
- What do current leases actually rent for vs. the listed asking? Can we see a recent rent roll and the last 12 months of T-12 income?
- It's been on market 61 days. Have you received any prior offers? Is the seller open to a 23% concession, seller financing, or rate buy-down credit?
- Why hasn't it sold? Are there any deal-killer items the seller is aware of (foundation, flood, title, zoning, code violations)?
- Is there a deadline driving the sale (1031 exchange, divorce, estate, relocation)? That informs how much negotiation room exists.
- The area grade is low — what's the realistic commute time and amenity access for the typical tenant pool here? Any planned neighborhood developments (good or bad) we should know about?
- What's the average days-on-market for RENTAL listings here right now (not sales)? A rising rental-DOM trend means longer vacancies and softer asking-rent achievability than the comps imply.
- What's the recent tenant-quality profile in this submarket — average credit score on applications, eviction rate, late-payment / NSF rate, and stable-employment percentage? A property-management company in the area should have these aggregated.
- How much new for-sale + rental construction is in the pipeline within 1–3 miles? Heavy new supply typically softens prices + rents 12–24 months out; constrained supply supports both.
Investment metrics
- 1% rule
- 0.77% ✗
- Cap rate
- 5.90%
- Cash-on-cash
- -1.39%
- DSCR
- 0.94
- GRM
- 10.8
CMA / ARV
- ARV (median comp)
- $372,834
- List price
- $365,000
- Delta
- -2.10%
- Verdict
- FAIR
- Comps
- 20 within 1.0 mi
Show comp detail 8 sales within ~0.75 mi
| Address | Dist | Beds/Ba | Sqft | Sold | Price | $/sf | Match |
|---|---|---|---|---|---|---|---|
| 2917 Long Pond Rd | 0.39mi | 3/1.5 | 1,696 (-4%) | 7mo | $339,000 | $200 | 68 |
| 273 Ash Dr | 0.59mi | 3/2.0 | 1,772 (+0%) | 21mo | $309,000 | $174 | 55 |
| 1025 Cricket Ln | 0.66mi | 3/2.0 | 1,916 (+9%) | 5mo | $305,000 | $159 | 50 |
| 394 Cedar Dr | 0.56mi | 3/2.0 | 1,632 (-8%) | 16mo | $275,000 | $169 | 48 |
| 1138 Horizon Dr | 0.75mi | 4/2.0 (+1) | 1,591 (-10%) | 1mo | $435,000 | $273 | 43 |
| 1728 Clover Rd | 0.62mi | 4/2.0 (+1) | 1,565 (-11%) | 23mo | $298,000 | $190 | 28 |
| 1728 Clover Rd | 0.62mi | 4/2.5 (+1) | 1,565 (-11%) | 23mo | $298,000 | $190 | 26 |
| 1648 Clover Rd | 0.72mi | 4/2.5 (+1) | 2,016 (+14%) | 17mo | $400,000 | $198 | 21 |
Match score weights: distance 35% · size 25% · config 20% · recency 20%. Top-matched comps best support the ARV.
Projected returns pro-forma
-0.95% appreciation · 3.0% rent growth · sell at horizon
- IRR
- -7.7%
- Equity multiple
- 0.66×
- Total profit
- $-34,241
- Equity at exit
- $89,021
- IRR
- -1.0%
- Equity multiple
- 0.91×
- Total profit
- $-9,184
- Equity at exit
- $94,260
Cash invested: $102,200 (down + closing). Projections, not guarantees.
Landlord ↔ Tenant lean methodology
- Overall (STATE)
- 62 Landlord-Friendly
- State Pennsylvania
- 62 Landlord-Friendly · EVEN
- County
- — inherits STATE
- City
- — inherits STATE
ZIP-level market 18334
- Home prices YoY
- -0.5%
- Active inventory
- 108
- Price-to-rent
- 10.8×
Monthly cashflow live
- Estimated rent
- $2,823 medium interval (Pro) →
- Mortgage (P&I)
- −$1,914
- Tax from tax record
- −$283 /mo · $3,390/yr
- Insurance
- −$152
- HOA
- −$0
- Vacancy / Maint / Mgmt
- −$593
- Net cashflow
- $-119
Break-even live
Sensitivity live
| Price | -10% $88 | -5% $-15 | +0% $-119 | +5% $-222 | +10% $-325 |
|---|---|---|---|---|---|
| Rent | -10% $-342 | -5% $-230 | +0% $-119 | +5% $-7 | +10% $104 |
| Rate | -1.0pp $65 | -0.5pp $-26 | base $-119 | +0.5pp $-213 | +1.0pp $-309 |
UW: 25.0% down · 7.5% · 30yr · 1.5% tax · 5.0% vac · 8.0% maint · 8.0% mgmt
Financing live
Cash to close
- Down payment
- $91,250
- Closing costs
- $10,950
- Reserves months
- —
- Total cash needed
- —
Loan-product check · same deal, 3 products live
Conventional
25% down · 7.5% · 30yr
- Down + closing
- —
- Monthly P&I
- —
- Monthly cashflow
- —
- DSCR
- —
- Eligible?
- —
Personal DTI + credit; lowest rate.
DSCR
20% down · 8.5% · 30yr
- Down + closing
- —
- Monthly P&I
- —
- Monthly cashflow
- —
- DSCR
- —
- Eligible?
- —
No personal income docs; deal must DSCR.
Hard money
10% down · 12.0% · 12mo
- Down + closing
- —
- Monthly P&I
- —
- Monthly cashflow
- —
- DSCR
- —
- Eligible?
- —
Short-term bridge; refi at stabilization.
Rent comps 2 comps
| Address | Beds | Baths | Sqft | Rent | $/sqft | DOM | Units | Dist |
|---|---|---|---|---|---|---|---|---|
| 2267 Doe Dr Long Pond, PA | 4.0 | 3.0 | 2000 | $2,700 | $1.35 | 45d | 1 | 0.45mi |
| 152 Granite Rd Long Pond, PA | 4.0 | 2.5 | 2624 | $3,300 | $1.26 | 45d | 1 | 1.32mi |
Listing history 24 events
-
2026-06-21days on market $365,000 Active 61 DOM
-
2026-06-19days on market $365,000 Active 59 DOM
-
2026-06-18days on market $365,000 Active 58 DOM
-
2026-06-17days on market $365,000 Active 57 DOM
-
2026-06-17price $365,000 Active 56 DOM
-
2026-06-16days on market $369,000 Active 56 DOM
-
2026-06-15days on market $369,000 Active 55 DOM
-
2026-06-14days on market $369,000 Active 53 DOM
-
2026-06-13days on market $369,000 Active 52 DOM
-
2026-06-10days on market $369,000 Active 50 DOM
-
2026-06-09days on market $369,000 Active 49 DOM
-
2026-06-08days on market $369,000 Active 48 DOM
-
2026-06-07days on market $369,000 Active 47 DOM
-
2026-06-02days on market $369,000 Active 42 DOM
-
2026-06-01days on market $369,000 Active 41 DOM
-
2026-05-31days on market $369,000 Active 40 DOM
-
2026-05-30days on market $369,000 Active 39 DOM
-
2026-04-21$369,000 Active 349-char remark
-
2026-02-16status Pending
-
2025-10-01$388,800 Active
-
2022-09-02soldstatus $315,000
-
2020-07-14soldstatus $78,000
Show marketing remark (251 chars)
Cape Cod style home with endless possibilities! large living room, dining room with sliders, Master bedroom with private deck, 2 baths, front and rear decks and full unfinished basement. Community Amenities include: beaches, lakes, clubhouse and more!
-
2020-06-05$67,000
Show marketing remark (251 chars)
Cape Cod style home with endless possibilities! large living room, dining room with sliders, Master bedroom with private deck, 2 baths, front and rear decks and full unfinished basement. Community Amenities include: beaches, lakes, clubhouse and more!
-
2004-10-27soldstatus $154,000
ⓘ Source: listings_history table (triggers on properties + properties_extension) + one-shot
backfill from property_details.listing_events for pre-trigger history.
Tax reassessment forecast PA · Partial reset (capped growth)
- Current annual tax
- $3,390 · $283/mo
- Projected year-2 tax
- $4,579 · $382/mo
- Expected delta
- +$1,188/yr (+$99/mo · 35.0%)
ⓘ Screening estimate from a state-policy table — verify with the county assessor before closing.
Climate risk First Street
- Flood 1/10 Low FEMA zone X (unshaded) · 0% chance over 30 yrs
- Wildfire 3/10 Moderate
- Heat 2/10 Low 7 d/yr ≥90°F today · 15 d/yr by 30 yrs out
- Wind 4/10 Moderate 7% chance of damaging wind over 30 yrs
- Air quality 2/10 Low 1 unhealthy d/yr today · 2 by 30 yrs out
Nearby sold comps map
Loading sold comps map…
Walkable amenities ~0.75 mi
Loading nearby amenities…
Taxation est. · year 1
- Rental income
- $33,875
- − Mortgage interest
- −$20,446
- − Property taxes
- −$3,390
- − Insurance
- −$1,825
- − Repairs & maintenance
- −$2,710
- − Management
- −$2,710
- − Depreciation
- −$10,618
- Taxable loss
- −$7,824
- Est. tax savings @ 24.0%
- +$1,878
- After-tax cash flow
- $455/yr
For passive investors: Depreciation is non-cash, so a rental often shows a tax loss while cash-flowing — sheltering income. Rental losses are passive: they offset passive income freely, and up to $25,000/yr can offset ordinary (W-2) income if you actively participate and your MAGI is under $100k (phasing out to $0 by $150k); unused losses carry forward. On sale, claimed depreciation is recaptured at up to 25%, and gains may owe capital-gains tax (a 1031 exchange can defer both). Figures are a year-1 estimate at your 24.0% rate — not tax advice; consult a CPA.
Schools (NCES district)
- District
- Pocono Mountain SD
- NCES district ID
- 4219500
- Math proficiency
- 37% ▼ -5.00%
- Reading proficiency
- 55% ▲ 1.00%
- Median HH income
- $55,317
- Composite
- 39.91/100
- National rank
- #3856
- State rank
- #245 of 539 in PA
Livability — Tobyhanna
No livability data for this city. (Only ~50 U.S. cities are tracked.)
Census & demographics
- Census place
- Emerald Lakes, PA
- Population (ZIP)
- 4,907
Population outlook (Monroe County) Hauer SSP2
- Today (2025)
- 164,099 people
- By 2030
- 161,412 · -1.6%
- By 2040
- 154,616 · -5.8%
- By 2050
- 146,710 · -10.6%
- By 2075
- 140,830 · -14.2%
- By 2100
- 138,472 · -15.6%
Race, ethnicity, and origin ACS 2023
- Neighborhood character
- Majority White (64%)
- Race & ethnicity
- White 64% Hispanic / Latino 20% Two or more races 12% Black 9%
- Hispanic origin (detail)
- Puerto Rican 17%
- Common ancestry
- Romanian 6% Lithuanian 4% Iranian 4%
- Foreign-born
- 8% · Canada
- Languages at home
- 87% English-only · Spanish 10% Russian/Polish/Slavic 3%
Political lean MEDSL · Monroe
- 2024 margin
- Toss-up / Even · D 49.1% · R 49.9%
- 2008→2024 swing
- -17.1pp toward R · 2008: 16.3pp · 2024: -0.8pp
- All cycles
- 2024: R+0.8 2020: D+6.4 2016: D+0.3 2012: D+14.0 2008: D+16.3
Not yet ingested
- Civics
- —
Market trends
- HPI YoY
- ▼ -0.95%
- Current HPI
- 178.5307
- Rent YoY
- —
- Metro
- —
- State GDP YoY
- ▲ 1.68%
- F500 in state
- 34
Industry mix (Fortune 500 HQ in PA)
| Industry | F500 HQs | Revenue |
|---|---|---|
| Healthcare | 2 | $309B |
|
||
| Insurance | 2 | $27B |
|
||
| Telecommunications / Media | 1 | $124B |
|
||
| Industrial Distribution | 1 | $22B |
|
||
| Financial Services | 1 | $20B |
|
||
| Chemicals / Materials | 1 | $18B |
|
||
Price history
+137.0% since first listed8 events — show timeline
- 2026-06-16 Price Changed $365,000 LCAR
- 2026-04-21 Listed $369,000 LCAR
- 2026-02-16 Pending — PMAR
- 2025-10-01 Listed $388,800 PMAR
- 2022-09-02 Sold (Public Records) $315,000 Public Records
- 2020-07-14 Sold (MLS) $78,000 PMAR
- 2020-06-05 Listed $67,000 PMAR
- 2004-10-27 Sold (Public Records) $154,000 Public Records
Property tax history
-2.7%/yrLatest (2026): $3,390 · +3.3% YoY. Source: county tax records.
Cash-flow waterfall
monthlySold comps — $/sqft
last 12 mo · ≤1 miLoading sold comps…