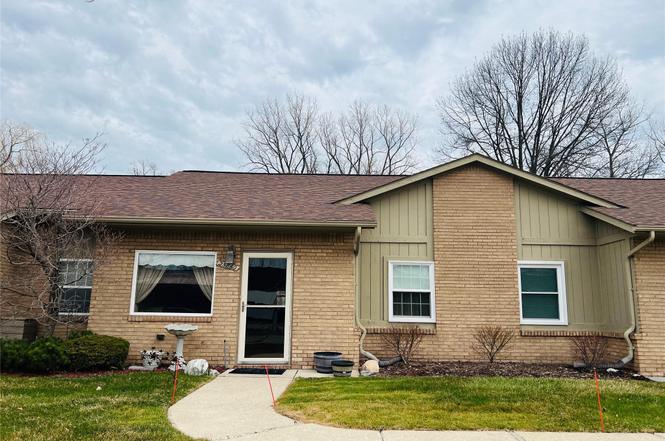
25860 Lira Ln #5 · Warren, MI
Flood risk 6/10 · Moderate
- FEMA flood zone
- X (unshaded)
- Chance of flooding over 30 yrs
- 0.66%
- Est. flood insurance / yr
- $507 – $1,088
Fire risk 1/10 · Minimal
- Est. fire insurance / yr
- $784 – $1,456
Heat risk 3/10 · Minor
- Hot days now (above 96°F)
- 7 days/yr
- Hot days in 30 yrs
- 15 days/yr
Wind risk 1/10 · Minimal
- Chance of severe wind over 30 yrs
- —
Air-quality risk 3/10 · Minor
- Unhealthy air days now
- 3 days/yr
- Unhealthy air days in 30 yrs
- 4 days/yr
Risk factors via First Street. Map © Google.
Why this score? — see what drove the D+ grade
The composite is a weighted blend of 9 inputs, each scored 0–100. Each bar is that input's sub-score; the figure is the points it added to the 100-point composite (weight × sub-score).
- Cash flow +18.9/30.0
- 1% rule +6.9/10.0
- DSCR +6.0/10.0
- ARV discount +5.3/15.0
- Livability +3.7/5.0
- Rent growth +3.2/5.0
- Schools +2.7/10.0
- Condition / age +2.5/5.0
- Appreciation +0.0/10.0
$115,000
🖨 Deal sheet 📄 Offer letter ✓ Due diligence
Listing remarks MLS
Check this move in ready nice 2 bedroom, 1 Full bath condo. Plenty of parking with your own carport. Small Patio in back. Included-Stove, Refrigerator, Microwave, Washer and Dryer, Dishwasher and garbage disposal.
Key facts
- $200 HOA
- Built 1990
- Listed 76 days
Neighborhood map
What this means for you Summary
Snapshot
- This is a 2-bed/1.0-bath condo listed at $115k.
Deal economics
- At list price, monthly cash flow is $118 ($1k/yr) — positive.
- The deal already cash-flows at list — no discount required.
- Meets the 1% rule at list price ($1k rent vs $115k).
- Recommended offer: $108k (6.0% below list) — sets the bar for market timing.
- Cap rate 7.5% vs local median 5.3% in Warren — top-decile yield for the area; either an underpriced asset or a hidden risk that comps aren't pricing in. Stress-test before assuming the spread holds.
Location & tenants
- Location reads 74/100 on livability (#171 in MI, #4,491 nationally) — a middle-class / working-renter tenant base. Strengths: commute A+, cost of living A+, housing A+; Watch: schools D, amenities D, employment D.
- Warren Woods Public Schools (urban): math 23% / reading 40% proficiency, ranked #336 of 540 in MI (top 62%) — families likely to look elsewhere, expect single-tenant / working-renter base with shorter leases.
- Market conditions: Rents rising (+2.9%/yr); 160 active listings in the ZIP; 20 comparable units currently listed for rent nearby; rentals at typical pace (median 22d on market — plan ~3-4 weeks tenant-placement turnaround); 1,321 units permitted in Macomb County in 2024 (86 in 5+ unit buildings).
- This rent runs 31% of the median local income ($52k/yr) — at the standard rent-burdened threshold; future hikes will face affordability resistance.
Forward outlook
- Local home prices are declining (-3.0%/yr); year-one equity from $795 of loan paydown is wiped out by about $3k of value loss. Plan a longer hold.
- Macomb County population projected at +9% by 2050 — modest demand growth; plan on rents tracking national, not racing it.
Negotiation context
- It's been on market 77 days — a 6% lower offer ($108k) is reasonable based on typical stale-listing flexibility.
- 2 sale attempts with the ask held roughly flat each time — persistent listings suggest the price (not the market) is what's stuck; bring a comps-based counter.
Risks & watch-outs
- Climate carrying-cost: major flood risk — expect insurance premiums to compound above CPI over the hold.
Questions for the listing agent
- It's been on market 77 days. Have you received any prior offers? Is the seller open to a 6% concession, seller financing, or rate buy-down credit?
- What does the HOA fee cover, when was the last increase, and are there any pending special assessments or reserve-fund shortfalls?
- Any open or pending special assessments — roof, HVAC, plumbing, elevator, façade? What's the per-unit balance and payoff schedule, and is the seller paying it off at close or rolling it to the buyer?
- Why hasn't it sold? Are there any deal-killer items the seller is aware of (foundation, flood, title, zoning, code violations)?
- Is there a deadline driving the sale (1031 exchange, divorce, estate, relocation)? That informs how much negotiation room exists.
- Schools are D-rated, which usually means shorter tenancies and higher turnover. Who's the typical renter profile here, and what's been the actual vacancy rate?
- Crime grade is D in this area — have there been break-ins, vandalism, or insurance claims at this property in the last 3 years? What carrier currently insures it and at what premium?
- The area grade is low — what's the realistic commute time and amenity access for the typical tenant pool here? Any planned neighborhood developments (good or bad) we should know about?
- What's the average days-on-market for RENTAL listings here right now (not sales)? A rising rental-DOM trend means longer vacancies and softer asking-rent achievability than the comps imply.
- What's the recent tenant-quality profile in this submarket — average credit score on applications, eviction rate, late-payment / NSF rate, and stable-employment percentage? A property-management company in the area should have these aggregated.
- How much new apartment / multifamily construction is in the pipeline within 1–3 miles? Heavy new supply (>2% of stock underway) typically softens rents 12–24 months out; light construction supports rent growth.
Investment metrics
- 1% rule
- 1.19% ✓
- Cap rate
- 7.52%
- Cash-on-cash
- 4.39%
- DSCR
- 1.20
- GRM
- 7.0
CMA / ARV
- ARV (median comp)
- $109,700
- List price
- $115,000
- Delta
- 4.83%
- Verdict
- FAIR
- Comps
- 11 within 1.0 mi
Projected returns pro-forma
-3.0% appreciation · 2.94% rent growth · sell at horizon
- IRR
- -9.4%
- Equity multiple
- 0.66×
- Total profit
- $-11,087
- Equity at exit
- $17,147
- IRR
- 0.1%
- Equity multiple
- 1.01×
- Total profit
- $177
- Equity at exit
- $9,943
Cash invested: $32,200 (down + closing). Projections, not guarantees.
Landlord ↔ Tenant lean methodology
- Overall (STATE)
- 62 Landlord-Friendly
- State Michigan
- 62 Landlord-Friendly · EVEN
- County
- — inherits STATE
- City
- — inherits STATE
ZIP-level market 48089
- Rents YoY
- 2.9%
- Active inventory
- 160
- Price-to-rent
- 7.0×
Monthly cashflow live
- Estimated rent
- $1,368 high interval (Pro) →
- Mortgage (P&I)
- −$603
- Tax from tax record
- −$112 /mo · $1,340/yr
- Insurance
- −$48
- HOA
- −$200
- Vacancy / Maint / Mgmt
- −$287
- Net cashflow
- $118
Break-even live
UW: 25.0% down · 7.5% · 30yr · 1.5% tax · 5.0% vac · 8.0% maint · 8.0% mgmt
Financing live
Cash to close
- Down payment
- $28,750
- Closing costs
- $3,450
- Reserves months
- —
- Total cash needed
- —
Loan-product check · same deal, 3 products live
Conventional
25% down · 7.5% · 30yr
- Down + closing
- —
- Monthly P&I
- —
- Monthly cashflow
- —
- DSCR
- —
- Eligible?
- —
Personal DTI + credit; lowest rate.
DSCR
20% down · 8.5% · 30yr
- Down + closing
- —
- Monthly P&I
- —
- Monthly cashflow
- —
- DSCR
- —
- Eligible?
- —
No personal income docs; deal must DSCR.
Hard money
10% down · 12.0% · 12mo
- Down + closing
- —
- Monthly P&I
- —
- Monthly cashflow
- —
- DSCR
- —
- Eligible?
- —
Short-term bridge; refi at stabilization.
Rent comps 20 comps
| Address | Beds | Baths | Sqft | Rent | $/sqft | DOM | Units | Dist |
|---|---|---|---|---|---|---|---|---|
| 25672 Lira Ln Warren, MI | 2.0 | 1.0 | 831 | $1,250 | $1.50 | 17d | 1 | 0.06mi |
| 26160 Regency Club Dr Warren, MI | 1.0–3.0 | 1.0–2.0 | 1011 | $1,470 | $1.45 | 1d | 15 | 0.22mi |
| 25202 Firwood Ave Warren, MI | 3.0 | 1.0 | 1100 | $1,350 | $1.23 | 24d | 1 | 0.30mi |
| 25107 Rosenbusch Blvd Warren, MI | 3.0 | 1.0 | 903 | $1,523 | $1.69 | 14d | 1 | 0.45mi |
| 26711 Lehner St Roseville, MI | 3.0 | 1.0 | 960 | $1,575 | $1.64 | 24d | 1 | 0.65mi |
| 26153 Nagel St Roseville, MI | 3.0 | 1.0 | 924 | $1,500 | $1.62 | 14d | 1 | 0.67mi |
| 25184 Wiseman St Roseville, MI | 3.0 | 1.0 | 895 | $1,750 | $1.96 | 21d | 1 | 0.68mi |
| 25184 Wiseman St Roseville, MI | 3.0 | 1.0 | 1000 | $1,750 | $1.75 | 3d | 1 | 0.68mi |
| 13741 McKinley Ave Unit 1032320P Warren, MI | 2.0 | 1.0 | 839 | $5,023 | $5.99 | 1d | 1 | 0.74mi |
| 26536 Kathy St Roseville, MI | 3.0 | 1.0 | 1000 | $1,499 | $1.50 | 24d | 1 | 0.80mi |
| 26511 Grandmont St Roseville, MI | 3.0 | 1.0 | 960 | $1,495 | $1.56 | 4d | 1 | 0.87mi |
| 27241 Woodmont St Roseville, MI | 3.0 | 1.0 | 924 | $1,550 | $1.68 | 1d | 1 | 1.04mi |
| 13006 E 11 Mile Rd Unit 6 Warren, MI | 2.0 | 1.0 | 850 | $1,075 | $1.26 | 14d | 1 | 1.13mi |
| 13006 E 11 Mile Rd Unit 6 Warren, MI | 2.0 | 1.0 | 850 | $1,050 | $1.24 | 43d | 1 | 1.13mi |
| 16840 E Eleven Mile Rd Roseville, MI | 2.0 | 1.0 | 900 | $1,300 | $1.44 | 21d | 3 | 1.40mi |
| 16840 E Eleven Mile Rd Unit 104 Roseville, MI | 2.0 | 1.0 | 900 | $1,200 | $1.33 | 43d | 1 | 1.40mi |
| 16840 E Eleven Mile Rd Roseville, MI | 2.0 | 1.0 | 900 | $1,300 | $1.44 | 24d | 3 | 1.40mi |
| 16840 E 11 Mile Rd Unit 109 Roseville, MI | 2.0 | 1.0 | 900 | $1,400 | $1.56 | 43d | 1 | 1.40mi |
| 16840 E Eleven Mile Rd Unit 103 Roseville, MI | 2.0 | 1.0 | 900 | $1,250 | $1.39 | 43d | 1 | 1.40mi |
| 16944 E 11 Mile Rd Unit C2 Roseville, MI | 2.0 | 1.0 | 900 | $1,295 | $1.44 | 24d | 1 | 1.46mi |
HOA detail condo
- Monthly dues
- $200 · $2,400/yr
- Likely covers
- trash
- Assessments
- None detected in remarks — confirm with the listing agent.
Listing history 16 events
-
2026-06-15statusdays on market $115,000 Active 77 DOM
-
2026-06-13days on market $115,000 Active Under Contract 75 DOM
-
2026-06-13days on market $115,000 Active Under Contract 74 DOM
-
2026-06-09days on market $115,000 Active Under Contract 71 DOM
-
2026-06-08days on market $115,000 Active Under Contract 70 DOM
-
2026-06-07days on market $115,000 Active Under Contract 69 DOM
-
2026-06-04days on market $115,000 Active Under Contract 66 DOM
-
2026-06-03days on market $115,000 Active Under Contract 65 DOM
-
2026-06-02days on market $115,000 Active Under Contract 64 DOM
-
2026-06-01days on market $115,000 Active Under Contract 63 DOM
-
2026-05-31days on market $115,000 Active Under Contract 62 DOM
-
2026-03-31$115,000 Active 213-char remark
Show marketing remark (213 chars)
Check this move in ready nice 2 bedroom, 1 Full bath condo. Plenty of parking with your own carport. Small Patio in back. Included-Stove, Refrigerator, Microwave, Washer and Dryer, Dishwasher and garbage disposal.
-
2026-03-31$115,000 Active 213-char remark
Show marketing remark (213 chars)
Check this move in ready nice 2 bedroom, 1 Full bath condo. Plenty of parking with your own carport. Small Patio in back. Included-Stove, Refrigerator, Microwave, Washer and Dryer, Dishwasher and garbage disposal.
-
2026-03-30historical $115,000 213-char remark
Show marketing remark (213 chars)
Check this move in ready nice 2 bedroom, 1 Full bath condo. Plenty of parking with your own carport. Small Patio in back. Included-Stove, Refrigerator, Microwave, Washer and Dryer, Dishwasher and garbage disposal.
-
2026-01-15soldstatus $104,000
-
1990-07-27soldstatus $49,900
ⓘ Source: listings_history table (triggers on properties + properties_extension) + one-shot
backfill from property_details.listing_events for pre-trigger history.
Tax reassessment forecast MI · Partial reset (capped growth)
- Current annual tax
- $1,340 · $112/mo
- Projected year-2 tax
- $1,556 · $130/mo
- Expected delta
- +$215/yr (+$18/mo · 16.1%)
ⓘ Screening estimate from a state-policy table — verify with the county assessor before closing.
Climate risk First Street
- Flood 6/10 Major FEMA zone X (unshaded) · 66% chance over 30 yrs
- Wildfire 1/10 Low
- Heat 3/10 Moderate 7 d/yr ≥96°F today · 15 d/yr by 30 yrs out
- Wind 1/10 Low
- Air quality 3/10 Moderate 3 unhealthy d/yr today · 4 by 30 yrs out
Nearby sold comps map
Loading sold comps map…
Walkable amenities ~0.75 mi
Loading nearby amenities…
Taxation est. · year 1
- Rental income
- $16,413
- − Mortgage interest
- −$6,442
- − Property taxes
- −$1,340
- − Insurance
- −$575
- − Repairs & maintenance
- −$1,313
- − Management
- −$1,313
- − HOA
- −$2,400
- − Depreciation
- −$3,345
- Taxable loss
- −$315
- Est. tax savings @ 24.0%
- +$76
- After-tax cash flow
- $1,490/yr
For passive investors: Depreciation is non-cash, so a rental often shows a tax loss while cash-flowing — sheltering income. Rental losses are passive: they offset passive income freely, and up to $25,000/yr can offset ordinary (W-2) income if you actively participate and your MAGI is under $100k (phasing out to $0 by $150k); unused losses carry forward. On sale, claimed depreciation is recaptured at up to 25%, and gains may owe capital-gains tax (a 1031 exchange can defer both). Figures are a year-1 estimate at your 24.0% rate — not tax advice; consult a CPA.
Schools (NCES district)
- District
- Warren Woods Public Schools
- NCES district ID
- 2635220
- Math proficiency
- 23% ▼ -9.00%
- Reading proficiency
- 40% ▼ -5.00%
- Median HH income
- $49,013
- Composite
- 27.29/100
- National rank
- #7003
- State rank
- #336 of 540 in MI
Livability — Warren
- Score
- 74/100
- State rank
- #171
- US rank
- #4491
Category grades
Schools grade is shown separately in the Schools card above.
Census & demographics
- Census place
- Warren, MI
- County
- Macomb County · 638,552 people
- City population
- 114,937
- Metro
- Detroit-Warren-Dearborn, MI
- Population (ZIP)
- 31,853
- Household income
- $52,366
- Rent vs Own
- Severe rent burden
- 1754.0
Population outlook (Macomb County) Hauer SSP2
- Today (2025)
- 925,296 people
- By 2030
- 948,226 · +2.5%
- By 2040
- 983,961 · +6.3%
- By 2050
- 1,010,200 · +9.2%
- By 2075
- 1,076,222 · +16.3%
- By 2100
- 1,077,065 · +16.4%
Race, ethnicity, and origin ACS 2023
- Neighborhood character
- Diverse neighborhood (Simpson 0.61)
- Race & ethnicity
- White 53% Black 31% Asian 7% Two or more races 6% Hispanic / Latino 3%
- Common ancestry
- Romanian 11% Lithuanian 3% Slovak 2%
- Foreign-born
- 5% · Canada
- Languages at home
- 92% English-only · Other Asian/Pacific 3% Other Indo-European 2% Arabic 1%
Political lean MEDSL · Macomb
- 2024 margin
- R (+13.7) · D 42.2% · R 55.9% · Other 1.9%
- 2008→2024 swing
- -22.3pp toward R · 2008: 8.6pp · 2024: -13.7pp
- All cycles
- 2024: R+13.7 2020: R+8.1 2016: R+11.6 2012: D+4.0 2008: D+8.6
Not yet ingested
- Civics
- —
Market trends
- HPI YoY
- ▼ -211.46%
- Current HPI
- 154.8325
- Rent YoY
- ▲ 2.94%
- Metro
- Detroit-Warren-Dearborn, MI
- State GDP YoY
- ▲ 1.37%
- F500 in state
- 28
Industry mix (Fortune 500 HQ in MI)
| Industry | F500 HQs | Revenue |
|---|---|---|
| Automotive Parts | 3 | $48B |
|
||
| Automotive | 2 | $372B |
|
||
| Chemicals | 1 | $45B |
|
||
| Automotive Retail | 1 | $29B |
|
||
| Healthcare / Medical Devices | 1 | $23B |
|
||
| Automotive Technology | 1 | $20B |
|
||
Price history
+130.5% since first listed5 events — show timeline
- 2026-03-31 Listed $115,000 MiRealSource-MiMLS
- 2026-03-31 Listed $115,000 REALCOMP
- 2026-03-30 Coming Soon $115,000 MiRealSource-MiMLS
- 2026-01-15 Sold (Public Records) $104,000 Public Records
- 1990-07-27 Sold (Public Records) $49,900 Public Records
Property tax history
+1.4%/yrLatest (2025): $1,340 · +2.5% YoY. Source: county tax records.
Cash-flow waterfall
monthlySold comps — $/sqft
last 12 mo · ≤1 miLoading sold comps…