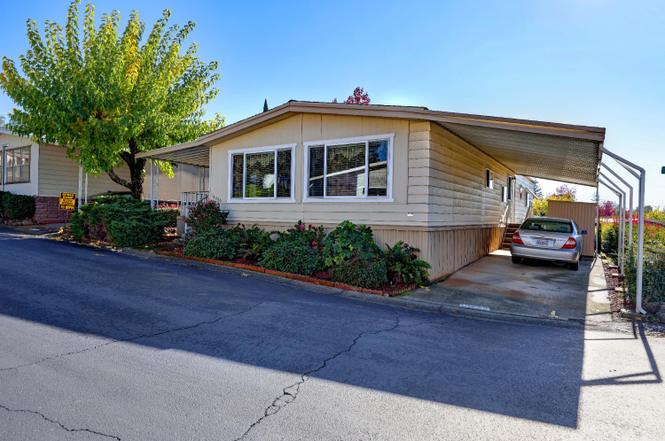
12300 Pepperwood Cir · North Auburn, CA
Flood risk 1/10 · Minimal
- FEMA flood zone
- X (unshaded)
- Chance of flooding over 30 yrs
- 0.0%
- Est. flood insurance / yr
- $507 – $1,088
Fire risk 10/10 · Severe
- Est. fire insurance / yr
- $659 – $1,223
Heat risk 6/10 · Moderate
- Hot days now (above 99°F)
- 7 days/yr
- Hot days in 30 yrs
- 16 days/yr
Wind risk 1/10 · Minimal
- Chance of severe wind over 30 yrs
- —
Air-quality risk 10/10 · Severe
- Unhealthy air days now
- 34 days/yr
- Unhealthy air days in 30 yrs
- 41 days/yr
Risk factors via First Street. Map © Google.
Why this score? — see what drove the C grade
The composite is a weighted blend of 9 inputs, each scored 0–100. Each bar is that input's sub-score; the figure is the points it added to the 100-point composite (weight × sub-score).
- Cash flow +26.1/30.0
- DSCR +8.8/10.0
- 1% rule +6.9/10.0
- Schools +4.9/10.0
- Rent growth +3.1/5.0
- Livability +3.1/5.0
- Condition / age +2.5/5.0
- ARV discount +0.0/15.0
- Appreciation +0.0/10.0
$178,500
🖨 Deal sheet 📄 Offer letter ✓ Due diligence
Listing remarks
Step into this spacious, beautifully updated mobile home located in a welcoming senior community. Designed with comfort and style in mind, this residence features vaulted ceilings that create an airy, open atmosphere throughout the living areas. The modern upgrades blend seamlessly with the home's generous layout, offering both functionality and elegance. This home boasts a large open kitchen with plenty of cabinets and ample counter space, perfect for cooking and entertaining. The kitchen's design maximizes storage and workspace, making it both functional and inviting. Spacious primary bedroom with a sliding door leading to your private deck perfect for your morning coffee or evening relax
Key facts
- Private deck
- Community amenities
- Natural light
Tags
Property features AI
Finance
- Other: Address: 12300 Pepperwood Cir, Auburn, CA 95603; Directions: Hwy 49 to Luther Rd., turn left into Woodside Mobile Home Park. Follow the center line to the back of the park to Pepperwood Circle. Turn right - home is on the corner.
- Financial info: Land lease: No
- HOA & community: No homeowners association; Located in a senior community
Exterior
- Parking: Attached covered parking
- Utilities: Individual electric meter; Individual gas meter; 220V in laundry; Public water; Public sewer
- Home design: Manufactured home in park; Triple wide; Buddy make; Built in 1979
- Construction: Composition roof; Vinyl skirting
- Exterior features: Garden; Other lot features
Interior
- Kitchen: Dishwasher; Disposal; Microwave; Free-standing gas oven
- Bedrooms: 2 bedrooms
- Flooring: Carpet; Laminate; Vinyl; Wood
- Bathrooms: 2 full bathrooms; Tub with shower over; Shower stall(s)
- Heating & cooling: Central heating; Central air conditioning; Ceiling fans
- Interior features: Cathedral/vaulted living room; Porch; Dining and living room combined; Laminate countertops
- Laundry & utility: Washer and dryer included; Washer/dryer hookups; Laundry located inside
Neighborhood map
What this means for you Summary
Snapshot
- This is a 2-bed/2.0-bath manufactured listed at $178k.
Deal economics
- At list price, monthly cash flow is $449 ($5k/yr) — positive.
- The deal already cash-flows at list — no discount required.
- Meets the 1% rule at list price ($2k rent vs $178k).
- Recommended offer: $157k (12.0% below list) — sets the bar for market timing.
- Cap rate 9.3% vs local median 2.6% in North Auburn — top-decile yield for the area; either an underpriced asset or a hidden risk that comps aren't pricing in. Stress-test before assuming the spread holds.
Location & tenants
- Location reads 61/100 on livability (#519 in CA) — a middle-class / working-renter tenant base. Strengths: employment A-, housing A-; Watch: schools F, crime D-, amenities F.
- Placer Union High (suburban): math 39% / reading 72% proficiency, ranked #98 of 517 in CA (top 19%) — acceptable for families but not a draw, mixed tenant base, ~2y average lease.
- Market conditions: Rents rising (+2.3%/yr); 204 active listings in the ZIP; 1 comparable units currently listed for rent nearby; solid renter incomes; 3,535 units permitted in Placer County in 2024 (689 in 5+ unit buildings).
Forward outlook
- Local home prices are declining (-3.0%/yr); year-one equity from $1k of loan paydown is wiped out by about $5k of value loss. Plan a longer hold.
- Placer County population projected at +20% by 2050 — long-run rental-demand tailwind backs the buy-and-hold thesis.
Negotiation context
- It's been on market 177 days — a 12% lower offer ($157k) is reasonable based on typical stale-listing flexibility.
Risks & watch-outs
- Climate carrying-cost: severe wildfire risk; extreme-heat days projected 7→16/yr by 2055 (HVAC capex compounding) — expect insurance premiums to compound above CPI over the hold.
Questions for the listing agent
- It's been on market 177 days. Have you received any prior offers? Is the seller open to a 12% concession, seller financing, or rate buy-down credit?
- Built in 1979 — when were the roof, HVAC, electrical panel, plumbing, and water heater last replaced?
- Why hasn't it sold? Are there any deal-killer items the seller is aware of (foundation, flood, title, zoning, code violations)?
- Is there a deadline driving the sale (1031 exchange, divorce, estate, relocation)? That informs how much negotiation room exists.
- Schools are F-rated, which usually means shorter tenancies and higher turnover. Who's the typical renter profile here, and what's been the actual vacancy rate?
- Crime grade is D in this area — have there been break-ins, vandalism, or insurance claims at this property in the last 3 years? What carrier currently insures it and at what premium?
- What's the average days-on-market for RENTAL listings here right now (not sales)? A rising rental-DOM trend means longer vacancies and softer asking-rent achievability than the comps imply.
- What's the recent tenant-quality profile in this submarket — average credit score on applications, eviction rate, late-payment / NSF rate, and stable-employment percentage? A property-management company in the area should have these aggregated.
- How much new for-sale + rental construction is in the pipeline within 1–3 miles? Heavy new supply typically softens prices + rents 12–24 months out; constrained supply supports both.
Investment metrics
- 1% rule
- 1.19% ✓
- Cap rate
- 9.31%
- Cash-on-cash
- 10.77%
- DSCR
- 1.48
- GRM
- 7.0
CMA / ARV
- ARV (on-the-fly)
- $134,400
- Comps found
- 12
Show comp detail 12 sales within ~0.75 mi
| Address | Dist | Beds/Ba | Sqft | Sold | Price | $/sf | Match |
|---|---|---|---|---|---|---|---|
| 12300 Pepperwood Cir | 0.00mi | 2/2.0 | 1,680 (0%) | 0mo | $169,000 | $101 | 100 |
| 1677 Tulip Cir | 0.05mi | 3/2.0 (+1) | 1,700 (+1%) | 12mo | $177,000 | $104 | 80 |
| 12326 Pepperwood Cir #200 | 0.10mi | 2/2.0 | 1,440 (-14%) | 1mo | $165,000 | $115 | 71 |
| 12180 Laurel Dr | 0.13mi | 3/2.0 (+1) | 1,560 (-7%) | 9mo | $129,000 | $83 | 70 |
| 12318 Pepperwood Cir #228 | 0.10mi | 2/2.0 | 1,440 (-14%) | 3mo | $115,000 | $80 | 69 |
| 12369 Pepperwood Cir | 0.02mi | 2/2.0 | 1,440 (-14%) | 8mo | $130,000 | $90 | 69 |
| 1671 Tulip Cir | 0.05mi | 2/2.0 | 1,464 (-13%) | 17mo | $55,000 | $38 | 62 |
| 1564 Cottonwood Cir | 0.13mi | 3/2.0 (+1) | 1,440 (-14%) | 9mo | $95,000 | $66 | 58 |
| 1605 Grass Valley Hwy #73 | 0.45mi | 3/2.0 (+1) | 1,536 (-9%) | 5mo | $110,000 | $72 | 56 |
| 1605 Grass Valley Hwy #62 | 0.45mi | 2/2.0 | 1,440 (-14%) | 1mo | $55,000 | $38 | 55 |
| 21 Larkspur Ave | 0.68mi | 3/2.0 (+1) | 1,560 (-7%) | 12mo | $109,900 | $70 | 42 |
| 5 Lily Ave | 0.62mi | 3/2.0 (+1) | 1,440 (-14%) | 9mo | $39,900 | $28 | 35 |
Match score weights: distance 35% · size 25% · config 20% · recency 20%. Top-matched comps best support the ARV.
Projected returns pro-forma
-3.0% appreciation · 2.34% rent growth · sell at horizon
- IRR
- -0.9%
- Equity multiple
- 0.97×
- Total profit
- $-1,727
- Equity at exit
- $26,615
- IRR
- 8.1%
- Equity multiple
- 1.59×
- Total profit
- $29,727
- Equity at exit
- $15,433
Cash invested: $49,980 (down + closing). Projections, not guarantees.
Landlord ↔ Tenant lean methodology
- Overall (STATE)
- 18 Strongly Tenant-Friendly
- State California
- 18 Strongly Tenant-Friendly · D+13
- County
- — inherits STATE
- City
- — inherits STATE
ZIP-level market 95603
- Rents YoY
- 2.3%
- Active inventory
- 204
- Price-to-rent
- 7.0×
Monthly cashflow live
- Estimated rent
- $2,129 medium interval (Pro) →
- Mortgage (P&I)
- −$936
- Tax est. 1.5%
- −$223 /mo · $2,678/yr
- Insurance
- −$74
- HOA
- −$0
- Vacancy / Maint / Mgmt
- −$447
- Net cashflow
- $449
Break-even live
UW: 25.0% down · 7.5% · 30yr · 1.5% tax · 5.0% vac · 8.0% maint · 8.0% mgmt
Financing live
Cash to close
- Down payment
- $44,625
- Closing costs
- $5,355
- Reserves months
- —
- Total cash needed
- —
Loan-product check · same deal, 3 products live
Conventional
25% down · 7.5% · 30yr
- Down + closing
- —
- Monthly P&I
- —
- Monthly cashflow
- —
- DSCR
- —
- Eligible?
- —
Personal DTI + credit; lowest rate.
DSCR
20% down · 8.5% · 30yr
- Down + closing
- —
- Monthly P&I
- —
- Monthly cashflow
- —
- DSCR
- —
- Eligible?
- —
No personal income docs; deal must DSCR.
Hard money
10% down · 12.0% · 12mo
- Down + closing
- —
- Monthly P&I
- —
- Monthly cashflow
- —
- DSCR
- —
- Eligible?
- —
Short-term bridge; refi at stabilization.
Rent comps 1 comps
| Address | Beds | Baths | Sqft | Rent | $/sqft | DOM | Units | Dist |
|---|---|---|---|---|---|---|---|---|
| 630 Shockley Rd Auburn, CA | 3.0 | 2.0 | 1100 | $2,495 | $2.27 | 2d | 1 | 0.95mi |
Climate risk First Street
- Flood 1/10 Low FEMA zone X (unshaded) · 0% chance over 30 yrs
- Wildfire 10/10 Extreme
- Heat 6/10 Major 7 d/yr ≥99°F today · 16 d/yr by 30 yrs out
- Wind 1/10 Low
- Air quality 10/10 Extreme 34 unhealthy d/yr today · 41 by 30 yrs out
Nearby sold comps map
Loading sold comps map…
Walkable amenities ~0.75 mi
Loading nearby amenities…
Taxation est. · year 1
- Rental income
- $25,552
- − Mortgage interest
- −$9,999
- − Property taxes
- −$2,678
- − Insurance
- −$892
- − Repairs & maintenance
- −$2,044
- − Management
- −$2,044
- − Depreciation
- −$5,193
- Taxable income
- $2,702
- Est. tax owed @ 24.0%
- −$648
- After-tax cash flow
- $4,735/yr
For passive investors: Depreciation is non-cash, so a rental often shows a tax loss while cash-flowing — sheltering income. Rental losses are passive: they offset passive income freely, and up to $25,000/yr can offset ordinary (W-2) income if you actively participate and your MAGI is under $100k (phasing out to $0 by $150k); unused losses carry forward. On sale, claimed depreciation is recaptured at up to 25%, and gains may owe capital-gains tax (a 1031 exchange can defer both). Figures are a year-1 estimate at your 24.0% rate — not tax advice; consult a CPA.
Schools (NCES district)
- District
- Placer Union High
- NCES district ID
- 0630750
- Math proficiency
- 39% ▲ 1.00%
- Reading proficiency
- 72% ▲ 3.00%
- Median HH income
- $69,119
- Composite
- 49.04/100
- National rank
- #2060
- State rank
- #98 of 517 in CA
Livability — North Auburn
- Score
- 61/100
- State rank
- #519
- US rank
- #17512
Category grades
Schools grade is shown separately in the Schools card above.
Census & demographics
- Census place
- North Auburn, CA
- County
- Placer County · 390,510 people
- City population
- 28,195
- Metro
- Sacramento-Roseville-Folsom, CA
- Population (ZIP)
- 28,432
- Household income
- $85,357
- Rent vs Own
- Severe rent burden
- 1017.0
Population outlook (Placer County) Hauer SSP2
- Today (2025)
- 422,709 people
- By 2030
- 444,249 · +5.1%
- By 2040
- 480,192 · +13.6%
- By 2050
- 506,390 · +19.8%
- By 2075
- 550,219 · +30.2%
- By 2100
- 547,760 · +29.6%
Race, ethnicity, and origin ACS 2023
- Neighborhood character
- Predominantly White (73%)
- Race & ethnicity
- White 73% Hispanic / Latino 17% Two or more races 11% Asian 3%
- Hispanic origin (detail)
- Mexican 12%
- Common ancestry
- Italian 3% Slovak 3% Lithuanian 2%
- Foreign-born
- 9% · Canada, South Korea
- Languages at home
- 88% English-only · Spanish 10% Other Indo-European 1% Tagalog/Filipino 1%
Political lean MEDSL · Placer
- 2024 margin
- Lean R (+8.5) · D 44.3% · R 52.8% · Other 2.9%
- 2008→2024 swing
- +2.8pp toward D · 2008: -11.3pp · 2024: -8.5pp
- All cycles
- 2024: R+8.5 2020: R+6.7 2016: R+11.3 2012: R+20.1 2008: R+11.3
Not yet ingested
- Civics
- —
Market trends
- HPI YoY
- ▼ -500.89%
- Current HPI
- 251.4573
- Rent YoY
- ▲ 2.34%
- Metro
- Sacramento-Roseville-Folsom, CA
- State GDP YoY
- ▲ 3.21%
- F500 in state
- 116
Industry mix (Fortune 500 HQ in CA)
| Industry | F500 HQs | Revenue |
|---|---|---|
| Technology | 27 | $1,492B |
|
||
| Financial Services | 3 | $174B |
|
||
| Retail | 3 | $44B |
|
||
| Insurance | 3 | $26B |
|
||
| Media / Entertainment | 2 | $115B |
|
||
| Pharmaceuticals / Biotech | 2 | $62B |
|
||
Cash-flow waterfall
monthlySold comps — $/sqft
last 12 mo · ≤1 miLoading sold comps…