 Duplex
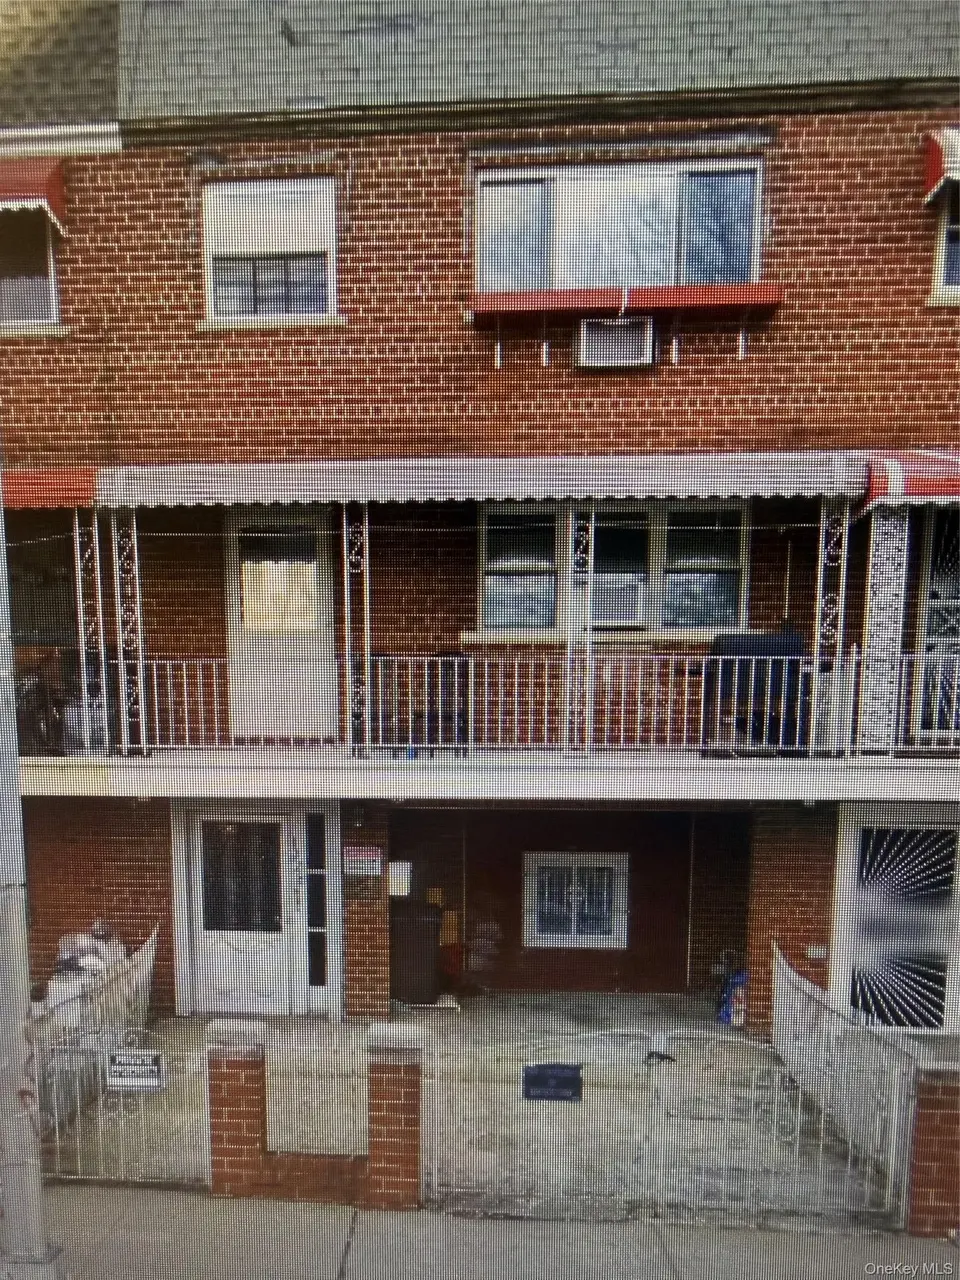
1228 Noble Ave · New York, NY
Flood risk 6/10 · Moderate
- FEMA flood zone
- X (shaded)
- Chance of flooding over 30 yrs
- 0.27%
- Est. flood insurance / yr
- $507 – $1,088
Fire risk 1/10 · Minimal
- Est. fire insurance / yr
- $691 – $1,283
Heat risk 6/10 · Moderate
- Hot days now (above 99°F)
- 7 days/yr
- Hot days in 30 yrs
- 15 days/yr
Wind risk 6/10 · Moderate
- Chance of severe wind over 30 yrs
- 27.0%
Air-quality risk 4/10 · Minor
- Unhealthy air days now
- 5 days/yr
- Unhealthy air days in 30 yrs
- 6 days/yr
Risk factors via First Street. Map © Google.
Why this score? — see what drove the C- grade
The composite is a weighted blend of 9 inputs, each scored 0–100. Each bar is that input's sub-score; the figure is the points it added to the 100-point composite (weight × sub-score).
- Cash flow +15.9/30.0
- ARV discount +7.1/15.0
- Appreciation +7.0/10.0
- Schools +5.0/10.0
- DSCR +4.9/10.0
- Livability +3.8/5.0
- 1% rule +3.7/10.0
- Rent growth +2.5/5.0
- Condition / age +2.5/5.0
$839,000
🖨 Deal sheet (PDF) 📄 Offer letter ✓ Due diligence
Multi-family units
County records classify this as Multi-Family (2-4 Unit). Listing-text estimate: 2 units. confirmed
Listing remarks
This legally classified two-family residential property in the Soundview section of the Bronx features a building layout encompassing 1,780 gross square feet across three stories. The multi-family structure is situated on a lot zoned R5 and is conveniently located just over a tenth of a mile from the St. Lawrence Avenue subway station servicing the 6 line. Positioned within Bronx Geographic School District #12, the property is locally zoned for P. S. 047 John Randolph Elementary School.
Key facts
- 1,992 sq ft lot
- Built 1960
- Listed 8 days
Property features AI
Exterior
- Parking: Driveway (no carport)
- Utilities: Public sewer; Cable connected; Electricity available
- Home design: Duplex property
- Construction: Brick construction
- Exterior features: Brick exterior; Not waterfront
Interior
- Heating & cooling: Other heating; No central cooling
- Interior features: Other interior features
Neighborhood map
What this means for you Summary
Snapshot
- This is a 2 × 2-bed/?-bath units multifamily listed at $839k.
Deal economics
- At list price, monthly cash flow is $399 ($5k/yr) — positive. Per door: $199/mo.
- The deal already cash-flows at list — no discount required.
- To meet the 1% rule (rent ≥ 1% of price), the offer needs to be $729k (13.2% below list).
- Recommended offer: $729k (13.2% below list) — sets the bar for 1% rule.
- Cap rate 6.9% vs local median 2.6% in New York — top-decile yield for the area; either an underpriced asset or a hidden risk that comps aren't pricing in. Stress-test before assuming the spread holds.
Location & tenants
- Location reads 75/100 on livability (#268 in NY, #4,188 nationally) — a middle-class / working-renter tenant base. Strengths: amenities A+, commute A+, health & safety A; Watch: crime F, cost of living F.
- Zoned schools: Ps 214 (math 30% / reading 50%, grade F, #1,418 of 2,108 statewide, top 68%, 836 students, 92% FRL); Jhs 383 Philippa Schuyler (math 32% / reading 67%, grade C, #280 of 729 statewide, top 40%, 822 students, 85% FRL); Midwood High School (math 94% / reading 96%, grade A+, #83 of 1,100 statewide, top 8%, 4,062 students, 73% FRL).
- Market conditions: 54 active listings in the ZIP; 6,929 units permitted in Bronx County in 2024 (6,829 in 5+ unit buildings).
Forward outlook
- In year one you build about $40k of equity ($6k loan paydown + $34k appreciation (4.1% local appreciation)).
- Bronx County population projected at +21% by 2050 — long-run rental-demand tailwind backs the buy-and-hold thesis.
- At projected returns (4.1% appreciation + 3.0% rent growth), your $235k cash investment doubles in ~5 years — after that, you're playing with house money.
- By year 2, paydown + projected appreciation supports a ~$64k cash-out refi (75% LTV) — recoverable capital for the next deal without selling this one.
Negotiation context
- Only 9 days on market — expect competitive offers; lowballing is unlikely to land.
- Current owner paid $300k; list at $839k implies a 180% gain — meaningful room to come down on a strong offer.
Risks & watch-outs
- Climate carrying-cost: major flood risk; major wind risk, 27% chance of damaging wind over 30y; extreme-heat days projected 7→15/yr by 2055 (HVAC capex compounding) — expect insurance premiums to compound above CPI over the hold.
Questions for the listing agent
- Can we see the unit-by-unit rent roll, current vacancy, and any below-market leases? What's the average tenancy length?
- What capital expenditures (roof, boiler, parking lot, exteriors) have been made in the last 5 years, and what's planned in the next 2?
- Built in 1960 — when were the roof, HVAC, electrical panel, plumbing, and water heater last replaced?
- Is there a deadline driving the sale (1031 exchange, divorce, estate, relocation)? That informs how much negotiation room exists.
- Schools are B-rated — typically a magnet for longer-tenancy family renters. What's the average tenant stay here, and is there a school-zone premium baked into asking?
- Crime grade is F in this area — have there been break-ins, vandalism, or insurance claims at this property in the last 3 years? What carrier currently insures it and at what premium?
- What's the average days-on-market for RENTAL listings here right now (not sales)? A rising rental-DOM trend means longer vacancies and softer asking-rent achievability than the comps imply.
- What's the recent tenant-quality profile in this submarket — average credit score on applications, eviction rate, late-payment / NSF rate, and stable-employment percentage? A property-management company in the area should have these aggregated.
- How much new apartment / multifamily construction is in the pipeline within 1–3 miles? Heavy new supply (>2% of stock underway) typically softens rents 12–24 months out; light construction supports rent growth.
Investment metrics
- 1% rule
- 0.87% ✗
- Cap rate
- 6.86%
- Cash-on-cash
- 2.04%
- DSCR
- 1.09
- GRM
- 9.6
CMA / ARV
- ARV (on-the-fly)
- $831,260
- Comps found
- 12
Show comp detail 12 sales within ~0.75 mi
| Address | Dist | Beds/Ba | Sqft | Sold | Price | $/sf | Match |
|---|---|---|---|---|---|---|---|
| 1274 Fteley Ave | 0.15mi | 5/3.0 | 1,840 (+3%) | 6mo | $955,000 | $519 | 82 |
| 1317 Thieriot Ave | 0.30mi | 5/3.0 | 1,773 (-0%) | 8mo | $880,000 | $496 | 78 |
| 1071 Stratford Ave | 0.40mi | 7/2.0 | 1,950 (+10%) | 2mo | $880,000 | $451 | 64 |
| 1250 Thieriot Ave | 0.30mi | 3/2.0 | 1,606 (-10%) | 11mo | $665,000 | $414 | 61 |
| 1347 Taylor Ave | 0.29mi | 7/2.0 | 2,012 (+13%) | 5mo | $775,000 | $385 | 60 |
| 1926 Mcgraw Ave | 0.58mi | 5/4.0 | 1,935 (+9%) | 2mo | $900,000 | $465 | 57 |
| 1513 Rosedale Ave | 0.54mi | 5/3.0 | 1,946 (+9%) | 3mo | $799,000 | $411 | 57 |
| 1143 Leland Ave | 0.35mi | 9/6.0 | 2,040 (+15%) | 6mo | $1,225,000 | $600 | 54 |
| 1328 Thieriot Ave | 0.34mi | 3/1.0 | 2,040 (+15%) | 12mo | $999,000 | $490 | 50 |
| 1963 Chatterton Ave | 0.65mi | 4/2.0 | 1,940 (+9%) | 9mo | $825,000 | $425 | 47 |
| 1955 Haviland Ave | 0.58mi | 3/2.0 | 1,520 (-15%) | 6mo | $710,000 | $467 | 44 |
| 1537 Beach Ave | 0.61mi | 5/2.0 | 1,548 (-13%) | 8mo | $776,000 | $501 | 44 |
Match score weights: distance 35% · size 25% · config 20% · recency 20%. Top-matched comps best support the ARV.
Projected returns pro-forma
4.08% appreciation · 3.0% rent growth · sell at horizon
- IRR
- 12.3%
- Equity multiple
- 1.75×
- Total profit
- $175,402
- Equity at exit
- $429,466
- IRR
- 13.7%
- Equity multiple
- 3.26×
- Total profit
- $530,838
- Equity at exit
- $705,703
Cash invested: $234,920 (down + closing). Projections, not guarantees.
Landlord ↔ Tenant lean methodology
- Overall (CITY)
- 0 Strongly Tenant-Friendly
- State New York
- 15 Strongly Tenant-Friendly · D+10
- County
- — inherits STATE
- City New York
- 0 Strongly Tenant-Friendly · D+34
ZIP-level market 10472
- Home prices YoY
- 1.8%
- Active inventory
- 54
- Price-to-rent
- 19.2×
Monthly cashflow live
- Estimated rent
- $7,286 medium interval (Pro) →
- Mortgage (P&I)
- −$4,400
- Tax from tax record
- −$608 /mo · $7,291/yr
- Insurance
- −$350
- HOA
- −$0
- Vacancy / Maint / Mgmt
- −$1,530
- Net cashflow
- $399
Break-even live
Sensitivity live
| Price | -10% $874 | -5% $636 | +0% $399 | +5% $162 | +10% $-76 |
|---|---|---|---|---|---|
| Rent | -10% $-177 | -5% $111 | +0% $399 | +5% $687 | +10% $975 |
| Rate | -1.0pp $821 | -0.5pp $612 | base $399 | +0.5pp $182 | +1.0pp $-40 |
2-unit breakdown (identical units grouped — click to expand)
| Units | Beds | Baths | Est. rent |
|---|---|---|---|
| 2× units | 2 | — | $7,286 |
| #1 | 2 | — | $3,643 |
| #2 | 2 | — | $3,643 |
| Total (2 units) | $7,286 | ||
UW: 25.0% down · 7.5% · 30yr · 1.5% tax · 5.0% vac · 8.0% maint · 8.0% mgmt
Financing live
Cash to close
- Down payment
- $209,750
- Closing costs
- $25,170
- Reserves months
- —
- Total cash needed
- —
Loan-product check · same deal, 3 products live
Conventional
25% down · 7.5% · 30yr
- Down + closing
- —
- Monthly P&I
- —
- Monthly cashflow
- —
- DSCR
- —
- Eligible?
- —
Personal DTI + credit; lowest rate.
DSCR
20% down · 8.5% · 30yr
- Down + closing
- —
- Monthly P&I
- —
- Monthly cashflow
- —
- DSCR
- —
- Eligible?
- —
No personal income docs; deal must DSCR.
Hard money
10% down · 12.0% · 12mo
- Down + closing
- —
- Monthly P&I
- —
- Monthly cashflow
- —
- DSCR
- —
- Eligible?
- —
Short-term bridge; refi at stabilization.
Listing history 15 events
-
2026-06-21days on market $839,000 Active 9 DOM
-
2026-06-18days on market $839,000 Active 6 DOM
-
2026-06-17days on market $839,000 Active 5 DOM
-
2026-06-16days on market $839,000 Active 4 DOM
-
2026-06-15days on market $839,000 Active 3 DOM
-
2026-06-13statusdays on market $839,000 Active 1 DOM
-
2026-06-09days on market $839,000 Coming Soon 10 DOM
-
2026-06-08days on market $839,000 Coming Soon 9 DOM
-
2026-06-08days on market $839,000 Coming Soon 8 DOM
-
2026-06-04days on market $839,000 Coming Soon 5 DOM
-
2026-06-03days on market $839,000 Coming Soon 4 DOM
-
2026-06-02days on market $839,000 Coming Soon 3 DOM
-
2026-06-01days on market $839,000 Coming Soon 2 DOM
-
2026-05-31remarks 491-char remark
-
2026-05-31$839,000 Coming Soon 1 DOM
ⓘ Source: listings_history table (triggers on properties + properties_extension) + one-shot
backfill from property_details.listing_events for pre-trigger history.
Tax reassessment forecast NY · Partial reset (capped growth)
- Current annual tax
- $7,291 · $608/mo
- Projected year-2 tax
- $10,735 · $895/mo
- Expected delta
- +$3,444/yr (+$287/mo · 47.2%)
ⓘ Screening estimate from a state-policy table — verify with the county assessor before closing.
Climate risk First Street
- Flood 6/10 Major FEMA zone X (shaded) · 27% chance over 30 yrs
- Wildfire 1/10 Low
- Heat 6/10 Major 7 d/yr ≥99°F today · 15 d/yr by 30 yrs out
- Wind 6/10 Major 27% chance of damaging wind over 30 yrs
- Air quality 4/10 Moderate 5 unhealthy d/yr today · 6 by 30 yrs out
Nearby sold comps map
Loading sold comps map…
Walkable amenities ~0.75 mi
Loading nearby amenities…
Taxation est. · year 1
- Rental income
- $87,432
- − Mortgage interest
- −$46,997
- − Property taxes
- −$7,291
- − Insurance
- −$4,195
- − Repairs & maintenance
- −$6,995
- − Management
- −$6,995
- − Depreciation
- −$24,407
- Taxable loss
- −$9,447
- Est. tax savings @ 24.0%
- +$2,267
- After-tax cash flow
- $7,055/yr
For passive investors: Depreciation is non-cash, so a rental often shows a tax loss while cash-flowing — sheltering income. Rental losses are passive: they offset passive income freely, and up to $25,000/yr can offset ordinary (W-2) income if you actively participate and your MAGI is under $100k (phasing out to $0 by $150k); unused losses carry forward. On sale, claimed depreciation is recaptured at up to 25%, and gains may owe capital-gains tax (a 1031 exchange can defer both). Figures are a year-1 estimate at your 24.0% rate — not tax advice; consult a CPA.
Schools (NCES district)
No district data.
Livability — New York
- Score
- 75/100
- State rank
- #268
- US rank
- #4188
Category grades
Schools grade is shown separately in the Schools card above.
Census & demographics
- Census place
- New York, NY
- City population
- 7,731,280
- Population (ZIP)
- 63,820
Population outlook (Bronx County) Hauer SSP2
- Today (2025)
- 1,607,353 people
- By 2030
- 1,681,852 · +4.6%
- By 2040
- 1,824,421 · +13.5%
- By 2050
- 1,945,470 · +21.0%
- By 2075
- 2,187,887 · +36.1%
- By 2100
- 2,244,136 · +39.6%
Race, ethnicity, and origin ACS 2023
- Neighborhood character
- Diverse neighborhood (Simpson 0.56)
- Race & ethnicity
- Hispanic / Latino 62% Black 23% Two or more races 9% Asian 8% White 2% Native American 1%
- Hispanic origin (detail)
- Mexican 8% Puerto Rican 20% Cuban 1% Dominican 20%
- Foreign-born
- 40% · Canada, Jamaica
- Languages at home
- 36% English-only · Spanish 52% Other Indo-European 7% French/Haitian/Cajun 2%
Political lean MEDSL · Bronx
- 2024 margin
- Solid D (+45.4) · D 72.7% · R 27.3%
- 2008→2024 swing
- -32.3pp toward R · 2008: 77.8pp · 2024: 45.4pp
- All cycles
- 2024: D+45.4 2020: D+67.6 2016: D+79.1 2012: D+82.9 2008: D+77.8
Not yet ingested
- Civics
- —
Market trends
- HPI YoY
- ▲ 4.08%
- Current HPI
- 236.8002
- Rent YoY
- —
- Metro
- —
- State GDP YoY
- ▲ 2.60%
- F500 in state
- 92
Industry mix (Fortune 500 HQ in NY)
| Industry | F500 HQs | Revenue |
|---|---|---|
| Financial Services | 10 | $950B |
|
||
| Consumer Goods | 9 | $162B |
|
||
| Insurance | 4 | $225B |
|
||
| Telecommunications | 2 | $144B |
|
||
| Pharmaceuticals | 2 | $112B |
|
||
| Media / Entertainment | 2 | $69B |
|
||
Price history
+222.7% since first listed3 events — show timeline
- 2026-05-30 Coming Soon $839,000 OneKey® MLS as Distributed by MLS Grid
- 2002-02-20 Sold (Public Records) $300,000 Public Records
- 1989-01-23 Sold (Public Records) $260,000 Public Records
Property tax history
+4.7%/yrLatest (2025): $7,291 · -1.0% YoY. Source: county tax records.
Cash-flow waterfall
monthlySold comps — $/sqft
last 12 mo · ≤1 miLoading sold comps…