 🏗️ New Construction
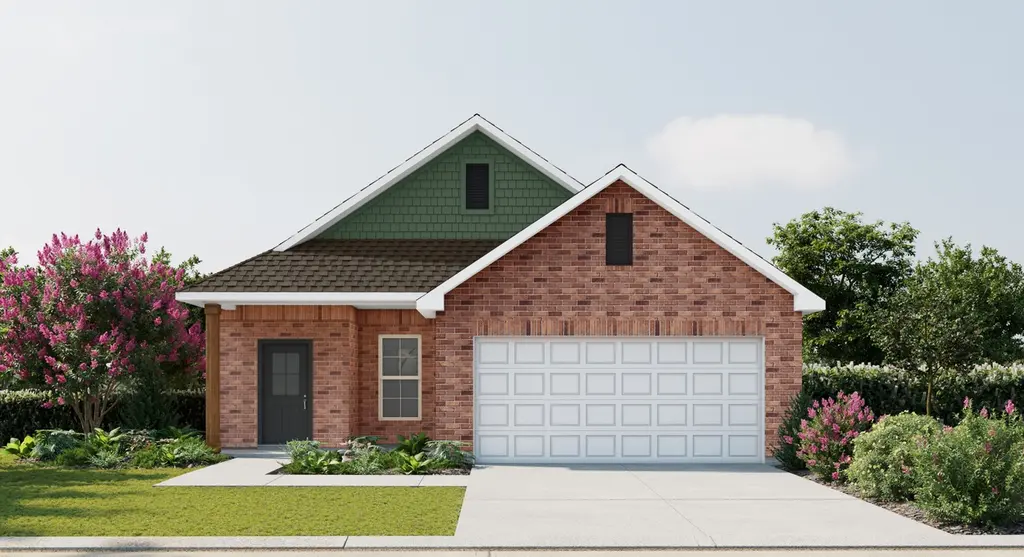
Cherokee II H Plan · Carencro, LA
Flood risk No data
- FEMA flood zone
- —
- Chance of flooding over 30 yrs
- —
- Est. flood insurance / yr
- —
Fire risk No data
- Est. fire insurance / yr
- —
Heat risk No data
- Hot days now (above threshold)
- —
- Hot days in 30 yrs
- —
Wind risk No data
- Chance of severe wind over 30 yrs
- —
Air-quality risk No data
- Unhealthy air days now
- —
- Unhealthy air days in 30 yrs
- —
Risk factors via First Street. Map © Google.
Why this score? — see what drove the F grade
The composite is a weighted blend of 9 inputs, each scored 0–100. Each bar is that input's sub-score; the figure is the points it added to the 100-point composite (weight × sub-score).
- ARV discount +7.5/15.0
- Cash flow +7.0/30.0
- Schools +3.6/10.0
- Livability +3.5/5.0
- Rent growth +2.5/5.0
- 1% rule +1.9/10.0
- DSCR +1.2/10.0
- Condition / age +1.0/5.0
- Appreciation +0.0/10.0
$216,990
🖨 Deal sheet (PDF) 📄 Offer letter ✓ Due diligence
Listing remarks MLS
Discover the Cherokee II H floor plan by DSLD Homes, an energy-efficient home designed to provide maximum comfort, functionality, and style. With 1,458 square feet of living space and a total area of 2,034 square feet, this home offers the perfect balance of spaciousness and energy-saving features, making it ideal for modern families. The open floor plan seamlessly connects the kitchen, dining, and living areas, creating a welcoming and functional space for both everyday living and entertaining. The layout includes four bedrooms and two bathrooms, offering ample room for families to grow, with plenty of space for work or play. The kitchen is designed with modern functionality in mind, featuring recessed can lighting and a walk-in pantry that provides excellent storage for all your kitchen essentials. The walk-in master closet offers generous space for your wardrobe, while the master suite is a true retreat, featuring a garden tub, a separate master shower, and the privacy you deserve. Built with durability and curb appeal, the Cherokee II H boasts a classic brick and siding exterior and a covered rear porch, perfect for outdoor relaxation and enjoyment. The two-car garage offers both convenience and additional storage space. As with all DSLD Homes, the Cherokee II H floor plan is designed with energy-efficient features to help reduce utility costs and minimize environmental impact, while still maintaining a high level of comfort and style. If you're looking for a well-de
Key facts
- 2 garage spots
- Listed 858 days
Neighborhood map
What this means for you Summary
Snapshot
- This is a 4-bed/2.0-bath single-family listed at $217k. Condition is rated poor.
Deal economics
- At list price, monthly cash flow is $-365 ($-4k/yr) — negative.
- To cash-flow at today's rent, offer at most $199k (8.1% below list).
- To meet the 1% rule (rent ≥ 1% of price), the offer needs to be $174k (19.6% below list).
- Recommended offer: $174k (19.6% below list) — sets the bar for 1% rule.
Location & tenants
- Location reads 69/100 on livability (#65 in LA) — a middle-class / working-renter tenant base. Strengths: cost of living A+, housing A+, health & safety A+; Watch: employment C-, crime D, amenities F.
- Lafayette Parish (urban): math 38% / reading 46% proficiency, ranked #19 of 98 in LA (top 19%) — families likely to look elsewhere, expect single-tenant / working-renter base with shorter leases.
- Zoned schools: J. Wallace James Elementary School (math 46% / reading 49%, grade D, #147 of 646 statewide, top 23%, 939 students, 64% FRL); Carencro Middle School (math 18% / reading 28%, grade F, #145 of 218 statewide, top 69%, 665 students, 75% FRL); Carencro High School (math 30% / reading 29%, grade F, #127 of 265 statewide, top 49%, 1,096 students, 69% FRL).
- Market conditions: 281 active listings in the ZIP; 4 comparable units currently listed for rent nearby; rentals lingering (median 46d on market — plan ~5-8 weeks vacancy on turnover, expect pricing pressure); 75% of comp listings sitting > 30 days — soft ceiling on asking rent; 1,585 units permitted in Lafayette Parish in 2024 (10 in 5+ unit buildings).
Forward outlook
- Local home prices are declining (-3.0%/yr); year-one equity from $2k of loan paydown is wiped out by about $8k of value loss. Plan a longer hold.
- Lafayette County population projected at +34% by 2050 — long-run rental-demand tailwind backs the buy-and-hold thesis.
Negotiation context
- It's been on market 858 days — a 12% lower offer ($191k) is reasonable based on typical stale-listing flexibility.
Questions for the listing agent
- What do current leases actually rent for vs. the listed asking? Can we see a recent rent roll and the last 12 months of T-12 income?
- It's been on market 858 days. Have you received any prior offers? Is the seller open to a 20% concession, seller financing, or rate buy-down credit?
- Have any recent inspections been done? Can we get a copy of the seller's disclosures and any deferred-maintenance estimates?
- Why hasn't it sold? Are there any deal-killer items the seller is aware of (foundation, flood, title, zoning, code violations)?
- Is there a deadline driving the sale (1031 exchange, divorce, estate, relocation)? That informs how much negotiation room exists.
- Crime grade is D in this area — have there been break-ins, vandalism, or insurance claims at this property in the last 3 years? What carrier currently insures it and at what premium?
- The area grade is low — what's the realistic commute time and amenity access for the typical tenant pool here? Any planned neighborhood developments (good or bad) we should know about?
- What's the average days-on-market for RENTAL listings here right now (not sales)? A rising rental-DOM trend means longer vacancies and softer asking-rent achievability than the comps imply.
- What's the recent tenant-quality profile in this submarket — average credit score on applications, eviction rate, late-payment / NSF rate, and stable-employment percentage? A property-management company in the area should have these aggregated.
- How much new for-sale + rental construction is in the pipeline within 1–3 miles? Heavy new supply typically softens prices + rents 12–24 months out; constrained supply supports both.
Investment metrics
- 1% rule
- 0.69% ✗
- Cap rate
- 4.56%
- Cash-on-cash
- -6.21%
- DSCR
- 0.72
- GRM
- 12.1
CMA / ARV
- ARV (median comp)
- $252,279
- List price
- $216,990
- Delta
- -13.99%
- Verdict
- UNDERPRICED
- Comps
- 20 within 1.0 mi
Show comp detail 12 sales within ~0.75 mi
| Address | Dist | Beds/Ba | Sqft | Sold | Price | $/sf | Match |
|---|---|---|---|---|---|---|---|
| 211 Cainwood Ct | 0.26mi | 3/2.0 (-1) | 1,422 (-2%) | 2mo | $220,177 | $155 | 77 |
| 103 Island Nest Cv | 0.25mi | 3/2.0 (-1) | 1,495 (+2%) | 4mo | $219,900 | $147 | 76 |
| 102 Linares St | 0.30mi | 3/2.0 (-1) | 1,427 (-2%) | 2mo | $162,000 | $114 | 76 |
| 104 White Stripe Cv | 0.40mi | 3/2.0 (-1) | 1,478 (+1%) | 2mo | $217,500 | $147 | 72 |
| 103 Linares St | 0.33mi | 3/1.0 (-1) | 1,500 (+3%) | 2mo | $95,000 | $63 | 69 |
| 405 Auburn Dr | 0.24mi | 3/2.0 (-1) | 1,345 (-8%) | 2mo | $135,000 | $100 | 69 |
| 214 Hester Way | 0.08mi | 3/2.0 (-1) | 1,283 (-12%) | 3mo | $210,700 | $164 | 69 |
| 902 Pelican Ridge Cv | 0.48mi | 3/2.0 (-1) | 1,410 (-3%) | 1mo | $200,000 | $142 | 66 |
| 209 Cainwood Ct | 0.25mi | 3/2.0 (-1) | 1,321 (-9%) | 3mo | $210,787 | $160 | 65 |
| 129 Bradford Dr | 0.45mi | 3/1.5 (-1) | 1,362 (-7%) | 3mo | $72,800 | $53 | 59 |
| 126 Bradford Dr | 0.46mi | 4/3.0 | 1,631 (+12%) | 1mo | $75,000 | $46 | 54 |
| 105 Starboard Loop | 0.61mi | 4/2.0 | 1,623 (+11%) | 1mo | $225,000 | $139 | 52 |
Match score weights: distance 35% · size 25% · config 20% · recency 20%. Top-matched comps best support the ARV.
Projected returns pro-forma
-3.0% appreciation · 3.0% rent growth · sell at horizon
- IRR
- -27.0%
- Equity multiple
- 0.09×
- Total profit
- $-64,122
- Equity at exit
- $37,616
- IRR
- -24.6%
- Equity multiple
- -0.21×
- Total profit
- $-85,691
- Equity at exit
- $21,812
Cash invested: $70,638 (down + closing). Projections, not guarantees.
Landlord ↔ Tenant lean methodology
- Overall (STATE)
- 90 Strongly Landlord-Friendly
- State Louisiana
- 90 Strongly Landlord-Friendly · R+12
- County
- — inherits STATE
- City
- — inherits STATE
ZIP-level market 70520
- Home prices YoY
- -17.6%
- Active inventory
- 281
- Price-to-rent
- 10.4×
Monthly cashflow live
- Estimated rent
- $1,744 medium interval (Pro) →
- Mortgage (P&I)
- −$1,323
- Tax est. 1.5%
- −$315 /mo · $3,784/yr
- Insurance
- −$105
- HOA
- −$0
- Vacancy / Maint / Mgmt
- −$366
- Net cashflow
- $-365
Break-even live
Sensitivity live
| Price | -10% $-191 | -5% $-278 | +0% $-365 | +5% $-453 | +10% $-540 |
|---|---|---|---|---|---|
| Rent | -10% $-503 | -5% $-434 | +0% $-365 | +5% $-296 | +10% $-228 |
| Rate | -1.0pp $-238 | -0.5pp $-301 | base $-365 | +0.5pp $-431 | +1.0pp $-497 |
UW: 25.0% down · 7.5% · 30yr · 1.5% tax · 5.0% vac · 8.0% maint · 8.0% mgmt
Financing live
Cash to close
- Down payment
- $63,070
- Closing costs
- $7,568
- Reserves months
- —
- Total cash needed
- —
Loan-product check · same deal, 3 products live
Conventional
25% down · 7.5% · 30yr
- Down + closing
- —
- Monthly P&I
- —
- Monthly cashflow
- —
- DSCR
- —
- Eligible?
- —
Personal DTI + credit; lowest rate.
DSCR
20% down · 8.5% · 30yr
- Down + closing
- —
- Monthly P&I
- —
- Monthly cashflow
- —
- DSCR
- —
- Eligible?
- —
No personal income docs; deal must DSCR.
Hard money
10% down · 12.0% · 12mo
- Down + closing
- —
- Monthly P&I
- —
- Monthly cashflow
- —
- DSCR
- —
- Eligible?
- —
Short-term bridge; refi at stabilization.
Rent comps 4 comps
| Address | Beds | Baths | Sqft | Rent | $/sqft | DOM | Units | Dist |
|---|---|---|---|---|---|---|---|---|
| 219 Oak Path Dr Carencro, LA | 3.0 | 2.0 | 1615 | $1,900 | $1.18 | 45d | 1 | 0.75mi |
| 124 Saint Fabian Dr Carencro, LA | 3.0 | 2.0 | 1450 | $1,700 | $1.17 | 45d | 1 | 1.11mi |
| 124 Saint Fabian Dr Carencro, LA | 3.0 | 2.0 | 1441 | $1,650 | $1.15 | 23d | 1 | 1.11mi |
| 115 Northpointe Dr Carencro, LA | 3.0 | 2.0 | 1696 | $1,650 | $0.97 | 45d | 1 | 1.30mi |
Listing history 18 events
-
2026-06-21days on market $216,990 Active 858 DOM
-
2026-06-18days on market $216,990 Active 855 DOM
-
2026-06-17days on market $216,990 Active 854 DOM
-
2026-06-16days on market $216,990 Active 853 DOM
-
2026-06-15days on market $216,990 Active 852 DOM
-
2026-06-14days on market $216,990 Active 850 DOM
-
2026-06-13days on market $216,990 Active 849 DOM
-
2026-06-10days on market $216,990 Active 847 DOM
-
2026-06-09days on market $216,990 Active 846 DOM
-
2026-06-08days on market $216,990 Active 845 DOM
-
2026-06-07days on market $216,990 Active 844 DOM
-
2026-06-05days on market $216,990 Active 841 DOM
-
2026-06-03days on market $216,990 Active 840 DOM
-
2026-06-02days on market $216,990 Active 839 DOM
-
2026-06-01days on market $216,990 Active 838 DOM
-
2026-05-31days on market $216,990 Active 837 DOM
-
2026-05-30days on market $216,990 Active 836 DOM
-
2024-02-14$216,990 Active 1495-char remark
Show marketing remark (1495 chars)
Discover the Cherokee II H floor plan by DSLD Homes, an energy-efficient home designed to provide maximum comfort, functionality, and style. With 1,458 square feet of living space and a total area of 2,034 square feet, this home offers the perfect balance of spaciousness and energy-saving features, making it ideal for modern families. The open floor plan seamlessly connects the kitchen, dining, and living areas, creating a welcoming and functional space for both everyday living and entertaining. The layout includes four bedrooms and two bathrooms, offering ample room for families to grow, with plenty of space for work or play. The kitchen is designed with modern functionality in mind, featuring recessed can lighting and a walk-in pantry that provides excellent storage for all your kitchen essentials. The walk-in master closet offers generous space for your wardrobe, while the master suite is a true retreat, featuring a garden tub, a separate master shower, and the privacy you deserve. Built with durability and curb appeal, the Cherokee II H boasts a classic brick and siding exterior and a covered rear porch, perfect for outdoor relaxation and enjoyment. The two-car garage offers both convenience and additional storage space. As with all DSLD Homes, the Cherokee II H floor plan is designed with energy-efficient features to help reduce utility costs and minimize environmental impact, while still maintaining a high level of comfort and style. If you're looking for a well-de
ⓘ Source: listings_history table (triggers on properties + properties_extension) + one-shot
backfill from property_details.listing_events for pre-trigger history.
Nearby sold comps map
Loading sold comps map…
Walkable amenities ~0.75 mi
Loading nearby amenities…
Taxation est. · year 1
- Rental income
- $20,933
- − Mortgage interest
- −$14,132
- − Property taxes
- −$3,784
- − Insurance
- −$1,261
- − Repairs & maintenance
- −$1,675
- − Management
- −$1,675
- − Depreciation
- −$7,339
- Taxable loss
- −$8,932
- Est. tax savings @ 24.0%
- +$2,144
- After-tax cash flow
- $-2,240/yr
For passive investors: Depreciation is non-cash, so a rental often shows a tax loss while cash-flowing — sheltering income. Rental losses are passive: they offset passive income freely, and up to $25,000/yr can offset ordinary (W-2) income if you actively participate and your MAGI is under $100k (phasing out to $0 by $150k); unused losses carry forward. On sale, claimed depreciation is recaptured at up to 25%, and gains may owe capital-gains tax (a 1031 exchange can defer both). Figures are a year-1 estimate at your 24.0% rate — not tax advice; consult a CPA.
Condition & rehab AI · 3 photos
The property is in poor condition with significant repairs and maintenance needed, including road repair, landscaping, and exterior painting. These improvements would significantly increase its resale and rental value.
Repairs flagged
- Major Road repair — Cracked asphalt road
- Major Landscaping — Overgrown grass and no visible landscaping
- Major Exterior painting — No visible siding or paint condition
Value-add opportunities
- Resale Road repair — Improves accessibility and property value
- Resale Landscaping — Enhances curb appeal and property value
- Resale Exterior painting — Improves property appearance and value
Renovation cost estimate screening
| Repair item | Severity | Est. cost |
|---|---|---|
| Road repair · Cracked asphalt road | Major | $15,000–50,000 |
| Landscaping · Overgrown grass and no visible landscaping | Major | $15,000–50,000 |
| Exterior painting · No visible siding or paint condition | Major | $15,000–50,000 |
| Total estimated repair cost · 3 items | $45,000–150,000 |
Value-add ROI direction
- Resale Road repair — Improves accessibility and property value ↑
- Resale Landscaping — Enhances curb appeal and property value ↑
- Resale Exterior painting — Improves property appearance and value ↑
ⓘ Cost ranges are severity-bucket heuristics (US national rule-of-thumb). Get contractor quotes + a written scope before underwriting a rehab budget.
Schools (NCES district)
- District
- Lafayette Parish
- NCES district ID
- 2200870
- Math proficiency
- 38% ▼ -32.00%
- Reading proficiency
- 46% ▼ -24.00%
- Median HH income
- $50,238
- Composite
- 36.15/100
- National rank
- #4741
- State rank
- #19 of 98 in LA
Livability — Carencro
- Score
- 69/100
- State rank
- #65
- US rank
- #8277
Category grades
Schools grade is shown separately in the Schools card above.
Census & demographics
- Census place
- Carencro, LA
- City population
- 20,134
- Population (ZIP)
- 20,134
Population outlook (Lafayette County) Hauer SSP2
- Today (2025)
- 280,930 people
- By 2030
- 301,092 · +7.2%
- By 2040
- 339,456 · +20.8%
- By 2050
- 375,156 · +33.5%
- By 2075
- 451,672 · +60.8%
- By 2100
- 497,203 · +77.0%
Race, ethnicity, and origin ACS 2023
- Neighborhood character
- Diverse neighborhood (Simpson 0.56)
- Race & ethnicity
- White 58% Black 32% Two or more races 5% Hispanic / Latino 3% Asian 2%
- Common ancestry
- Lithuanian 13% Scotch-Irish 2% Italian 1%
- Foreign-born
- 2% · Canada
- Languages at home
- 92% English-only · French/Haitian/Cajun 5% Spanish 1% Other Indo-European 1%
Political lean MEDSL · Lafayette
- 2024 margin
- Solid R (+31.4) · D 33.5% · R 64.8% · Other 1.7%
- 2008→2024 swing
- -0.1pp no change · 2008: -31.3pp · 2024: -31.4pp
- All cycles
- 2024: R+31.4 2020: R+28.7 2016: R+33.6 2012: R+33.7 2008: R+31.3
Not yet ingested
- Civics
- —
Market trends
- HPI YoY
- ▼ -33.62%
- Current HPI
- 157.0194
- Rent YoY
- —
- Metro
- —
- State GDP YoY
- ▲ 3.29%
- F500 in state
- 10
Industry mix (Fortune 500 HQ in LA)
| Industry | F500 HQs | Revenue |
|---|---|---|
| Telecommunications | 2 | $23B |
|
||
| Utilities | 1 | $12B |
|
||
| Wholesale / Distribution | 1 | $5B |
|
||
| Advertising | 1 | $2B |
|
||
Price history
1 event — show timeline
- 2024-02-14 Listed $216,990 Zillow
Cash-flow waterfall
monthlySold comps — $/sqft
last 12 mo · ≤1 miLoading sold comps…