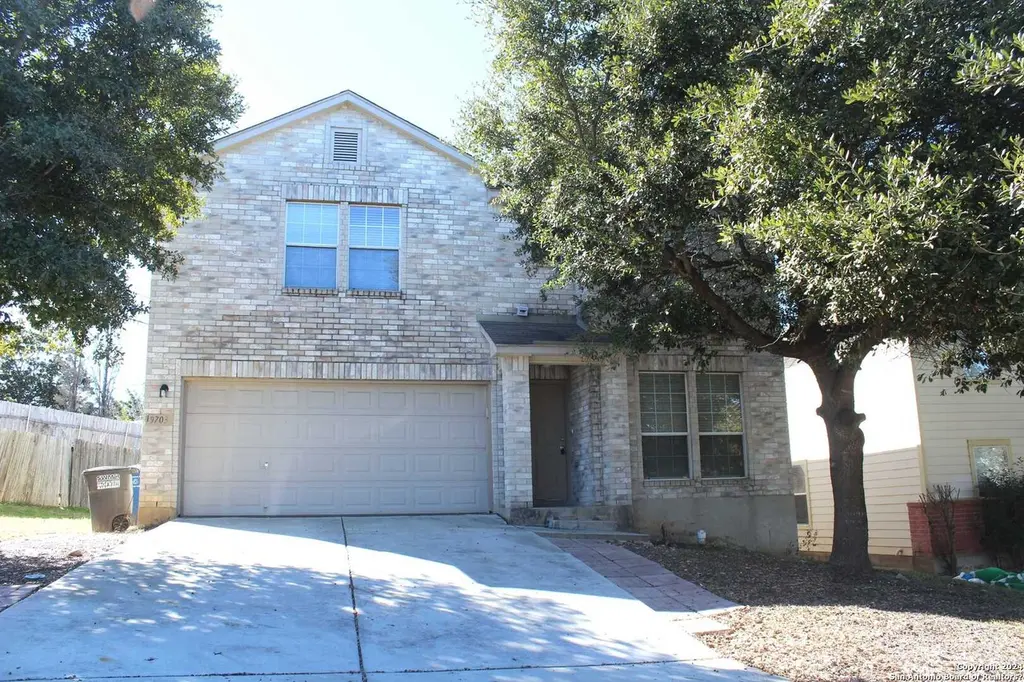
9703 Battle Pass · San Antonio, TX
Flood risk 1/10 · Minimal
- FEMA flood zone
- X (unshaded)
- Chance of flooding over 30 yrs
- 0.0%
- Est. flood insurance / yr
- $507 – $1,088
Fire risk 1/10 · Minimal
- Est. fire insurance / yr
- $1,222 – $2,270
Heat risk 8/10 · Major
- Hot days now (above 107°F)
- 7 days/yr
- Hot days in 30 yrs
- 22 days/yr
Wind risk 8/10 · Major
- Chance of severe wind over 30 yrs
- 80.0%
Air-quality risk 2/10 · Minimal
- Unhealthy air days now
- 0 days/yr
- Unhealthy air days in 30 yrs
- 1 days/yr
Risk factors via First Street. Map © Google.
Why this score? — see what drove the D- grade
The composite is a weighted blend of 9 inputs, each scored 0–100. Each bar is that input's sub-score; the figure is the points it added to the 100-point composite (weight × sub-score).
- ARV discount +12.5/15.0
- Cash flow +6.2/30.0
- Appreciation +5.0/10.0
- Livability +4.0/5.0
- Schools +3.8/10.0
- 1% rule +2.5/10.0
- Rent growth +2.5/5.0
- Condition / age +2.5/5.0
- DSCR +0.5/10.0
$239,000
🖨 Deal sheet 📄 Offer letter ✓ Due diligence
Listing remarks MLS
Welcome to your dream home! This spacious and beautifully-maintained Culi Sac property features ample living spaces, 4 bedrooms, Game room, and 2.5 baths, providing all the room you need to comfortably accommodate your family and guests. As you enter the home, you'll be impressed by the open floor plan that seamlessly flows from the dining area to the living room and kitchen. Recently upgraded to modern laminate flooring, the ground floor is both bright and inviting. Conveniently located only a few minutes
Key facts
- 7,666 sq ft lot
- 2 garage spots
- Built 2006
Neighborhood map
What this means for you Summary
Snapshot
- This is a 4-bed/2.5-bath single-family listed at $239k.
Deal economics
- At list price, monthly cash flow is $-439 ($-5k/yr) — negative.
- To cash-flow at today's rent, offer at most $161k (32.4% below list).
- To meet the 1% rule (rent ≥ 1% of price), the offer needs to be $179k (25.0% below list).
- Recommended offer: $161k (32.4% below list) — sets the bar for cash-flow.
Location & tenants
- Location reads 80/100 on livability (#31 in TX, #1,616 nationally) — a professional / high-income tenant draw. Strengths: amenities A+, commute A+, cost of living A+; Watch: schools C-, crime F.
- North East ISD (urban): math 38% / reading 49% proficiency, ranked #276 of 826 in TX (top 33%) — families likely to look elsewhere, expect single-tenant / working-renter base with shorter leases.
- Market conditions: 1 active listings in the ZIP; 40 comparable units currently listed for rent nearby; rentals at typical pace (median 19d on market — plan ~3-4 weeks tenant-placement turnaround); 8,308 units permitted in Bexar County in 2024 (2,506 in 5+ unit buildings).
Forward outlook
- In year one you build about $9k of equity ($2k loan paydown + $7k appreciation (3.0% local appreciation)).
- Bexar County population projected at +50% by 2050 — long-run rental-demand tailwind backs the buy-and-hold thesis.
- By year 5, paydown + projected appreciation supports a ~$38k cash-out refi (75% LTV) — recoverable capital for the next deal without selling this one.
Negotiation context
- It's been on market 105 days — a 9% lower offer ($217k) is reasonable based on typical stale-listing flexibility.
- 6 sale attempts since 20y ago with the ask held roughly flat each time — persistent listings suggest the price (not the market) is what's stuck; bring a comps-based counter.
Risks & watch-outs
- Climate carrying-cost: severe wind risk, 80% chance of damaging wind over 30y; extreme-heat days projected 7→22/yr by 2055 (HVAC capex compounding) — expect insurance premiums to compound above CPI over the hold.
Questions for the listing agent
- What do current leases actually rent for vs. the listed asking? Can we see a recent rent roll and the last 12 months of T-12 income?
- It's been on market 105 days. Have you received any prior offers? Is the seller open to a 32% concession, seller financing, or rate buy-down credit?
- What does the HOA fee cover, when was the last increase, and are there any pending special assessments or reserve-fund shortfalls?
- Why hasn't it sold? Are there any deal-killer items the seller is aware of (foundation, flood, title, zoning, code violations)?
- Is there a deadline driving the sale (1031 exchange, divorce, estate, relocation)? That informs how much negotiation room exists.
- Crime grade is F in this area — have there been break-ins, vandalism, or insurance claims at this property in the last 3 years? What carrier currently insures it and at what premium?
- The area grade is low — what's the realistic commute time and amenity access for the typical tenant pool here? Any planned neighborhood developments (good or bad) we should know about?
- What's the average days-on-market for RENTAL listings here right now (not sales)? A rising rental-DOM trend means longer vacancies and softer asking-rent achievability than the comps imply.
- What's the recent tenant-quality profile in this submarket — average credit score on applications, eviction rate, late-payment / NSF rate, and stable-employment percentage? A property-management company in the area should have these aggregated.
- How much new for-sale + rental construction is in the pipeline within 1–3 miles? Heavy new supply typically softens prices + rents 12–24 months out; constrained supply supports both.
Investment metrics
- 1% rule
- 0.75% ✗
- Cap rate
- 4.09%
- Cash-on-cash
- -7.87%
- DSCR
- 0.65
- GRM
- 11.1
CMA / ARV
- ARV (median comp)
- $268,885
- List price
- $239,000
- Delta
- -11.11%
- Verdict
- UNDERPRICED
- Comps
- 20 within 1.0 mi
Show comp detail 12 sales within ~0.75 mi
| Address | Dist | Beds/Ba | Sqft | Sold | Price | $/sf | Match |
|---|---|---|---|---|---|---|---|
| 9301 Windboro Dr | 0.13mi | 3/2.0 (-1) | 2,067 (-1%) | 1mo | $290,000 | $140 | 84 |
| 6022 Royal Wood | 0.46mi | 4/2.5 | 2,049 (-2%) | 0mo | $289,900 | $141 | 76 |
| 526 Crestway Dr | 0.48mi | 3/2.0 (-1) | 2,155 (+3%) | 1mo | $360,000 | $167 | 64 |
| 749 Windrock | 0.56mi | 3/2.0 (-1) | 2,049 (-2%) | 3mo | $319,999 | $156 | 62 |
| 115 Booker Palm | 0.53mi | 3/2.5 (-1) | 2,175 (+4%) | 3mo | $239,900 | $110 | 61 |
| 1905 Walter Raleigh | 0.63mi | 4/2.0 | 2,162 (+4%) | 4mo | $299,900 | $139 | 59 |
| 8718 Midcrown | 0.68mi | 3/2.0 (-1) | 1,973 (-5%) | 1mo | $249,900 | $127 | 51 |
| 450 Spaceway Dr | 0.73mi | 4/3.5 | 2,227 (+7%) | 1mo | $325,000 | $146 | 50 |
| 10267 King Robert | 0.74mi | 3/2.0 (-1) | 1,996 (-4%) | 3mo | $356,990 | $179 | 49 |
| 10275 King Robert | 0.74mi | 3/2.0 (-1) | 1,929 (-8%) | 1mo | $358,990 | $186 | 45 |
| 6035 Royal Breeze | 0.70mi | 3/2.0 (-1) | 1,846 (-12%) | 2mo | $290,000 | $157 | 39 |
| 10215 Red London | 0.72mi | 4/3.5 | 2,397 (+15%) | 2mo | $389,990 | $163 | 36 |
Match score weights: distance 35% · size 25% · config 20% · recency 20%. Top-matched comps best support the ARV.
Projected returns pro-forma
3.0% appreciation · 3.0% rent growth · sell at horizon
- IRR
- 0.3%
- Equity multiple
- 1.01×
- Total profit
- $991
- Equity at exit
- $107,465
- IRR
- 4.2%
- Equity multiple
- 1.64×
- Total profit
- $42,947
- Equity at exit
- $165,616
Cash invested: $66,920 (down + closing). Projections, not guarantees.
Landlord ↔ Tenant lean methodology
- Overall (STATE)
- 87 Strongly Landlord-Friendly
- State Texas
- 87 Strongly Landlord-Friendly · R+5
- County
- — inherits STATE
- City
- — inherits STATE
ZIP-level market 78239-1849
- Active inventory
- 1
- Price-to-rent
- 11.1×
Monthly cashflow live
- Estimated rent
- $1,792 high interval (Pro) →
- Mortgage (P&I)
- −$1,253
- Tax from tax record
- −$472 /mo · $5,669/yr
- Insurance
- −$100
- HOA
- −$29
- Vacancy / Maint / Mgmt
- −$376
- Net cashflow
- $-439
Break-even live
UW: 25.0% down · 7.5% · 30yr · 1.5% tax · 5.0% vac · 8.0% maint · 8.0% mgmt
Financing live
Cash to close
- Down payment
- $59,750
- Closing costs
- $7,170
- Reserves months
- —
- Total cash needed
- —
Loan-product check · same deal, 3 products live
Conventional
25% down · 7.5% · 30yr
- Down + closing
- —
- Monthly P&I
- —
- Monthly cashflow
- —
- DSCR
- —
- Eligible?
- —
Personal DTI + credit; lowest rate.
DSCR
20% down · 8.5% · 30yr
- Down + closing
- —
- Monthly P&I
- —
- Monthly cashflow
- —
- DSCR
- —
- Eligible?
- —
No personal income docs; deal must DSCR.
Hard money
10% down · 12.0% · 12mo
- Down + closing
- —
- Monthly P&I
- —
- Monthly cashflow
- —
- DSCR
- —
- Eligible?
- —
Short-term bridge; refi at stabilization.
Rent comps 40 comps
| Address | Beds | Baths | Sqft | Rent | $/sqft | DOM | Units | Dist |
|---|---|---|---|---|---|---|---|---|
| 10006 Fisherman Pier San Antonio, TX | 3.0 | 2.5 | 2719 | $1,850 | $0.68 | 19d | 1 | 0.22mi |
| 10314 Pinehurst Run San Antonio, TX | 4.0 | 3.0 | 2380 | $2,150 | $0.90 | 3d | 1 | 0.44mi |
| 10503 Ludlow Ct San Antonio, TX | 4.0 | 2.0 | 1690 | $1,100 | $0.65 | 4d | 1 | 0.51mi |
| 160 Booker Palm San Antonio, TX | 3.0 | 2.5 | 1721 | $1,610 | $0.94 | 4d | 1 | 0.51mi |
| 127 Booker Palm San Antonio, TX | 3.0 | 2.5 | 1680 | $1,600 | $0.95 | 23d | 1 | 0.52mi |
| 34 Basin Elm San Antonio, TX | 3.0 | 2.5 | 1627 | $1,600 | $0.98 | 23d | 1 | 0.53mi |
| 60 Adkins Rdg San Antonio, TX | 4.0 | 2.5 | 2175 | $1,715 | $0.79 | 43d | 1 | 0.53mi |
| 5838 Royal Bnd San Antonio, TX | 3.0 | 2.5 | 1908 | $1,850 | $0.97 | 10d | 1 | 0.54mi |
| 1202 Murray Winn Windcrest, TX | 5.0 | 3.5 | 2860 | $2,350 | $0.82 | 4d | 1 | 0.55mi |
| 18 Anchorage Bay San Antonio, TX | 3.0 | 2.5 | 1585 | $1,750 | $1.10 | 21d | 1 | 0.55mi |
| 14 Adkins Rdg San Antonio, TX | 3.0 | 2.5 | 1680 | $1,625 | $0.97 | 21d | 1 | 0.56mi |
| 19 Bedford Bay San Antonio, TX | 3.0 | 2.5 | 1721 | $1,749 | $1.02 | 1d | 1 | 0.56mi |
| 19 Bedford Bay San Antonio, TX | 3.0 | 3.0 | 1721 | $2,129 | $1.24 | 23d | 1 | 0.56mi |
| 11 Basin Elm San Antonio, TX | 3.0 | 2.5 | 1437 | $1,550 | $1.08 | 4d | 1 | 0.57mi |
| 7 Beacon Oak San Antonio, TX | 3.0 | 2.5 | 1446 | $1,699 | $1.17 | 2d | 1 | 0.57mi |
| 3 Basin Elm San Antonio, TX | 3.0 | 2.0 | 1437 | $1,715 | $1.19 | 20d | 1 | 0.58mi |
| 18 Beacon Bay San Antonio, TX | 3.0 | 2.5 | 1441 | $1,695 | $1.18 | 43d | 1 | 0.59mi |
| 42 Beacon Bay San Antonio, TX | 3.0 | 2.5 | 1899 | $1,695 | $0.89 | 23d | 1 | 0.61mi |
| 10527 Sonora Sunset San Antonio, TX | 3.0 | 2.5 | 1582 | $1,599 | $1.01 | 20d | 1 | 0.76mi |
| 10527 Sonora Sunset San Antonio, TX | 3.0 | 2.5 | 1582 | $1,599 | $1.01 | 7d | 1 | 0.76mi |
| 6406 Ithaca Fls San Antonio, TX | 3.0 | 2.5 | 1508 | $1,500 | $0.99 | 10d | 1 | 0.79mi |
| 6118 Windy Knl Windcrest, TX | 4.0 | 3.0 | 2950 | $2,100 | $0.71 | 23d | 1 | 0.81mi |
| 6426 Royal Rdg San Antonio, TX | 3.0 | 2.5 | 2316 | $1,895 | $0.82 | 23d | 1 | 0.85mi |
| 6503 Ithaca Frst San Antonio, TX | 3.0 | 2.0 | 1630 | $1,695 | $1.04 | 43d | 1 | 0.87mi |
| 6722 Badger Pass Dr San Antonio, TX | 4.0 | 2.0 | 2180 | $1,795 | $0.82 | 4d | 1 | 0.92mi |
| 425 Zephyr Dr Windcrest, TX | 3.0 | 2.0 | 2080 | $1,900 | $0.91 | 23d | 1 | 0.92mi |
| 6527 Ithaca Fls San Antonio, TX | 3.0 | 2.5 | 1528 | $1,850 | $1.21 | 4d | 1 | 0.92mi |
| 10830 Indigo Crk San Antonio, TX | 4.0 | 2.5 | 2413 | $1,970 | $0.82 | 43d | 1 | 0.95mi |
| 8818 Bridington San Antonio, TX | 3.0 | 2.0 | 1814 | $2,100 | $1.16 | 13d | 1 | 0.97mi |
| 9318 Bending Crst San Antonio, TX | 4.0 | 2.5 | 1879 | $1,700 | $0.90 | 10d | 1 | 0.99mi |
| 10958 Crown Park San Antonio, TX | 3.0 | 2.5 | 1750 | $1,500 | $0.86 | 10d | 1 | 1.00mi |
| 6811 Evercrest Ln San Antonio, TX | 3.0 | 2.5 | 1582 | $2,100 | $1.33 | 23d | 1 | 1.06mi |
| 409 Fenwick Dr Windcrest, TX | 4.0 | 2.0 | 2284 | $1,995 | $0.87 | 16d | 1 | 1.14mi |
| 8111 Rain Frst San Antonio, TX | 4.0 | 2.5 | 2008 | $2,050 | $1.02 | 1d | 1 | 1.16mi |
| 8111 Rain Frst San Antonio, TX | 4.0 | 3.0 | 2008 | $2,050 | $1.02 | 21d | 1 | 1.16mi |
| 6704 Wayman Rdg San Antonio, TX | 4.0 | 2.5 | 2900 | $2,600 | $0.90 | 23d | 1 | 1.19mi |
| 8731 Tradewind Dr Windcrest, TX | 3.0 | 2.5 | 1750 | $1,350 | $0.77 | 14d | 1 | 1.28mi |
| 6718 Chelsea Wood San Antonio, TX | 5.0 | 3.0 | 2247 | $1,950 | $0.87 | 4d | 1 | 1.30mi |
| 6607 Shadden Oaks San Antonio, TX | 3.0 | 2.0 | 1525 | $1,800 | $1.18 | 23d | 1 | 1.33mi |
| 9839 Logans Ridge Dr Converse, TX | 4.0 | 2.5 | 1988 | $1,695 | $0.85 | 4d | 1 | 1.34mi |
HOA detail
- Monthly dues
- $29 · $348/yr
Listing history 30 events
-
2026-06-18days on market $239,000 Active 105 DOM
-
2026-06-17days on market $239,000 Active 104 DOM
-
2026-06-16days on market $239,000 Active 103 DOM
-
2026-06-13days on market $239,000 Active 100 DOM
-
2026-06-13statusdays on market $239,000 Active 99 DOM
-
2026-06-09days on market $239,000 Price Change 96 DOM
-
2026-06-08days on market $239,000 Price Change 95 DOM
-
2026-06-07days on market $239,000 Price Change 94 DOM
-
2026-06-04days on market $239,000 Price Change 91 DOM
-
2026-06-03days on market $239,000 Price Change 90 DOM
-
2026-06-02days on market $239,000 Price Change 89 DOM
-
2026-06-02pricestatus $239,000 Price Change 88 DOM
-
2026-06-01days on market $249,000 Active 88 DOM
-
2026-05-31days on market $249,000 Active 87 DOM
-
2026-04-07price $249,000 511-char remark
Show marketing remark (511 chars)
Welcome to your dream home! This spacious and beautifully-maintained Culi Sac property features ample living spaces, 4 bedrooms, Game room, and 2.5 baths, providing all the room you need to comfortably accommodate your family and guests. As you enter the home, you'll be impressed by the open floor plan that seamlessly flows from the dining area to the living room and kitchen. Recently upgraded to modern laminate flooring, the ground floor is both bright and inviting. Conveniently located only a few minutes
-
2026-03-05$249,999 New 511-char remark
Show marketing remark (511 chars)
Welcome to your dream home! This spacious and beautifully-maintained Culi Sac property features ample living spaces, 4 bedrooms, Game room, and 2.5 baths, providing all the room you need to comfortably accommodate your family and guests. As you enter the home, you'll be impressed by the open floor plan that seamlessly flows from the dining area to the living room and kitchen. Recently upgraded to modern laminate flooring, the ground floor is both bright and inviting. Conveniently located only a few minutes
-
2024-05-14historical
-
2024-05-09price $279,000
-
2024-04-28historical $1,800
-
2024-03-01$1,800
-
2024-02-20price $283,000
-
2024-02-20historical $1,850
-
2024-02-10$1,850
-
2024-01-30$289,000 New
-
2014-03-20soldstatus Sold
-
2014-02-05status Pending
-
2014-01-27$96,000 New
-
2006-09-13soldstatus
-
2006-09-06historical
-
2006-09-05$150,254
ⓘ Source: listings_history table (triggers on properties + properties_extension) + one-shot
backfill from property_details.listing_events for pre-trigger history.
Tax reassessment forecast TX · Resets to sale price
- Current annual tax
- $5,669 · $472/mo
- Projected year-2 tax
- $5,669 · $472/mo
- Expected delta
- $0/yr ($0/mo · 0.0%)
ⓘ Screening estimate from a state-policy table — verify with the county assessor before closing.
Climate risk First Street
- Flood 1/10 Low FEMA zone X (unshaded) · 0% chance over 30 yrs
- Wildfire 1/10 Low
- Heat 8/10 Severe 7 d/yr ≥107°F today · 22 d/yr by 30 yrs out
- Wind 8/10 Severe 80% chance of damaging wind over 30 yrs
- Air quality 2/10 Low 0 unhealthy d/yr today · 1 by 30 yrs out
Nearby sold comps map
Loading sold comps map…
Walkable amenities ~0.75 mi
Loading nearby amenities…
Taxation est. · year 1
- Rental income
- $21,501
- − Mortgage interest
- −$13,388
- − Property taxes
- −$5,669
- − Insurance
- −$1,195
- − Repairs & maintenance
- −$1,720
- − Management
- −$1,720
- − HOA
- −$348
- − Depreciation
- −$6,953
- Taxable loss
- −$9,492
- Est. tax savings @ 24.0%
- +$2,278
- After-tax cash flow
- $-2,988/yr
For passive investors: Depreciation is non-cash, so a rental often shows a tax loss while cash-flowing — sheltering income. Rental losses are passive: they offset passive income freely, and up to $25,000/yr can offset ordinary (W-2) income if you actively participate and your MAGI is under $100k (phasing out to $0 by $150k); unused losses carry forward. On sale, claimed depreciation is recaptured at up to 25%, and gains may owe capital-gains tax (a 1031 exchange can defer both). Figures are a year-1 estimate at your 24.0% rate — not tax advice; consult a CPA.
Schools (NCES district)
- District
- North East ISD
- NCES district ID
- 4832940
- Math proficiency
- 38% ▼ -14.00%
- Reading proficiency
- 49% ▼ -4.00%
- Median HH income
- $57,715
- Composite
- 38.1/100
- National rank
- #4276
- State rank
- #276 of 826 in TX
Livability — San Antonio
- Score
- 80/100
- State rank
- #31
- US rank
- #1616
Category grades
Schools grade is shown separately in the Schools card above.
Census & demographics
- Census place
- San Antonio, TX
Population outlook (Bexar County) Hauer SSP2
- Today (2025)
- 2,336,851 people
- By 2030
- 2,560,728 · +9.6%
- By 2040
- 3,020,569 · +29.3%
- By 2050
- 3,493,522 · +49.5%
- By 2075
- 4,668,459 · +99.8%
- By 2100
- 5,533,242 · +136.8%
Not yet ingested
- Political lean
- —
- Race & ethnicity
- —
- Common origin
- —
- Civics
- —
Market trends
- HPI YoY
- —
- Current HPI
- —
- Rent YoY
- —
- Metro
- —
- State GDP YoY
- ▲ 3.95%
- F500 in state
- 110
Industry mix (Fortune 500 HQ in TX)
| Industry | F500 HQs | Revenue |
|---|---|---|
| Energy | 16 | $1,198B |
|
||
| Technology | 5 | $198B |
|
||
| Engineering / Construction | 4 | $72B |
|
||
| Energy Services | 3 | $60B |
|
||
| Utilities | 3 | $41B |
|
||
| Healthcare | 2 | $330B |
|
||
Price history
+65.7% since first listed16 events — show timeline
- 2026-04-07 Price Changed $249,000 LERA
- 2026-03-05 Listed $249,999 LERA
- 2024-05-14 Listing Removed — LERA
- 2024-05-09 Price Changed $279,000 LERA
- 2024-04-28 Rental Removed $1,800 SABOR
- 2024-03-01 Listed for Rent $1,800 SABOR
- 2024-02-20 Price Changed $283,000 LERA
- 2024-02-20 Rental Removed $1,850 SABOR
- 2024-02-10 Listed for Rent $1,850 SABOR
- 2024-01-30 Listed $289,000 LERA
- 2014-03-20 Sold (MLS) — LERA
- 2014-02-05 Pending — LERA
- 2014-01-27 Listed $96,000 LERA
- 2006-09-13 Sold (MLS) — LERA
- 2006-09-06 Listing Removed — LERA
- 2006-09-05 Listed $150,254 LERA
Property tax history
+4.1%/yrLatest (2025): $5,669 · -2.0% YoY. Source: county tax records.
Cash-flow waterfall
monthlySold comps — $/sqft
last 12 mo · ≤1 miLoading sold comps…