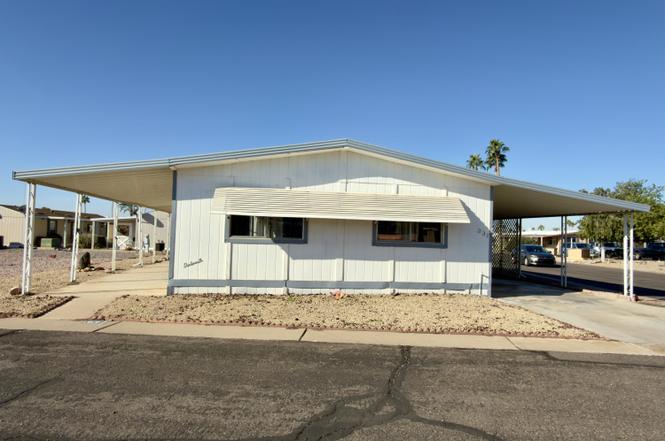
1855 W Southern Ave #331 · Apache Junction, AZ
Flood risk 1/10 · Minimal
- FEMA flood zone
- X (unshaded)
- Chance of flooding over 30 yrs
- 0.0%
- Est. flood insurance / yr
- $507 – $1,088
Fire risk 5/10 · Moderate
- Est. fire insurance / yr
- $610 – $1,132
Heat risk 8/10 · Major
- Hot days now (above 111°F)
- 5 days/yr
- Hot days in 30 yrs
- 14 days/yr
Wind risk 1/10 · Minimal
- Chance of severe wind over 30 yrs
- —
Air-quality risk 3/10 · Minor
- Unhealthy air days now
- 2 days/yr
- Unhealthy air days in 30 yrs
- 3 days/yr
Risk factors via First Street. Map © Google.
Why this score? — see what drove the B- grade
The composite is a weighted blend of 9 inputs, each scored 0–100. Each bar is that input's sub-score; the figure is the points it added to the 100-point composite (weight × sub-score).
- Cash flow +30.0/30.0
- 1% rule +10.0/10.0
- DSCR +10.0/10.0
- ARV discount +6.4/15.0
- Livability +3.3/5.0
- Condition / age +2.5/5.0
- Rent growth +1.6/5.0
- Schools +1.5/10.0
- Appreciation +0.0/10.0
$80,000
🖨 Deal sheet 📄 Offer letter ✓ Due diligence
Listing remarks
Updated manufactured home in desirable Sierra Del Saguaro, a quiet 55 plus pet free community in Apache Junction. This charming 2 bed 2 bath residence features tasteful remodeling completed in 2024, offering comfort and convenience. Located close to the community clubhouse and just minutes from freeway access, it provides easy connectivity while maintaining peaceful living. Inside, enjoy upgraded finishes, functional layout, and natural light throughout. Perfect for those seeking a low maintenance lifestyle in a well maintained neighborhood. Priced to sell, do not miss this opportunity to enjoy Arizona living with nearby amenities and gorgeous mountain views.
Key facts
- 4 parking spots
- Community pool
- Built 1983
Property features AI
Finance
- Other: Builder provided building area source; Corner lot location (directions available)
- HOA & community: Land lease: $575 monthly; Association covers sewer, grounds maintenance, street maintenance, and trash; Community amenities include pool, heated community spa, community laundry, and fitness center
Exterior
- Parking: 2 open parking spaces; 2 covered spaces; Community/common parking structure; 2 carport spaces
- Utilities: City water; No sewer; Electric: 220V in kitchen
- Home design: Manufactured/mobile housing; Leasehold ownership
- Construction: Wood frame construction; Painted exterior; Reflective coating, metal, and rolled/hot mop roof
- Exterior features: Storage; Gravel/stone front and back
Interior
- Kitchen: 220V outlet in kitchen; Laminate counters; Refrigerator; Dishwasher
- Bedrooms: 2 possible bedrooms
- Flooring: Laminate flooring
- Bathrooms: 2 full bathrooms
- Heating & cooling: Central air; Floor furnace; Wall furnace; Has heating and cooling
- Interior features: Eat-in kitchen; 3/4 bath in master bedroom; Laminate counters; Refrigerator; Dishwasher
- Laundry & utility: Inside laundry; Energy Star (see remarks)
Neighborhood map
What this means for you Summary
Snapshot
- This is a 2-bed/2.0-bath manufactured listed at $80k.
Deal economics
- At list price, monthly cash flow is $883 ($11k/yr) — positive.
- The deal already cash-flows at list — no discount required.
- Meets the 1% rule at list price ($2k rent vs $80k).
- Recommended offer: $70k (12.0% below list) — sets the bar for market timing.
- Cap rate 19.5% vs local median 3.5% in Apache Junction — top-decile yield for the area; either an underpriced asset or a hidden risk that comps aren't pricing in. Stress-test before assuming the spread holds.
Location & tenants
- Location reads 66/100 on livability (#70 in AZ) — a middle-class / working-renter tenant base. Strengths: cost of living A+, housing A+; Watch: crime D+, schools F, amenities F.
- Apache Junction Unified District (4443) (suburban): math 15% / reading 20% proficiency, ranked #195 of 249 in AZ (top 78%) — low school quality limits family demand, transient renter base, plan for 1-2y turnover.
- Market conditions: Rents falling (-3.5%/yr); 455 active listings in the ZIP; 13 comparable units currently listed for rent nearby; rentals leasing fast (median 13d on market — plan ~1-2 weeks tenant-placement turnaround); 9,504 units permitted in Pinal County in 2024 (776 in 5+ unit buildings).
- This rent runs 38% of the median local income ($58k/yr) — at the standard rent-burdened threshold; future hikes will face affordability resistance.
Forward outlook
- Local home prices are declining (-3.0%/yr); year-one equity from $553 of loan paydown is wiped out by about $2k of value loss. Plan a longer hold.
- At projected returns (-3.0% appreciation + 0.0% rent growth), your $22k cash investment doubles in ~3 years — after that, you're playing with house money.
Negotiation context
- It's been on market 205 days — a 12% lower offer ($70k) is reasonable based on typical stale-listing flexibility.
Risks & watch-outs
- Climate carrying-cost: moderate wildfire risk; extreme-heat days projected 5→14/yr by 2055 (HVAC capex compounding) — expect insurance premiums to compound above CPI over the hold.
Questions for the listing agent
- It's been on market 205 days. Have you received any prior offers? Is the seller open to a 12% concession, seller financing, or rate buy-down credit?
- Why hasn't it sold? Are there any deal-killer items the seller is aware of (foundation, flood, title, zoning, code violations)?
- Is there a deadline driving the sale (1031 exchange, divorce, estate, relocation)? That informs how much negotiation room exists.
- Schools are F-rated, which usually means shorter tenancies and higher turnover. Who's the typical renter profile here, and what's been the actual vacancy rate?
- Crime grade is D in this area — have there been break-ins, vandalism, or insurance claims at this property in the last 3 years? What carrier currently insures it and at what premium?
- What's the average days-on-market for RENTAL listings here right now (not sales)? A rising rental-DOM trend means longer vacancies and softer asking-rent achievability than the comps imply.
- What's the recent tenant-quality profile in this submarket — average credit score on applications, eviction rate, late-payment / NSF rate, and stable-employment percentage? A property-management company in the area should have these aggregated.
- How much new for-sale + rental construction is in the pipeline within 1–3 miles? Heavy new supply typically softens prices + rents 12–24 months out; constrained supply supports both.
Investment metrics
- 1% rule
- 2.27% ✓
- Cap rate
- 19.54%
- Cash-on-cash
- 47.32%
- DSCR
- 3.11
- GRM
- 3.7
CMA / ARV
- ARV (on-the-fly)
- $78,144
- Comps found
- 7
Show comp detail 7 sales within ~0.75 mi
| Address | Dist | Beds/Ba | Sqft | Sold | Price | $/sf | Match |
|---|---|---|---|---|---|---|---|
| 2175 W Southern Ave #200 | 0.30mi | 2/2.0 | 1,056 (0%) | 13mo | $57,900 | $55 | 75 |
| 1855 W Southern Ave | 0.10mi | 2/1.0 | 1,056 (0%) | 23mo | $80,000 | $76 | 72 |
| 3700 S Ironwood Dr Lot 124 | 0.70mi | 2/2.0 | 1,056 (0%) | 3mo | $34,990 | $33 | 65 |
| 2175 W Southern Ave #242 | 0.30mi | 2/2.0 | 960 (-9%) | 8mo | $46,900 | $49 | 64 |
| 2101 S Meridian Rd #41 | 0.54mi | 2/2.0 | 1,081 (+2%) | 23mo | $320,000 | $296 | 52 |
| 3400 S Ironwood Dr #181 | 0.54mi | 2/2.0 | 1,150 (+9%) | 11mo | $85,500 | $74 | 51 |
| 3700 S Ironwood Dr #126 | 0.69mi | 2/2.0 | 1,080 (+2%) | 21mo | $90,000 | $83 | 46 |
Match score weights: distance 35% · size 25% · config 20% · recency 20%. Top-matched comps best support the ARV.
Projected returns pro-forma
-3.0% appreciation · 0.0% rent growth · sell at horizon
- IRR
- 41.3%
- Equity multiple
- 2.70×
- Total profit
- $37,995
- Equity at exit
- $11,928
- IRR
- 46.1%
- Equity multiple
- 4.80×
- Total profit
- $85,050
- Equity at exit
- $6,917
Cash invested: $22,400 (down + closing). Projections, not guarantees.
Landlord ↔ Tenant lean methodology
- Overall (STATE)
- 87 Strongly Landlord-Friendly
- State Arizona
- 87 Strongly Landlord-Friendly · R+3
- County
- — inherits STATE
- City
- — inherits STATE
ZIP-level market 85120
- Home prices YoY
- -29.0%
- Rents YoY
- -3.5%
- Active inventory
- 455
- Price-to-rent
- 3.7×
Monthly cashflow live
- Estimated rent
- $1,818 high interval (Pro) →
- Mortgage (P&I)
- −$420
- Tax est. 1.5%
- −$100 /mo · $1,200/yr
- Insurance
- −$33
- HOA
- −$0
- Vacancy / Maint / Mgmt
- −$382
- Net cashflow
- $883
Break-even live
UW: 25.0% down · 7.5% · 30yr · 1.5% tax · 5.0% vac · 8.0% maint · 8.0% mgmt
Financing live
Cash to close
- Down payment
- $20,000
- Closing costs
- $2,400
- Reserves months
- —
- Total cash needed
- —
Loan-product check · same deal, 3 products live
Conventional
25% down · 7.5% · 30yr
- Down + closing
- —
- Monthly P&I
- —
- Monthly cashflow
- —
- DSCR
- —
- Eligible?
- —
Personal DTI + credit; lowest rate.
DSCR
20% down · 8.5% · 30yr
- Down + closing
- —
- Monthly P&I
- —
- Monthly cashflow
- —
- DSCR
- —
- Eligible?
- —
No personal income docs; deal must DSCR.
Hard money
10% down · 12.0% · 12mo
- Down + closing
- —
- Monthly P&I
- —
- Monthly cashflow
- —
- DSCR
- —
- Eligible?
- —
Short-term bridge; refi at stabilization.
Rent comps 13 comps
| Address | Beds | Baths | Sqft | Rent | $/sqft | DOM | Units | Dist |
|---|---|---|---|---|---|---|---|---|
| 2065 W 20th Ave Apache Junction, AZ | 3.0 | 2.0 | 1110 | $1,850 | $1.67 | 12d | 1 | 0.45mi |
| 2043 S Thunderbird Dr Apache Junction, AZ | 3.0 | 2.0 | 1348 | $1,925 | $1.43 | 24d | 1 | 0.53mi |
| 3454 S Warner Dr Apache Junction, AZ | 3.0 | 2.0 | 1300 | $2,500 | $1.92 | 24d | 1 | 0.76mi |
| 1446 S Palo Verde Dr Unit apache Apache Junction, AZ | 2.0 | 2.0 | 1210 | $1,700 | $1.40 | 24d | 1 | 0.76mi |
| 3000 W Southern Ave Apache Junction, AZ | 1.0–2.0 | 1.0–2.0 | 836 | $1,719 | $2.05 | 1d | 12 | 0.85mi |
| 2061 S Apache Dr Unit 1 Apache Junction, AZ | 2.0 | 1.0 | 800 | $1,095 | $1.37 | 5d | 1 | 1.07mi |
| 455 S Delaware Dr Apache Junction, AZ | 2.0 | 2.0 | 1060 | $2,048 | $1.93 | 20d | 2 | 1.39mi |
| 455 S Delaware Dr Unit 179 Apache Junction, AZ | 2.0 | 2.0 | 1060 | $2,395 | $2.26 | 24d | 1 | 1.39mi |
| 403 E Quail Ave Apache Junction, AZ | 2.0 | 1.0 | 800 | $1,350 | $1.69 | 4d | 1 | 1.43mi |
| 2101 S Yellow Wood #45 Mesa, AZ | 2.0 | 2.0 | 1081 | $1,649 | $1.53 | 43d | 1 | 1.44mi |
| 2101 S Yellow Wood #60 Mesa, AZ | 2.0 | 2.0 | 1371 | $2,600 | $1.90 | 1d | 1 | 1.44mi |
| 501 E Quail Ave Apache Junction, AZ | 2.0 | 1.0 | 720 | $1,150 | $1.60 | 3d | 1 | 1.48mi |
| 501 E Quail Ave Apache Junction, AZ | 2.0 | 1.0 | 720 | $1,150 | $1.60 | 5d | 1 | 1.48mi |
Listing history 15 events
-
2026-06-18days on market $80,000 Active 205 DOM
-
2026-06-17days on market $80,000 Active 204 DOM
-
2026-06-16days on market $80,000 Active 203 DOM
-
2026-06-15days on market $80,000 Active 202 DOM
-
2026-06-13days on market $80,000 Active 200 DOM
-
2026-06-09days on market $80,000 Active 196 DOM
-
2026-06-08days on market $80,000 Active 195 DOM
-
2026-06-07days on market $80,000 Active 194 DOM
-
2026-06-04days on market $80,000 Active 191 DOM
-
2026-06-03days on market $80,000 Active 190 DOM
-
2026-06-02days on market $80,000 Active 189 DOM
-
2026-06-01days on market $80,000 Active 188 DOM
-
2026-05-31days on market $80,000 Active 187 DOM
-
2025-12-02price $80,000
-
2025-11-25$90,000 Active
ⓘ Source: listings_history table (triggers on properties + properties_extension) + one-shot
backfill from property_details.listing_events for pre-trigger history.
Climate risk First Street
- Flood 1/10 Low FEMA zone X (unshaded) · 0% chance over 30 yrs
- Wildfire 5/10 Major
- Heat 8/10 Severe 5 d/yr ≥111°F today · 14 d/yr by 30 yrs out
- Wind 1/10 Low
- Air quality 3/10 Moderate 2 unhealthy d/yr today · 3 by 30 yrs out
Nearby sold comps map
Loading sold comps map…
Walkable amenities ~0.75 mi
Loading nearby amenities…
Taxation est. · year 1
- Rental income
- $21,815
- − Mortgage interest
- −$4,481
- − Property taxes
- −$1,200
- − Insurance
- −$400
- − Repairs & maintenance
- −$1,745
- − Management
- −$1,745
- − Depreciation
- −$2,327
- Taxable income
- $9,916
- Est. tax owed @ 24.0%
- −$2,380
- After-tax cash flow
- $8,220/yr
For passive investors: Depreciation is non-cash, so a rental often shows a tax loss while cash-flowing — sheltering income. Rental losses are passive: they offset passive income freely, and up to $25,000/yr can offset ordinary (W-2) income if you actively participate and your MAGI is under $100k (phasing out to $0 by $150k); unused losses carry forward. On sale, claimed depreciation is recaptured at up to 25%, and gains may owe capital-gains tax (a 1031 exchange can defer both). Figures are a year-1 estimate at your 24.0% rate — not tax advice; consult a CPA.
Schools (NCES district)
- District
- Apache Junction Unified District (4443)
- NCES district ID
- 0400790
- Math proficiency
- 15% ▼ -17.00%
- Reading proficiency
- 20% ▼ -13.00%
- Median HH income
- $44,930
- Composite
- 15.34/100
- National rank
- #9325
- State rank
- #195 of 249 in AZ
Livability — Apache Junction
- Score
- 66/100
- State rank
- #70
- US rank
- #11242
Category grades
Schools grade is shown separately in the Schools card above.
Census & demographics
- County
- Pinal County · 399,947 people
- City population
- 56,611
- Metro
- Phoenix-Mesa-Chandler, AZ
- Population (ZIP)
- 31,191
- Household income
- $57,786
- Rent vs Own
- Severe rent burden
- 686.0
Population outlook (Pinal County) Hauer SSP2
- Today (2025)
- 437,574 people
- By 2030
- 446,903 · +2.1%
- By 2040
- 452,589 · +3.4%
- By 2050
- 444,126 · +1.5%
- By 2075
- 430,300 · -1.7%
- By 2100
- 393,536 · -10.1%
Race, ethnicity, and origin ACS 2023
- Neighborhood character
- Predominantly White (77%)
- Race & ethnicity
- White 77% Hispanic / Latino 16% Two or more races 10% Asian 1%
- Hispanic origin (detail)
- Mexican 13%
- Common ancestry
- Romanian 3% Lithuanian 3% Portuguese 3%
- Foreign-born
- 7% · Canada
- Languages at home
- 89% English-only · Spanish 8% Tagalog/Filipino 1%
Political lean MEDSL · Pinal
- 2024 margin
- Strong R (+22.1) · D 38.5% · R 60.6%
- 2008→2024 swing
- -7.6pp toward R · 2008: -14.5pp · 2024: -22.1pp
- All cycles
- 2024: R+22.1 2020: R+17.3 2016: R+19.3 2012: R+17.1 2008: R+14.5
Not yet ingested
- Civics
- —
Market trends
- HPI YoY
- ▼ -128.31%
- Current HPI
- 313.4666
- Rent YoY
- ▼ -3.50%
- Metro
- Phoenix-Mesa-Chandler, AZ
- State GDP YoY
- ▲ 4.54%
- F500 in state
- 20
Industry mix (Fortune 500 HQ in AZ)
| Industry | F500 HQs | Revenue |
|---|---|---|
| Technology | 2 | $13B |
|
||
| Mining / Metals | 1 | $23B |
|
||
| Environmental Services | 1 | $16B |
|
||
| Metals / Steel | 1 | $14B |
|
||
| Technology Distribution | 1 | $9B |
|
||
| Homebuilding | 1 | $8B |
|
||
Price history
-11.1% since first listed2 events — show timeline
- 2025-12-02 Price Changed $80,000 ARMLS
- 2025-11-25 Listed $90,000 ARMLS
Cash-flow waterfall
monthlySold comps — $/sqft
last 12 mo · ≤1 miLoading sold comps…