 Multi-family
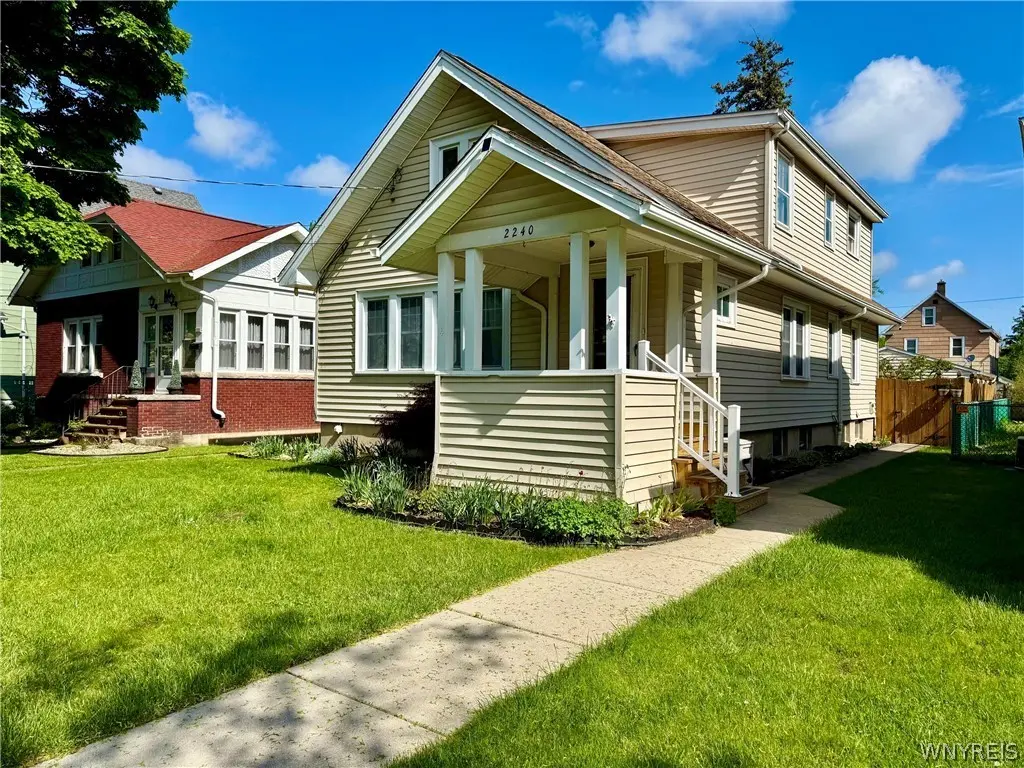
2240 Michigan Ave · Niagara Falls, NY
Flood risk 1/10 · Minimal
- FEMA flood zone
- X (unshaded)
- Chance of flooding over 30 yrs
- 0.0%
- Est. flood insurance / yr
- $473 – $860
Fire risk 2/10 · Minimal
- Est. fire insurance / yr
- $691 – $1,283
Heat risk 2/10 · Minimal
- Hot days now (above 94°F)
- 7 days/yr
- Hot days in 30 yrs
- 15 days/yr
Wind risk 1/10 · Minimal
- Chance of severe wind over 30 yrs
- —
Air-quality risk 3/10 · Minor
- Unhealthy air days now
- 2 days/yr
- Unhealthy air days in 30 yrs
- 3 days/yr
Risk factors via First Street. Map © Google.
Why this score? — see what drove the C+ grade
The composite is a weighted blend of 9 inputs, each scored 0–100. Each bar is that input's sub-score; the figure is the points it added to the 100-point composite (weight × sub-score).
- Cash flow +30.0/30.0
- 1% rule +10.0/10.0
- DSCR +10.0/10.0
- Livability +3.0/5.0
- Rent growth +2.5/5.0
- Schools +2.5/10.0
- Condition / age +2.5/5.0
- ARV discount +0.0/15.0
- Appreciation +0.0/10.0
$145,900
🖨 Deal sheet 📄 Offer letter ✓ Due diligence
Multi-family units
County records classify this as Multi-Family (2-4 Unit). Listing-text estimate: 1 unit. estimate disagrees with records
Listing remarks
A rare opportunity to own a home built by the current owners’ grandparents and lovingly maintained by the same family for over a century, this well-kept two-unit property offers exceptional flexibility. The first-floor unit welcomes you with a foyer and coat closet that open into a spacious living room and formal dining room filled with natural light from numerous windows. The kitchen features recessed lighting, a pantry, dishwasher, microwave, abundant cabinetry, generous counter space, and a custom built-in desk. Hardwood floors lie beneath the carpeting in the living room, dining room, and bedrooms. Additional highlights include a full bathroom with a newer vanity and toilet, two g
Key facts
- Two unit property
- Formal dining room
- Natural light
Tags
Property features AI
Finance
- Other: Two-unit property with separate electric meters for each unit and a single gas meter
- Financial info: Operating expense details available in remarks; Owner and rent responsibilities noted in remarks
Exterior
- Parking: 2-car garage; Additional parking available
- Utilities: High-speed internet available; Public water connected; Sewer connected; Circuit breaker electrical system
- Home design: Single-story building; Existing construction
- Construction: Aluminum and vinyl siding; Asphalt roof; Poured foundation; Built previously (existing)
- Exterior features: Covered porch; Enclosed porch; Open porch; Deck
Interior
- Flooring: Carpet; Hardwood; Laminate; Tile
- Bathrooms: 2 full bathrooms
- Heating & cooling: Forced-air gas heating; Central air conditioning
- Interior features: Partial basement with sump pump; Carpet, hardwood, laminate and tile flooring (varies by room)
- Laundry & utility: Gas water heater
Neighborhood map
What this means for you Summary
Snapshot
- This is a 5-bed/2.0-bath multifamily listed at $146k.
Deal economics
- At list price, monthly cash flow is $1k ($12k/yr) — positive.
- The deal already cash-flows at list — no discount required.
- Meets the 1% rule at list price ($3k rent vs $146k).
- Cap rate 14.8% vs local median 7.7% in Niagara Falls — top-decile yield for the area; either an underpriced asset or a hidden risk that comps aren't pricing in. Stress-test before assuming the spread holds.
Location & tenants
- Location reads 60/100 on livability (#956 in NY) — a middle-class / working-renter tenant base. Strengths: cost of living A+, housing A+; Watch: schools F, crime F, amenities F.
- Niagara Falls City School District (urban): math 26% / reading 34% proficiency, ranked #578 of 590 in NY (top 98%) — families likely to look elsewhere, expect single-tenant / working-renter base with shorter leases; 66% free/reduced lunch — lower-income household profile, screen leases tightly.
- Market conditions: 142 active listings in the ZIP; 4 comparable units currently listed for rent nearby; rentals at typical pace (median 17d on market — plan ~3-4 weeks tenant-placement turnaround); 167 units permitted in Niagara County in 2024 (0 in 5+ unit buildings).
- At $2,636/mo this rent would consume 62% of the median local household income ($51k/yr) (locally 1095% of renters already pay >50% of income on rent) — very limited rent-growth headroom before tenants either downsize or default.
Forward outlook
- Local home prices are declining (-3.0%/yr); year-one equity from $1k of loan paydown is wiped out by about $4k of value loss. Plan a longer hold.
- Niagara County population projected at -19% by 2050 — secular population decline; favor cash flow + early exit over multi-decade hold.
- At projected returns (-3.0% appreciation + 3.0% rent growth), your $41k cash investment doubles in ~4 years — after that, you're playing with house money.
Negotiation context
- Only 4 days on market — expect competitive offers; lowballing is unlikely to land.
Risks & watch-outs
- Watch-outs: built in 1925 — expect roof / HVAC / electrical / plumbing capex.
Questions for the listing agent
- Built in 1925 — when were the roof, HVAC, electrical panel, plumbing, and water heater last replaced?
- Is there a deadline driving the sale (1031 exchange, divorce, estate, relocation)? That informs how much negotiation room exists.
- Schools are F-rated, which usually means shorter tenancies and higher turnover. Who's the typical renter profile here, and what's been the actual vacancy rate?
- Crime grade is F in this area — have there been break-ins, vandalism, or insurance claims at this property in the last 3 years? What carrier currently insures it and at what premium?
- What's the average days-on-market for RENTAL listings here right now (not sales)? A rising rental-DOM trend means longer vacancies and softer asking-rent achievability than the comps imply.
- What's the recent tenant-quality profile in this submarket — average credit score on applications, eviction rate, late-payment / NSF rate, and stable-employment percentage? A property-management company in the area should have these aggregated.
- How much new apartment / multifamily construction is in the pipeline within 1–3 miles? Heavy new supply (>2% of stock underway) typically softens rents 12–24 months out; light construction supports rent growth.
Investment metrics
- 1% rule
- 1.81% ✓
- Cap rate
- 14.81%
- Cash-on-cash
- 30.41%
- DSCR
- 2.35
- GRM
- 4.6
CMA / ARV
- ARV (on-the-fly)
- $108,300
- Comps found
- 12
Show comp detail 12 sales within ~0.75 mi
| Address | Dist | Beds/Ba | Sqft | Sold | Price | $/sf | Match |
|---|---|---|---|---|---|---|---|
| 2208 Weston Ave | 0.09mi | 4/2.0 (-1) | 2,016 (+6%) | 1mo | $55,000 | $27 | 80 |
| 2459 La Salle Ave | 0.38mi | 4/2.0 (-1) | 1,920 (+1%) | 2mo | $160,000 | $83 | 74 |
| 2463 South Ave | 0.20mi | 4/2.0 (-1) | 2,016 (+6%) | 3mo | $137,500 | $68 | 73 |
| 1867 Michigan Ave | 0.14mi | 4/2.0 (-1) | 2,100 (+10%) | 2mo | $87,000 | $41 | 70 |
| 1623 Linwood Ave | 0.37mi | 4/2.0 (-1) | 1,994 (+5%) | 3mo | $100,000 | $50 | 67 |
| 2449 Grand Ave | 0.62mi | 5/2.0 | 1,918 (+1%) | 4mo | $135,000 | $70 | 66 |
| 2443 Pierce Ave | 0.26mi | 4/2.0 (-1) | 2,112 (+11%) | 4mo | $120,000 | $57 | 61 |
| 2401 Whitney Ave | 0.29mi | 6/2.0 (+1) | 2,168 (+14%) | 2mo | $40,000 | $18 | 56 |
| 1535 Pierce Ave | 0.46mi | 4/2.0 (-1) | 1,724 (-9%) | 2mo | $35,000 | $20 | 56 |
| 2455 La Salle Ave | 0.38mi | 4/2.0 (-1) | 2,152 (+13%) | 3mo | $112,000 | $52 | 53 |
| 1333 North Ave | 0.62mi | 4/2.0 (-1) | 1,728 (-9%) | 2mo | $100,000 | $58 | 49 |
| 2460 Grand Ave | 0.60mi | 6/2.0 (+1) | 2,162 (+14%) | 0mo | $175,000 | $81 | 44 |
Match score weights: distance 35% · size 25% · config 20% · recency 20%. Top-matched comps best support the ARV.
Projected returns pro-forma
-3.0% appreciation · 3.0% rent growth · sell at horizon
- IRR
- 25.1%
- Equity multiple
- 2.04×
- Total profit
- $42,357
- Equity at exit
- $21,754
- IRR
- 32.9%
- Equity multiple
- 3.99×
- Total profit
- $122,045
- Equity at exit
- $12,615
Cash invested: $40,852 (down + closing). Projections, not guarantees.
Landlord ↔ Tenant lean methodology
- Overall (STATE)
- 15 Strongly Tenant-Friendly
- State New York
- 15 Strongly Tenant-Friendly · D+10
- County
- — inherits STATE
- City
- — inherits STATE
ZIP-level market 14305
- Home prices YoY
- -10.9%
- Active inventory
- 142
- Price-to-rent
- 9.2×
Monthly cashflow live
- Estimated rent
- $2,636 high interval (Pro) →
- Mortgage (P&I)
- −$765
- Tax from tax record
- −$221 /mo · $2,655/yr
- Insurance
- −$61
- HOA
- −$0
- Vacancy / Maint / Mgmt
- −$554
- Net cashflow
- $1,035
Break-even live
2-unit breakdown (identical units grouped — click to expand)
| Units | Beds | Baths | Est. rent |
|---|---|---|---|
| 2× units | 2 | 1 | $2,636 |
| #1 | 2 | 1 | $1,318 |
| #2 | 2 | 1 | $1,318 |
| Total (2 units) | $2,636 | ||
UW: 25.0% down · 7.5% · 30yr · 1.5% tax · 5.0% vac · 8.0% maint · 8.0% mgmt
Financing live
Cash to close
- Down payment
- $36,475
- Closing costs
- $4,377
- Reserves months
- —
- Total cash needed
- —
Loan-product check · same deal, 3 products live
Conventional
25% down · 7.5% · 30yr
- Down + closing
- —
- Monthly P&I
- —
- Monthly cashflow
- —
- DSCR
- —
- Eligible?
- —
Personal DTI + credit; lowest rate.
DSCR
20% down · 8.5% · 30yr
- Down + closing
- —
- Monthly P&I
- —
- Monthly cashflow
- —
- DSCR
- —
- Eligible?
- —
No personal income docs; deal must DSCR.
Hard money
10% down · 12.0% · 12mo
- Down + closing
- —
- Monthly P&I
- —
- Monthly cashflow
- —
- DSCR
- —
- Eligible?
- —
Short-term bridge; refi at stabilization.
Rent comps 4 comps
| Address | Beds | Baths | Sqft | Rent | $/sqft | DOM | Units | Dist |
|---|---|---|---|---|---|---|---|---|
| 2020 Forest Ave Niagara Falls, NY | 4.0 | 2.0 | 1600 | $1,500 | $0.94 | 16d | 1 | 0.48mi |
| 3025 Macklem Ave Niagara Falls, NY | 4.0 | 1.5 | 1750 | $2,200 | $1.26 | 43d | 1 | 1.30mi |
| 3225 Belden Pl Niagara Falls, NY | 5.0 | 1.5 | 1344 | $1,750 | $1.30 | 1d | 1 | 1.31mi |
| 2420 Mackenna Ave Unit 1 Niagara Falls, NY | 4.0 | 1.0 | 1300 | $1,390 | $1.07 | 1d | 1 | 1.37mi |
Listing history 1 events
-
2026-05-23$145,900 Active
ⓘ Source: listings_history table (triggers on properties + properties_extension) + one-shot
backfill from property_details.listing_events for pre-trigger history.
Tax reassessment forecast NY · Partial reset (capped growth)
- Current annual tax
- $2,655 · $221/mo
- Projected year-2 tax
- $2,655 · $221/mo
- Expected delta
- $0/yr ($0/mo · 0.0%)
ⓘ Screening estimate from a state-policy table — verify with the county assessor before closing.
Climate risk First Street
- Flood 1/10 Low FEMA zone X (unshaded) · 0% chance over 30 yrs
- Wildfire 2/10 Low
- Heat 2/10 Low 7 d/yr ≥94°F today · 15 d/yr by 30 yrs out
- Wind 1/10 Low
- Air quality 3/10 Moderate 2 unhealthy d/yr today · 3 by 30 yrs out
Nearby sold comps map
Loading sold comps map…
Walkable amenities ~0.75 mi
Loading nearby amenities…
Taxation est. · year 1
- Rental income
- $31,632
- − Mortgage interest
- −$8,173
- − Property taxes
- −$2,655
- − Insurance
- −$730
- − Repairs & maintenance
- −$2,531
- − Management
- −$2,531
- − Depreciation
- −$4,244
- Taxable income
- $10,769
- Est. tax owed @ 24.0%
- −$2,585
- After-tax cash flow
- $9,838/yr
For passive investors: Depreciation is non-cash, so a rental often shows a tax loss while cash-flowing — sheltering income. Rental losses are passive: they offset passive income freely, and up to $25,000/yr can offset ordinary (W-2) income if you actively participate and your MAGI is under $100k (phasing out to $0 by $150k); unused losses carry forward. On sale, claimed depreciation is recaptured at up to 25%, and gains may owe capital-gains tax (a 1031 exchange can defer both). Figures are a year-1 estimate at your 24.0% rate — not tax advice; consult a CPA.
Schools (NCES district)
- District
- Niagara Falls City School District
- NCES district ID
- 3620820
- Math proficiency
- 26% ▼ -10.00%
- Reading proficiency
- 34% ▲ 3.00%
- Median HH income
- $32,488
- Composite
- 24.5/100
- National rank
- #7655
- State rank
- #578 of 590 in NY
Livability — Niagara Falls
- Score
- 60/100
- State rank
- #956
- US rank
- #18749
Category grades
Schools grade is shown separately in the Schools card above.
Census & demographics
- Census place
- Niagara Falls, NY
- County
- Niagara County · 157,377 people
- City population
- 62,983
- Metro
- Buffalo-Cheektowaga, NY
- Population (ZIP)
- 16,696
- Household income
- $51,004
- Rent vs Own
- Severe rent burden
- 1095.0
Population outlook (Niagara County) Hauer SSP2
- Today (2025)
- 204,149 people
- By 2030
- 197,900 · -3.1%
- By 2040
- 182,239 · -10.7%
- By 2050
- 165,198 · -19.1%
- By 2075
- 129,416 · -36.6%
- By 2100
- 96,222 · -52.9%
Race, ethnicity, and origin ACS 2023
- Neighborhood character
- Diverse neighborhood (Simpson 0.63)
- Race & ethnicity
- White 55% Black 24% Two or more races 13% Hispanic / Latino 8% Asian 1% Native American 1%
- Hispanic origin (detail)
- Puerto Rican 4%
- Common ancestry
- Romanian 6% Slovak 2% Lithuanian 2%
- Foreign-born
- 6% · Canada, Jamaica
- Languages at home
- 93% English-only · Spanish 4% Other Indo-European 1%
Political lean MEDSL · Niagara
- 2024 margin
- R (+14.9) · D 42.5% · R 57.5%
- 2008→2024 swing
- -15.9pp toward R · 2008: 1.0pp · 2024: -14.9pp
- All cycles
- 2024: R+14.9 2020: R+9.7 2016: R+19.0 2012: D+0.6 2008: D+1.0
Not yet ingested
- Civics
- —
Market trends
- HPI YoY
- ▼ -43.08%
- Current HPI
- 350.8741
- Rent YoY
- —
- Metro
- Buffalo-Cheektowaga, NY
- State GDP YoY
- ▲ 2.60%
- F500 in state
- 92
Industry mix (Fortune 500 HQ in NY)
| Industry | F500 HQs | Revenue |
|---|---|---|
| Financial Services | 10 | $950B |
|
||
| Consumer Goods | 9 | $162B |
|
||
| Insurance | 4 | $225B |
|
||
| Telecommunications | 2 | $144B |
|
||
| Pharmaceuticals | 2 | $112B |
|
||
| Media / Entertainment | 2 | $69B |
|
||
Price history
1 event — show timeline
- 2026-05-23 Listed $145,900 WNYREIS
Property tax history
+13.3%/yrLatest (2025): $2,655 · +12.6% YoY. Source: county tax records.
Cash-flow waterfall
monthlySold comps — $/sqft
last 12 mo · ≤1 miLoading sold comps…