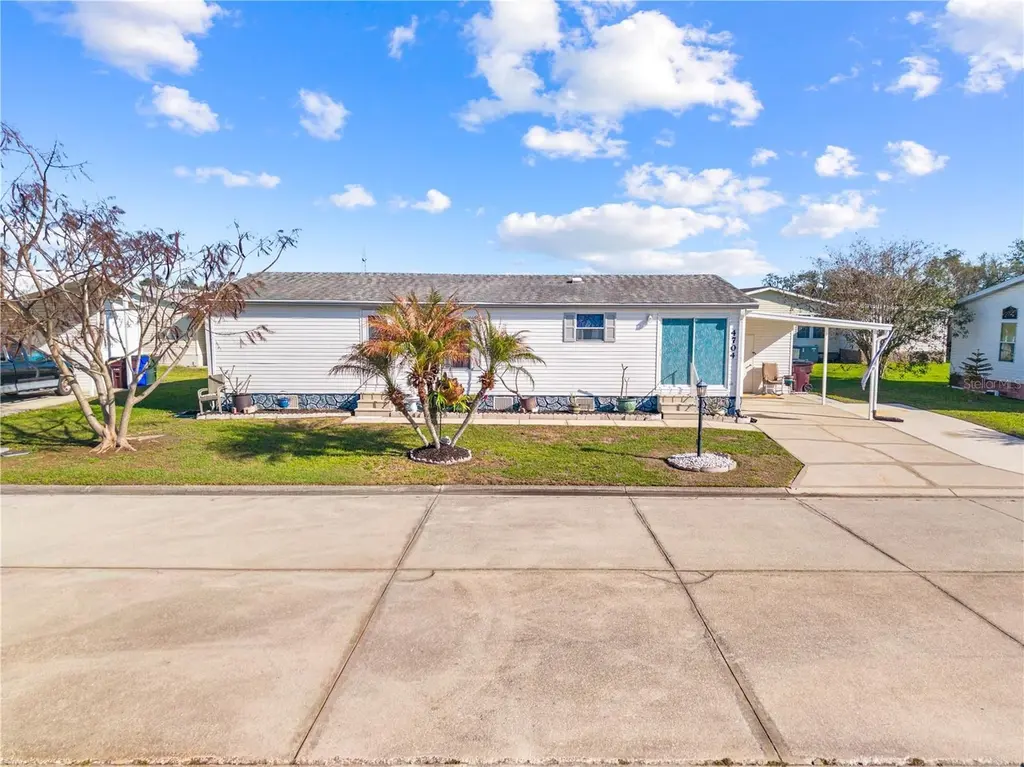
4704 Lanca Ln · St. Cloud, FL
Flood risk 1/10 · Minimal
- FEMA flood zone
- X (unshaded)
- Chance of flooding over 30 yrs
- 0.0%
- Est. flood insurance / yr
- $507 – $1,088
Fire risk 5/10 · Moderate
- Est. fire insurance / yr
- $947 – $1,759
Heat risk 9/10 · Severe
- Hot days now (above 108°F)
- 7 days/yr
- Hot days in 30 yrs
- 23 days/yr
Wind risk 9/10 · Severe
- Chance of severe wind over 30 yrs
- 99.0%
Air-quality risk 1/10 · Minimal
- Unhealthy air days now
- 0 days/yr
- Unhealthy air days in 30 yrs
- 0 days/yr
Risk factors via First Street. Map © Google.
Why this score? — see what drove the C grade
The composite is a weighted blend of 9 inputs, each scored 0–100. Each bar is that input's sub-score; the figure is the points it added to the 100-point composite (weight × sub-score).
- Cash flow +21.1/30.0
- ARV discount +11.5/15.0
- DSCR +6.7/10.0
- 1% rule +5.8/10.0
- Schools +3.6/10.0
- Rent growth +3.1/5.0
- Livability +2.5/5.0
- Condition / age +2.5/5.0
- Appreciation +0.0/10.0
$200,000
🖨 Deal sheet 📄 Offer letter ✓ Due diligence
Listing remarks MLS
Teka Village is a beautiful gated 55+ Community.
Key facts
- Modern upgrades
- New hvac
- New water heater
Tags
Property features AI
Finance
- Other: Partially furnished; Living area approximately 1,269 (public records); Building area total approximately 1,617; Lot about 0.12 acre (paved road); Direction faces south
- Financial info: Total monthly fees $120; total annual fees $1,440
- HOA & community: HOA required; $120 monthly; Association amenities include clubhouse, fitness center, gated community, pool, pickleball courts, shuffleboard; Buyer approval required; Community mailbox; Deed restrictions; Senior community; Pets allowed (up to 60 lbs)
Exterior
- Parking: Covered parking; Driveway; Golf cart parking; 1-car carport
- Utilities: Public water; Public sewer; Cable available; Broadband/High-speed internet available; Electricity available and connected; Water available
- Home design: Manufactured home (double wide); One story; South-facing
- Construction: Vinyl siding; Shingle roof; Crawlspace with pillar/post/pier foundation; Built as double wide
- Exterior features: Rain gutters; Exterior storage; Paved lot; Patio/porch: none
Interior
- Kitchen: Dishwasher; Range; Range hood; Refrigerator; Electric water heater
- Bedrooms: 2 bedrooms
- Flooring: Carpet; Vinyl
- Bathrooms: 2 full bathrooms
- Heating & cooling: Central heating (electric); Central air conditioning
- Interior features: Ceiling fans; Split bedroom layout; Thermostat; Walk-in closets; Blinds
- Laundry & utility: Washer hookup; Electric dryer hookup
Neighborhood map
What this means for you Summary
Snapshot
- This is a 2-bed/2.0-bath manufactured listed at $200k.
Deal economics
- At list price, monthly cash flow is $287 ($3k/yr) — positive.
- The deal already cash-flows at list — no discount required.
- Meets the 1% rule at list price ($2k rent vs $200k).
- Recommended offer: $182k (9.0% below list) — sets the bar for market timing.
- Cap rate 8.0% vs local median 4.0% in St. Cloud — top-decile yield for the area; either an underpriced asset or a hidden risk that comps aren't pricing in. Stress-test before assuming the spread holds.
Location & tenants
- Location reads: area grade C — affects rentability + tenant quality, not the cash-flow math above.
- Osceola (suburban): math 39% / reading 45% proficiency, ranked #60 of 73 in FL (top 82%) — families likely to look elsewhere, expect single-tenant / working-renter base with shorter leases; 60% free/reduced lunch — lower-income household profile, screen leases tightly.
- Market conditions: Rents rising (+2.3%/yr); 868 active listings in the ZIP; 38 comparable units currently listed for rent nearby; rentals at typical pace (median 24d on market — plan ~3-4 weeks tenant-placement turnaround); solid renter incomes; 8,813 units permitted in Osceola County in 2024 (3,072 in 5+ unit buildings).
Forward outlook
- Local home prices are declining (-3.0%/yr); year-one equity from $1k of loan paydown is wiped out by about $6k of value loss. Plan a longer hold.
- Osceola County population projected at +73% by 2050 — long-run rental-demand tailwind backs the buy-and-hold thesis.
Negotiation context
- It's been on market 94 days — a 9% lower offer ($182k) is reasonable based on typical stale-listing flexibility.
- 2 sale attempts since 11y ago; this cycle's ask has dropped $20k (9%) from the opening price — seller is motivated, your offer sets the floor, not the list.
- Current owner paid $80k; list at $200k implies a 148% gain — meaningful room to come down on a strong offer.
Risks & watch-outs
- Climate carrying-cost: severe wind risk, 99% chance of damaging wind over 30y; moderate wildfire risk; extreme-heat days projected 7→23/yr by 2055 (HVAC capex compounding) — expect insurance premiums to compound above CPI over the hold.
Questions for the listing agent
- It's been on market 94 days. Have you received any prior offers? Is the seller open to a 9% concession, seller financing, or rate buy-down credit?
- What does the HOA fee cover, when was the last increase, and are there any pending special assessments or reserve-fund shortfalls?
- Why hasn't it sold? Are there any deal-killer items the seller is aware of (foundation, flood, title, zoning, code violations)?
- Is there a deadline driving the sale (1031 exchange, divorce, estate, relocation)? That informs how much negotiation room exists.
- What's the average days-on-market for RENTAL listings here right now (not sales)? A rising rental-DOM trend means longer vacancies and softer asking-rent achievability than the comps imply.
- What's the recent tenant-quality profile in this submarket — average credit score on applications, eviction rate, late-payment / NSF rate, and stable-employment percentage? A property-management company in the area should have these aggregated.
- How much new for-sale + rental construction is in the pipeline within 1–3 miles? Heavy new supply typically softens prices + rents 12–24 months out; constrained supply supports both.
Investment metrics
- 1% rule
- 1.08% ✓
- Cap rate
- 8.02%
- Cash-on-cash
- 6.16%
- DSCR
- 1.27
- GRM
- 7.7
CMA / ARV
- ARV (on-the-fly)
- $219,537
- Comps found
- 6
Show comp detail 6 sales within ~0.75 mi
| Address | Dist | Beds/Ba | Sqft | Sold | Price | $/sf | Match |
|---|---|---|---|---|---|---|---|
| 4703 Lanca Ln | 0.02mi | 2/2.0 | 1,296 (+2%) | 8mo | $205,000 | $158 | 88 |
| 4707 Lanca Ln | 0.02mi | 2/2.0 | 1,200 (-5%) | 13mo | $238,000 | $198 | 79 |
| 2520 Longpine Ln | 0.18mi | 2/2.0 | 1,296 (+2%) | 13mo | $230,000 | $177 | 77 |
| 4418 Brave Ln | 0.19mi | 2/2.0 | 1,175 (-7%) | 3mo | $177,000 | $151 | 77 |
| 2490 Longpine Ln | 0.06mi | 3/2.0 (+1) | 1,186 (-6%) | 6mo | $205,000 | $173 | 76 |
| 2538 Longpine Ln | 0.28mi | 2/2.0 | 1,248 (-2%) | 11mo | $192,000 | $154 | 75 |
Match score weights: distance 35% · size 25% · config 20% · recency 20%. Top-matched comps best support the ARV.
Projected returns pro-forma
-3.0% appreciation · 2.3% rent growth · sell at horizon
- IRR
- -7.6%
- Equity multiple
- 0.72×
- Total profit
- $-15,568
- Equity at exit
- $29,821
- IRR
- 1.1%
- Equity multiple
- 1.07×
- Total profit
- $4,115
- Equity at exit
- $17,292
Cash invested: $56,000 (down + closing). Projections, not guarantees.
Landlord ↔ Tenant lean methodology
- Overall (STATE)
- 87 Strongly Landlord-Friendly
- State Florida
- 87 Strongly Landlord-Friendly · R+3
- County
- — inherits STATE
- City
- — inherits STATE
ZIP-level market 34772
- Home prices YoY
- -32.5%
- Rents YoY
- 2.3%
- Active inventory
- 868
- Price-to-rent
- 7.7×
Monthly cashflow live
- Estimated rent
- $2,160 high interval (Pro) →
- Mortgage (P&I)
- −$1,049
- Tax from tax record
- −$167 /mo · $2,008/yr
- Insurance
- −$83
- HOA
- −$120
- Vacancy / Maint / Mgmt
- −$454
- Net cashflow
- $287
Break-even live
UW: 25.0% down · 7.5% · 30yr · 1.5% tax · 5.0% vac · 8.0% maint · 8.0% mgmt
Financing live
Cash to close
- Down payment
- $50,000
- Closing costs
- $6,000
- Reserves months
- —
- Total cash needed
- —
Loan-product check · same deal, 3 products live
Conventional
25% down · 7.5% · 30yr
- Down + closing
- —
- Monthly P&I
- —
- Monthly cashflow
- —
- DSCR
- —
- Eligible?
- —
Personal DTI + credit; lowest rate.
DSCR
20% down · 8.5% · 30yr
- Down + closing
- —
- Monthly P&I
- —
- Monthly cashflow
- —
- DSCR
- —
- Eligible?
- —
No personal income docs; deal must DSCR.
Hard money
10% down · 12.0% · 12mo
- Down + closing
- —
- Monthly P&I
- —
- Monthly cashflow
- —
- DSCR
- —
- Eligible?
- —
Short-term bridge; refi at stabilization.
Rent comps 38 comps
| Address | Beds | Baths | Sqft | Rent | $/sqft | DOM | Units | Dist |
|---|---|---|---|---|---|---|---|---|
| 2478 Pine Chase Cir Saint Cloud, FL | 3.0 | 2.0 | 1383 | $2,310 | $1.67 | 4d | 1 | 0.48mi |
| 3221 Villa Way Cir Saint Cloud, FL | 3.0 | 2.0 | 1370 | $1,650 | $1.20 | 24d | 1 | 0.59mi |
| 2850 Wadeview Loop Saint Cloud, FL | 3.0 | 2.5 | 1875 | $2,300 | $1.23 | 24d | 1 | 0.69mi |
| 2438 Pine Chase Cir Saint Cloud, FL | 3.0 | 2.0 | 1482 | $2,199 | $1.48 | 3d | 1 | 0.71mi |
| 4501 Burrowing Owl Loop Saint Cloud, FL | 3.0 | 2.5 | 1560 | $2,200 | $1.41 | 17d | 1 | 0.74mi |
| 4536 Burrowing Owl Loop Saint Cloud, FL | 3.0 | 2.5 | 1808 | $2,650 | $1.47 | 24d | 1 | 0.78mi |
| 4329 Eagle Trail Bnd Saint Cloud, FL | 3.0 | 2.5 | 1560 | $2,100 | $1.35 | 22d | 1 | 0.82mi |
| 4469 Eagle Trail Bnd Saint Cloud, FL | 3.0 | 2.5 | 1566 | $2,200 | $1.40 | 24d | 1 | 0.88mi |
| 4358 Restful Fallow Cv Saint Cloud, FL | 3.0 | 2.5 | 1560 | $2,300 | $1.47 | 24d | 1 | 0.91mi |
| 4346 Restful Fallow Cv Saint Cloud, FL | 3.0 | 2.5 | 1560 | $2,300 | $1.47 | 24d | 1 | 0.91mi |
| 4367 Ranch House Rd Saint Cloud, FL | 3.0 | 2.5 | 1560 | $2,050 | $1.31 | 24d | 1 | 0.92mi |
| 4348 Ranch House Rd Saint Cloud, FL | 3.0 | 2.5 | 1808 | $2,200 | $1.22 | 24d | 1 | 0.96mi |
| 3085 Soldier City Way Unit 202 St Cloud, FL | 3.0 | 2.0 | 1125 | $1,800 | $1.60 | 24d | 1 | 0.97mi |
| 3085 Soldier City Way Unit 203 St Cloud, FL | 3.0 | 2.0 | 1045 | $1,850 | $1.77 | 24d | 1 | 0.97mi |
| 3075 Soldier City Way Unit 103 St Cloud, FL | 3.0 | 2.0 | 1045 | $1,850 | $1.77 | 24d | 1 | 0.97mi |
| 3075 Soldier City Way Unit 102 St Cloud, FL | 3.0 | 2.0 | 1045 | $1,800 | $1.72 | 24d | 1 | 0.97mi |
| 3075 Soldier City Way Unit 202 St Cloud, FL | 3.0 | 2.0 | 1125 | $1,800 | $1.60 | 20d | 1 | 0.97mi |
| 3075 Soldier City Way Unit 101 St Cloud, FL | 3.0 | 2.0 | 1045 | $1,850 | $1.77 | 4d | 1 | 0.97mi |
| 3065 Soldier City Way Unit 202 St Cloud, FL | 3.0 | 2.0 | 1125 | $1,800 | $1.60 | 20d | 1 | 0.97mi |
| 3100 Soldier City Way St Cloud, FL | 3.0 | 2.0 | 1085 | $1,875 | $1.73 | 3d | 6 | 0.98mi |
| 4240 Settlers Ct Saint Cloud, FL | 3.0 | 2.0 | 1435 | $2,300 | $1.60 | 24d | 1 | 1.03mi |
| 4371 Vibernum Ave Unit A St Cloud, FL | 3.0 | 2.0 | 1825 | $2,400 | $1.32 | 24d | 1 | 1.06mi |
| 4377 Vibernum Ave Unit A St Cloud, FL | 3.0 | 2.0 | 1825 | $2,400 | $1.32 | 24d | 1 | 1.06mi |
| 3010 Camber Dr Saint Cloud, FL | 1.0–2.0 | 1.0–2.0 | 1007 | $1,971 | $1.96 | 2d | 18 | 1.11mi |
| 5134 Arrowfeather Ct Unit A St Cloud, FL | 3.0 | 2.0 | 1825 | $2,350 | $1.29 | 16d | 1 | 1.14mi |
| 5134 Arrowfeather Ct Saint Cloud, FL | 3.0 | 2.0 | 1825 | $2,350 | $1.29 | 17d | 1 | 1.14mi |
| 4651 Sidesaddle Trl Saint Cloud, FL | 3.0 | 2.0 | 1695 | $2,195 | $1.29 | 17d | 1 | 1.14mi |
| 5000 Revolutionary Way Saint Cloud, FL | 3.0 | 2.5 | 1373 | $2,100 | $1.53 | 24d | 1 | 1.17mi |
| 5080 Revolutionary Way Saint Cloud, FL | 3.0 | 2.5 | 1365 | $2,350 | $1.72 | 24d | 1 | 1.18mi |
| 5100 Clay Whaley Rd Unit 5100 St Cloud, FL | 3.0 | 2.5 | 1823 | $2,250 | $1.23 | 24d | 1 | 1.21mi |
| 4848 Shady Pines Dr Saint Cloud, FL | 3.0 | 2.0 | 1610 | $2,400 | $1.49 | 15d | 1 | 1.24mi |
| 5172 Clay Whaley Rd Saint Cloud, FL | 3.0 | 2.5 | 1823 | $2,240 | $1.23 | 13d | 1 | 1.29mi |
| 5174 Clay Whaley Rd Saint Cloud, FL | 3.0 | 2.5 | 1664 | $2,290 | $1.38 | 24d | 1 | 1.29mi |
| 5176 Clay Whaley Rd Saint Cloud, FL | 3.0 | 2.5 | 1664 | $2,350 | $1.41 | 22d | 1 | 1.30mi |
| 5191 Loyalty Dr Saint Cloud, FL | 3.0 | 2.5 | 1782 | $2,250 | $1.26 | 24d | 1 | 1.30mi |
| 4215 Red Bird Ave Saint Cloud, FL | 3.0 | 2.0 | 1587 | $2,395 | $1.51 | 3d | 1 | 1.31mi |
| 3528 Bay Ct Saint Cloud, FL | 2.0 | 1.0 | 884 | $1,495 | $1.69 | 24d | 1 | 1.34mi |
| 3875 Knotty Pine St Saint Cloud, FL | 3.0 | 2.5 | 1608 | $2,150 | $1.34 | 24d | 1 | 1.35mi |
HOA detail
- Monthly dues
- $120 · $1,440/yr
- Likely covers
- security
Listing history 23 events
-
2026-06-18days on market $200,000 Active 94 DOM
-
2026-06-17days on market $200,000 Active 93 DOM
-
2026-06-16days on market $200,000 Active 92 DOM
-
2026-06-15days on market $200,000 Active 91 DOM
-
2026-06-13days on market $200,000 Active 89 DOM
-
2026-06-13days on market $200,000 Active 88 DOM
-
2026-06-09days on market $200,000 Active 85 DOM
-
2026-06-08days on market $200,000 Active 84 DOM
-
2026-06-07days on market $200,000 Active 83 DOM
-
2026-06-04days on market $200,000 Active 80 DOM
-
2026-06-03days on market $200,000 Active 79 DOM
-
2026-06-02days on market $200,000 Active 78 DOM
-
2026-06-02days on market $200,000 Active 77 DOM
-
2026-05-31days on market $200,000 Active 76 DOM
-
2026-04-27price $210,000
-
2026-04-06price $214,900
-
2026-03-16$220,000 Active
-
2015-09-14historical 48-char remark
Show marketing remark (48 chars)
Teka Village is a beautiful gated 55+ Community.
-
2015-09-08soldstatus $80,500
-
2015-09-04soldstatus $80,500 Sold 48-char remark
Show marketing remark (48 chars)
Teka Village is a beautiful gated 55+ Community.
-
2015-08-24status Pending 48-char remark
Show marketing remark (48 chars)
Teka Village is a beautiful gated 55+ Community.
-
2015-08-18$86,000 Active 48-char remark
Show marketing remark (48 chars)
Teka Village is a beautiful gated 55+ Community.
-
2000-09-08soldstatus $26,000
ⓘ Source: listings_history table (triggers on properties + properties_extension) + one-shot
backfill from property_details.listing_events for pre-trigger history.
Tax reassessment forecast FL · Resets to sale price
- Current annual tax
- $2,008 · $167/mo
- Projected year-2 tax
- $2,008 · $167/mo
- Expected delta
- $0/yr ($0/mo · 0.0%)
ⓘ Screening estimate from a state-policy table — verify with the county assessor before closing.
Climate risk First Street
- Flood 1/10 Low FEMA zone X (unshaded) · 0% chance over 30 yrs
- Wildfire 5/10 Major
- Heat 9/10 Extreme 7 d/yr ≥108°F today · 23 d/yr by 30 yrs out
- Wind 9/10 Extreme 99% chance of damaging wind over 30 yrs
- Air quality 1/10 Low 0 unhealthy d/yr today · 0 by 30 yrs out
Nearby sold comps map
Loading sold comps map…
Walkable amenities ~0.75 mi
Loading nearby amenities…
Taxation est. · year 1
- Rental income
- $25,925
- − Mortgage interest
- −$11,203
- − Property taxes
- −$2,008
- − Insurance
- −$1,000
- − Repairs & maintenance
- −$2,074
- − Management
- −$2,074
- − HOA
- −$1,440
- − Depreciation
- −$5,818
- Taxable income
- $308
- Est. tax owed @ 24.0%
- −$74
- After-tax cash flow
- $3,373/yr
For passive investors: Depreciation is non-cash, so a rental often shows a tax loss while cash-flowing — sheltering income. Rental losses are passive: they offset passive income freely, and up to $25,000/yr can offset ordinary (W-2) income if you actively participate and your MAGI is under $100k (phasing out to $0 by $150k); unused losses carry forward. On sale, claimed depreciation is recaptured at up to 25%, and gains may owe capital-gains tax (a 1031 exchange can defer both). Figures are a year-1 estimate at your 24.0% rate — not tax advice; consult a CPA.
Schools (NCES district)
- District
- Osceola
- NCES district ID
- 1201470
- Math proficiency
- 39% ▼ -9.00%
- Reading proficiency
- 45% ▼ -4.00%
- Median HH income
- $45,528
- Composite
- 35.7/100
- National rank
- #4865
- State rank
- #60 of 73 in FL
Livability — St. Cloud
No livability data for this city. (Only ~50 U.S. cities are tracked.)
Census & demographics
- Census place
- St. Cloud, FL
- County
- Osceola County · 410,217 people
- City population
- 29,247
- Metro
- Orlando-Kissimmee-Sanford, FL
- Population (ZIP)
- 35,390
- Household income
- $97,868
- Rent vs Own
- Severe rent burden
- 443.0
Population outlook (Osceola County) Hauer SSP2
- Today (2025)
- 447,624 people
- By 2030
- 511,823 · +14.3%
- By 2040
- 642,986 · +43.6%
- By 2050
- 774,552 · +73.0%
- By 2075
- 1,078,144 · +140.9%
- By 2100
- 1,269,660 · +183.6%
Race, ethnicity, and origin ACS 2023
- Neighborhood character
- Diverse neighborhood (Simpson 0.62)
- Race & ethnicity
- White 44% Hispanic / Latino 44% Two or more races 19% Black 4% Asian 2%
- Hispanic origin (detail)
- Puerto Rican 20% Cuban 2% Dominican 6%
- Common ancestry
- Lithuanian 2% Slovak 1% Iranian 1%
- Foreign-born
- 18% · Canada, Jamaica
- Languages at home
- 60% English-only · Spanish 36% German/W. Germanic 1% Other Indo-European 1%
Political lean MEDSL · Osceola
- 2024 margin
- Toss-up / Even · D 48.7% · R 50.2% · Other 1.1%
- 2008→2024 swing
- -21.2pp toward R · 2008: 19.7pp · 2024: -1.4pp
- All cycles
- 2024: R+1.4 2020: D+13.8 2016: D+25.0 2012: D+24.5 2008: D+19.7
Not yet ingested
- Civics
- —
Market trends
- HPI YoY
- ▼ -132.55%
- Current HPI
- 274.6517
- Rent YoY
- ▲ 2.30%
- Metro
- Orlando-Kissimmee-Sanford, FL
- State GDP YoY
- ▲ 3.28%
- F500 in state
- 36
Industry mix (Fortune 500 HQ in FL)
| Industry | F500 HQs | Revenue |
|---|---|---|
| Industrial Technology | 2 | $29B |
|
||
| Insurance | 2 | $17B |
|
||
| Retail | 1 | $60B |
|
||
| Technology Distribution | 1 | $58B |
|
||
| Homebuilding | 1 | $35B |
|
||
| Technology Manufacturing | 1 | $35B |
|
||
Price history
+707.7% since first listed9 events — show timeline
- 2026-04-27 Price Changed $210,000 Stellar MLS as Distributed by MLS Grid
- 2026-04-06 Price Changed $214,900 Stellar MLS as Distributed by MLS Grid
- 2026-03-16 Listed $220,000 Stellar MLS as Distributed by MLS Grid
- 2015-09-14 Listing Removed — Stellar MLS as Distributed by MLS Grid
- 2015-09-08 Sold (Public Records) $80,500 Public Records
- 2015-09-04 Sold (MLS) $80,500 Stellar MLS as Distributed by MLS Grid
- 2015-08-24 Pending — Stellar MLS as Distributed by MLS Grid
- 2015-08-18 Listed $86,000 Stellar MLS as Distributed by MLS Grid
- 2000-09-08 Sold (Public Records) $26,000 Public Records
Property tax history
+4.7%/yrLatest (2025): $2,008 · +28.3% YoY. Source: county tax records.
Cash-flow waterfall
monthlySold comps — $/sqft
last 12 mo · ≤1 miLoading sold comps…