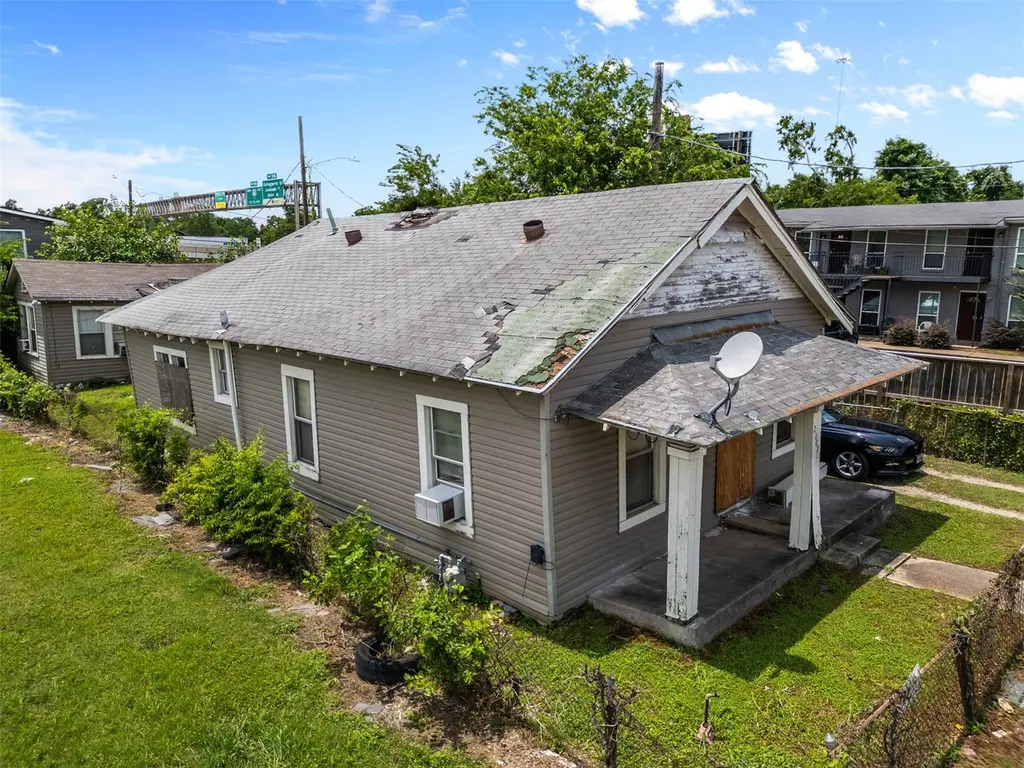
2007 Massie St · Houston, TX
Flood risk 6/10 · Moderate
- FEMA flood zone
- X (shaded)
- Chance of flooding over 30 yrs
- 0.73%
- Est. flood insurance / yr
- $507 – $1,088
Fire risk 1/10 · Minimal
- Est. fire insurance / yr
- $1,222 – $2,270
Heat risk 9/10 · Severe
- Hot days now (above 109°F)
- 7 days/yr
- Hot days in 30 yrs
- 24 days/yr
Wind risk 9/10 · Severe
- Chance of severe wind over 30 yrs
- 99.0%
Air-quality risk 3/10 · Minor
- Unhealthy air days now
- 2 days/yr
- Unhealthy air days in 30 yrs
- 3 days/yr
Risk factors via First Street. Map © Google.
Why this score? — see what drove the B+ grade
The composite is a weighted blend of 9 inputs, each scored 0–100. Each bar is that input's sub-score; the figure is the points it added to the 100-point composite (weight × sub-score).
- Cash flow +27.5/30.0
- ARV discount +15.0/15.0
- DSCR +9.6/10.0
- 1% rule +7.3/10.0
- Appreciation +6.9/10.0
- Livability +3.7/5.0
- Rent growth +3.3/5.0
- Schools +2.7/10.0
- Condition / age +2.5/5.0
$125,000
🖨 Deal sheet 📄 Offer letter ✓ Due diligence
Listing remarks MLS
Investor Special in Prime Location! Discover the potential of this property just minutes from downtown Houston, the East River project, and major highways (I-10 & 59). The lot features TWO structures — the main home and a detached bonus unit (both needs TLC).
Key facts
- Two structures
- Detached bonus unit
- 4,338 sq ft lot
Tags
Neighborhood map
What this means for you Summary
Snapshot
- This is a 2-bed/1.0-bath single-family listed at $125k.
Deal economics
- At list price, monthly cash flow is $369 ($4k/yr) — positive.
- The deal already cash-flows at list — no discount required.
- Meets the 1% rule at list price ($2k rent vs $125k).
- Recommended offer: $110k (12.0% below list) — sets the bar for market timing.
- Cap rate 9.8% vs local median 3.2% in Houston — top-decile yield for the area; either an underpriced asset or a hidden risk that comps aren't pricing in. Stress-test before assuming the spread holds.
Location & tenants
- Location reads 74/100 on livability (#184 in TX, #4,771 nationally) — a middle-class / working-renter tenant base. Strengths: amenities A+, cost of living A+, housing A+; Watch: schools D, crime F.
- Houston ISD (urban): math 27% / reading 35% proficiency, ranked #593 of 826 in TX (top 72%) — families likely to look elsewhere, expect single-tenant / working-renter base with shorter leases; 71% free/reduced lunch — lower-income household profile, screen leases tightly.
- Market conditions: Rents rising (+3.1%/yr); 445 active listings in the ZIP; 40 comparable units currently listed for rent nearby; rentals at typical pace (median 18d on market — plan ~3-4 weeks tenant-placement turnaround); lower-income renter base — watch delinquency; 29,883 units permitted in Harris County in 2024 (8,621 in 5+ unit buildings).
- At $1,535/mo this rent would consume 47% of the median local household income ($39k/yr) (locally 1531% of renters already pay >50% of income on rent) — very limited rent-growth headroom before tenants either downsize or default.
Forward outlook
- In year one you build about $6k of equity ($864 loan paydown + $5k appreciation (3.9% local appreciation)).
- Harris County population projected at +47% by 2050 — long-run rental-demand tailwind backs the buy-and-hold thesis.
- At projected returns (3.9% appreciation + 3.1% rent growth), your $35k cash investment doubles in ~4 years — after that, you're playing with house money.
- By year 6, paydown + projected appreciation supports a ~$30k cash-out refi (75% LTV) — recoverable capital for the next deal without selling this one.
Negotiation context
- It's been on market 387 days — a 12% lower offer ($110k) is reasonable based on typical stale-listing flexibility.
- 2 sale attempts; this cycle's ask has dropped $75k (37%) from the opening price — seller is motivated, your offer sets the floor, not the list.
Risks & watch-outs
- Watch-outs: built in 1930 — expect roof / HVAC / electrical / plumbing capex.
- Climate carrying-cost: major flood risk; severe wind risk, 99% chance of damaging wind over 30y; extreme-heat days projected 7→24/yr by 2055 (HVAC capex compounding) — expect insurance premiums to compound above CPI over the hold.
Questions for the listing agent
- It's been on market 387 days. Have you received any prior offers? Is the seller open to a 12% concession, seller financing, or rate buy-down credit?
- Built in 1930 — when were the roof, HVAC, electrical panel, plumbing, and water heater last replaced?
- Why hasn't it sold? Are there any deal-killer items the seller is aware of (foundation, flood, title, zoning, code violations)?
- Is there a deadline driving the sale (1031 exchange, divorce, estate, relocation)? That informs how much negotiation room exists.
- Schools are D-rated, which usually means shorter tenancies and higher turnover. Who's the typical renter profile here, and what's been the actual vacancy rate?
- Crime grade is F in this area — have there been break-ins, vandalism, or insurance claims at this property in the last 3 years? What carrier currently insures it and at what premium?
- What's the average days-on-market for RENTAL listings here right now (not sales)? A rising rental-DOM trend means longer vacancies and softer asking-rent achievability than the comps imply.
- What's the recent tenant-quality profile in this submarket — average credit score on applications, eviction rate, late-payment / NSF rate, and stable-employment percentage? A property-management company in the area should have these aggregated.
- How much new for-sale + rental construction is in the pipeline within 1–3 miles? Heavy new supply typically softens prices + rents 12–24 months out; constrained supply supports both.
Investment metrics
- 1% rule
- 1.23% ✓
- Cap rate
- 9.83%
- Cash-on-cash
- 12.64%
- DSCR
- 1.56
- GRM
- 6.8
CMA / ARV
- ARV (median comp)
- $187,579
- List price
- $125,000
- Delta
- -33.36%
- Verdict
- UNDERPRICED
- Comps
- 20 within 1.0 mi
Show comp detail 12 sales within ~0.75 mi
| Address | Dist | Beds/Ba | Sqft | Sold | Price | $/sf | Match |
|---|---|---|---|---|---|---|---|
| 3053 Noble St | 0.09mi | 2/1.0 | 1,200 (+4%) | 1mo | $64,497 | $54 | 88 |
| 1912 Semmes St | 0.55mi | 2/1.0 | 1,104 (-4%) | 2mo | $65,000 | $59 | 66 |
| 2111 Davis St | 0.27mi | 3/2.0 (+1) | 1,243 (+8%) | 6mo | $175,000 | $141 | 60 |
| 2114 Des Chaumes St | 0.10mi | 2/2.5 | 1,000 (-13%) | 10mo | $235,000 | $235 | 59 |
| 2006 Stevens St | 0.29mi | 3/2.0 (+1) | 1,243 (+8%) | 6mo | $225,000 | $181 | 59 |
| 2405 Pannell St | 0.45mi | 3/1.5 (+1) | 1,230 (+7%) | 3mo | $99,500 | $81 | 58 |
| 4214 Quitman St | 0.70mi | 3/2.0 (+1) | 1,128 (-2%) | 0mo | $174,999 | $155 | 55 |
| 2710 Stevens St | 0.65mi | 3/2.0 (+1) | 1,168 (+1%) | 7mo | $203,900 | $175 | 53 |
| 2212 Semmes St | 0.56mi | 3/1.0 (+1) | 1,320 (+15%) | 1mo | $181,000 | $137 | 43 |
| 1618 Capron St | 0.43mi | 3/1.0 (+1) | 990 (-14%) | 12mo | $120,000 | $121 | 42 |
| 3706 Lucille St | 0.72mi | 3/2.0 (+1) | 1,231 (+7%) | 7mo | $249,900 | $203 | 40 |
| 4314 Rawley St | 0.70mi | 3/1.0 (+1) | 1,048 (-9%) | 9mo | $195,900 | $187 | 40 |
Match score weights: distance 35% · size 25% · config 20% · recency 20%. Top-matched comps best support the ARV.
Projected returns pro-forma
3.89% appreciation · 3.08% rent growth · sell at horizon
- IRR
- 21.4%
- Equity multiple
- 2.28×
- Total profit
- $44,674
- Equity at exit
- $62,595
- IRR
- 21.8%
- Equity multiple
- 4.41×
- Total profit
- $119,198
- Equity at exit
- $101,760
Cash invested: $35,000 (down + closing). Projections, not guarantees.
Landlord ↔ Tenant lean methodology
- Overall (STATE)
- 87 Strongly Landlord-Friendly
- State Texas
- 87 Strongly Landlord-Friendly · R+5
- County
- — inherits STATE
- City
- — inherits STATE
ZIP-level market 77026
- Home prices YoY
- 1.5%
- Rents YoY
- 3.1%
- Active inventory
- 445
- Price-to-rent
- 6.8×
Monthly cashflow live
- Estimated rent
- $1,535 high interval (Pro) →
- Mortgage (P&I)
- −$656
- Tax from tax record
- −$137 /mo · $1,640/yr
- Insurance
- −$52
- HOA
- −$0
- Vacancy / Maint / Mgmt
- −$322
- Net cashflow
- $369
Break-even live
UW: 25.0% down · 7.5% · 30yr · 1.5% tax · 5.0% vac · 8.0% maint · 8.0% mgmt
Financing live
Cash to close
- Down payment
- $31,250
- Closing costs
- $3,750
- Reserves months
- —
- Total cash needed
- —
Loan-product check · same deal, 3 products live
Conventional
25% down · 7.5% · 30yr
- Down + closing
- —
- Monthly P&I
- —
- Monthly cashflow
- —
- DSCR
- —
- Eligible?
- —
Personal DTI + credit; lowest rate.
DSCR
20% down · 8.5% · 30yr
- Down + closing
- —
- Monthly P&I
- —
- Monthly cashflow
- —
- DSCR
- —
- Eligible?
- —
No personal income docs; deal must DSCR.
Hard money
10% down · 12.0% · 12mo
- Down + closing
- —
- Monthly P&I
- —
- Monthly cashflow
- —
- DSCR
- —
- Eligible?
- —
Short-term bridge; refi at stabilization.
Rent comps 40 comps
| Address | Beds | Baths | Sqft | Rent | $/sqft | DOM | Units | Dist |
|---|---|---|---|---|---|---|---|---|
| 3031 Sumpter St Unit 50 Houston, TX | 2.0 | 1.0 | 732 | $1,200 | $1.64 | 24d | 1 | 0.02mi |
| 3502 Campbell St Houston, TX | 2.0 | 1.0 | 725 | $800 | $1.10 | 44d | 1 | 0.31mi |
| 1513 Cage St Houston, TX | 3.0 | 2.0 | 1467 | $1,550 | $1.06 | 44d | 1 | 0.42mi |
| 1714 Mary St Houston, TX | 2.0 | 2.0 | 1100 | $2,400 | $2.18 | 44d | 1 | 0.49mi |
| 3730 Lyons Ave Unit 216 Houston, TX | 3.0 | 2.0 | 1107 | $1,300 | $1.17 | 44d | 1 | 0.51mi |
| 1556 Leona St Houston, TX | 1.0 | 1.0 | 905 | $1,505 | $1.66 | 44d | 1 | 0.87mi |
| 1550 Leona St Houston, TX | 1.0–2.0 | 1.0–2.0 | 835 | $1,905 | $2.28 | 2d | 19 | 0.93mi |
| 2209 Gano St Unit 4 Houston, TX | 2.0 | 1.0 | 700 | $1,250 | $1.79 | 44d | 1 | 0.97mi |
| 2209 Gano St Unit 3 Houston, TX | 2.0 | 1.0 | 700 | $1,200 | $1.71 | 44d | 1 | 0.97mi |
| 1550 Leona St Unit 1587 Houston, TX | 2.0 | 2.0 | 1131 | $1,942 | $1.72 | 44d | 1 | 0.99mi |
| 1250 Leona St Houston, TX | 2.0 | 1.0–2.0 | 885 | $1,990 | $2.25 | 2d | 16 | 1.07mi |
| 913 McKee St Houston, TX | 1.0 | 1.0 | 714 | $1,003 | $1.40 | 44d | 1 | 1.10mi |
| 650 McKee St Unit 683 Houston, TX | 3.0 | 2.0 | 1136 | $2,125 | $1.87 | 44d | 1 | 1.21mi |
| 650 McKee St Unit 424 Houston, TX | 2.0 | 2.0 | 966 | $1,690 | $1.75 | 5d | 1 | 1.21mi |
| 650 McKee St Unit 687 Houston, TX | 2.0 | 2.0 | 966 | $1,715 | $1.78 | 44d | 1 | 1.21mi |
| 650 McKee St Unit 3174 Houston, TX | 3.0 | 2.0 | 1136 | $2,114 | $1.86 | 11d | 1 | 1.21mi |
| 650 McKee St Apt 425 Houston, TX | 2.0 | 2.0 | 966 | $1,725 | $1.79 | 5d | 1 | 1.21mi |
| 650 McKee St Unit 3112 Houston, TX | 3.0 | 2.0 | 1136 | $2,082 | $1.83 | 3d | 1 | 1.21mi |
| 650 McKee St Apt 422 Houston, TX | 2.0 | 2.0 | 966 | $1,690 | $1.75 | 8d | 1 | 1.21mi |
| 650 McKee St Unit 2174 Houston, TX | 2.0 | 2.0 | 966 | $1,714 | $1.77 | 11d | 1 | 1.21mi |
| 650 McKee St Unit 2148 Houston, TX | 2.0 | 2.0 | 966 | $1,682 | $1.74 | 3d | 1 | 1.21mi |
| 91 Jensen Dr Houston, TX | 3.0 | 1.0–2.5 | 970 | $2,713 | $2.80 | 1d | 69 | 1.21mi |
| 91 Jensen Dr Houston, TX | 2.0 | 1.0–2.0 | 872 | $3,094 | $3.55 | 21d | 16 | 1.21mi |
| 1514 Everett St Houston, TX | 2.0 | 1.0 | 970 | $1,840 | $1.90 | 20d | 1 | 1.24mi |
| 711 William St Houston, TX | 1.0 | 1.0 | 960 | $1,700 | $1.77 | 18d | 1 | 1.25mi |
| 711 William St Houston, TX | 1.0 | 1.0 | 1340 | $2,250 | $1.68 | 44d | 1 | 1.25mi |
| 800 Middle St Houston, TX | 1.0–4.0 | 1.0–2.0 | 1003 | $1,320 | $1.32 | 5d | 1 | 1.35mi |
| 1625 N Main St Houston, TX | 3.0 | 1.0–3.0 | 994 | $2,007 | $2.02 | 3d | 42 | 1.38mi |
| 1725 N Main St Houston, TX | 2.0 | 2.0 | 988 | $2,263 | $2.29 | 44d | 1 | 1.38mi |
| 3805 Wipprecht St Houston, TX | 2.0 | 1.0 | 768 | $1,100 | $1.43 | 19d | 1 | 1.40mi |
| 2115 Runnels St Houston, TX | 2.0 | 2.0 | 1053 | $1,775 | $1.69 | 44d | 1 | 1.40mi |
| 2115 Runnels St Unit 2130 Houston, TX | 1.0 | 1.0 | 705 | $1,513 | $2.15 | 11d | 1 | 1.40mi |
| 2115 Runnels St Unit 2130 Houston, TX | 1.0 | 1.0 | 705 | $1,509 | $2.14 | 14d | 1 | 1.40mi |
| 2115 Runnels St Unit 1174 Houston, TX | 1.0 | 1.0 | 705 | $1,463 | $2.08 | 13d | 1 | 1.40mi |
| 2115 Runnels St Unit 2152 Houston, TX | 2.0 | 2.0 | 959 | $1,864 | $1.94 | 44d | 1 | 1.40mi |
| 2115 Runnels St Unit 321 Houston, TX | 1.0 | 1.0 | 705 | $1,474 | $2.09 | 8d | 1 | 1.40mi |
| 2115 Runnels St Unit 2174 Houston, TX | 2.0 | 2.0 | 959 | $1,863 | $1.94 | 11d | 1 | 1.40mi |
| 2115 Runnels St Unit 1162 Houston, TX | 1.0 | 1.0 | 705 | $1,474 | $2.09 | 5d | 1 | 1.40mi |
| 2115 Runnels St Unit 1187 Houston, TX | 1.0 | 1.0 | 705 | $1,471 | $2.09 | 3d | 1 | 1.40mi |
| 2115 Runnels St Unit 2162 Houston, TX | 2.0 | 2.0 | 959 | $1,839 | $1.92 | 5d | 1 | 1.40mi |
Listing history 18 events
-
2026-06-18days on market $125,000 Active 387 DOM
-
2026-06-17days on market $125,000 Active 386 DOM
-
2026-06-16days on market $125,000 Active 385 DOM
-
2026-06-15days on market $125,000 Active 384 DOM
-
2026-06-13days on market $125,000 Active 382 DOM
-
2026-06-10days on market $125,000 Active 378 DOM
-
2026-06-08days on market $125,000 Active 377 DOM
-
2026-06-07days on market $125,000 Active 376 DOM
-
2026-06-04days on market $125,000 Active 373 DOM
-
2026-05-31days on market $125,000 Active 370 DOM
-
2025-11-08price $125,000 269-char remark
Show marketing remark (269 chars)
Investor Special in Prime Location! Discover the potential of this property just minutes from downtown Houston, the East River project, and major highways (I-10 & 59). The lot features TWO structures — the main home and a detached bonus unit (both needs TLC).
-
2025-07-23status Active 269-char remark
Show marketing remark (269 chars)
Investor Special in Prime Location! Discover the potential of this property just minutes from downtown Houston, the East River project, and major highways (I-10 & 59). The lot features TWO structures — the main home and a detached bonus unit (both needs TLC).
-
2025-07-23price $150,000 269-char remark
Show marketing remark (269 chars)
Investor Special in Prime Location! Discover the potential of this property just minutes from downtown Houston, the East River project, and major highways (I-10 & 59). The lot features TWO structures — the main home and a detached bonus unit (both needs TLC).
-
2025-07-22historical 269-char remark
Show marketing remark (269 chars)
Investor Special in Prime Location! Discover the potential of this property just minutes from downtown Houston, the East River project, and major highways (I-10 & 59). The lot features TWO structures — the main home and a detached bonus unit (both needs TLC).
-
2025-06-11price $175,000 269-char remark
Show marketing remark (269 chars)
Investor Special in Prime Location! Discover the potential of this property just minutes from downtown Houston, the East River project, and major highways (I-10 & 59). The lot features TWO structures — the main home and a detached bonus unit (both needs TLC).
-
2025-05-26$199,999 Active 269-char remark
Show marketing remark (269 chars)
Investor Special in Prime Location! Discover the potential of this property just minutes from downtown Houston, the East River project, and major highways (I-10 & 59). The lot features TWO structures — the main home and a detached bonus unit (both needs TLC).
-
2024-08-26soldstatus
-
1998-12-21soldstatus
ⓘ Source: listings_history table (triggers on properties + properties_extension) + one-shot
backfill from property_details.listing_events for pre-trigger history.
Tax reassessment forecast TX · Resets to sale price
- Current annual tax
- $1,640 · $137/mo
- Projected year-2 tax
- $2,288 · $191/mo
- Expected delta
- +$647/yr (+$54/mo · 39.5%)
ⓘ Screening estimate from a state-policy table — verify with the county assessor before closing.
Climate risk First Street
- Flood 6/10 Major FEMA zone X (shaded) · 73% chance over 30 yrs
- Wildfire 1/10 Low
- Heat 9/10 Extreme 7 d/yr ≥109°F today · 24 d/yr by 30 yrs out
- Wind 9/10 Extreme 99% chance of damaging wind over 30 yrs
- Air quality 3/10 Moderate 2 unhealthy d/yr today · 3 by 30 yrs out
Nearby sold comps map
Loading sold comps map…
Walkable amenities ~0.75 mi
Loading nearby amenities…
Taxation est. · year 1
- Rental income
- $18,423
- − Mortgage interest
- −$7,002
- − Property taxes
- −$1,640
- − Insurance
- −$625
- − Repairs & maintenance
- −$1,474
- − Management
- −$1,474
- − Depreciation
- −$3,636
- Taxable income
- $2,572
- Est. tax owed @ 24.0%
- −$617
- After-tax cash flow
- $3,806/yr
For passive investors: Depreciation is non-cash, so a rental often shows a tax loss while cash-flowing — sheltering income. Rental losses are passive: they offset passive income freely, and up to $25,000/yr can offset ordinary (W-2) income if you actively participate and your MAGI is under $100k (phasing out to $0 by $150k); unused losses carry forward. On sale, claimed depreciation is recaptured at up to 25%, and gains may owe capital-gains tax (a 1031 exchange can defer both). Figures are a year-1 estimate at your 24.0% rate — not tax advice; consult a CPA.
Schools (NCES district)
- District
- Houston ISD
- NCES district ID
- 4823640
- Math proficiency
- 27% ▼ -18.00%
- Reading proficiency
- 35% ▼ -6.00%
- Median HH income
- $46,054
- Composite
- 26.63/100
- National rank
- #7173
- State rank
- #593 of 826 in TX
Livability — Houston
- Score
- 74/100
- State rank
- #184
- US rank
- #4771
Category grades
Schools grade is shown separately in the Schools card above.
Census & demographics
- Census place
- Houston, TX
- County
- Harris County · 4,702,590 people
- City population
- 3,226,434
- Metro
- Houston-The Woodlands-Sugar Land, TX
- Population (ZIP)
- 21,981
- Household income
- $39,211
- Rent vs Own
- Severe rent burden
- 1531.0
Population outlook (Harris County) Hauer SSP2
- Today (2025)
- 5,571,493 people
- By 2030
- 6,089,821 · +9.3%
- By 2040
- 7,142,806 · +28.2%
- By 2050
- 8,185,864 · +46.9%
- By 2075
- 10,574,329 · +89.8%
- By 2100
- 12,109,958 · +117.4%
Race, ethnicity, and origin ACS 2023
- Neighborhood character
- Diverse neighborhood (Simpson 0.56)
- Race & ethnicity
- Black 49% Hispanic / Latino 44% Two or more races 18% White 5% Native American 1%
- Hispanic origin (detail)
- Mexican 34%
- Common ancestry
- Lithuanian 1%
- Foreign-born
- 15% · Canada
- Languages at home
- 61% English-only · Spanish 39%
Political lean MEDSL · Harris
- 2024 margin
- Lean D (+5.5) · D 52.0% · R 46.4% · Other 1.6%
- 2008→2024 swing
- +3.9pp toward D · 2008: 1.6pp · 2024: 5.5pp
- All cycles
- 2024: D+5.5 2020: D+13.3 2016: D+12.4 2012: D+0.1 2008: D+1.6
Not yet ingested
- Civics
- —
Market trends
- HPI YoY
- ▲ 3.89%
- Current HPI
- 267.5995
- Rent YoY
- ▲ 3.08%
- Metro
- Houston-The Woodlands-Sugar Land, TX
- State GDP YoY
- ▲ 3.95%
- F500 in state
- 110
Industry mix (Fortune 500 HQ in TX)
| Industry | F500 HQs | Revenue |
|---|---|---|
| Energy | 16 | $1,198B |
|
||
| Technology | 5 | $198B |
|
||
| Engineering / Construction | 4 | $72B |
|
||
| Energy Services | 3 | $60B |
|
||
| Utilities | 3 | $41B |
|
||
| Healthcare | 2 | $330B |
|
||
Price history
-37.5% since first listed8 events — show timeline
- 2025-11-08 Price Changed $125,000 HARMLS
- 2025-07-23 Relisted — HARMLS
- 2025-07-23 Price Changed $150,000 HARMLS
- 2025-07-22 Listing Removed — HARMLS
- 2025-06-11 Price Changed $175,000 HARMLS
- 2025-05-26 Listed $199,999 HARMLS
- 2024-08-26 Sold (Public Records) — Public Records
- 1998-12-21 Sold (Public Records) — Public Records
Property tax history
+4.6%/yrLatest (2025): $1,640 · +11.7% YoY. Source: county tax records.
Cash-flow waterfall
monthlySold comps — $/sqft
last 12 mo · ≤1 miLoading sold comps…