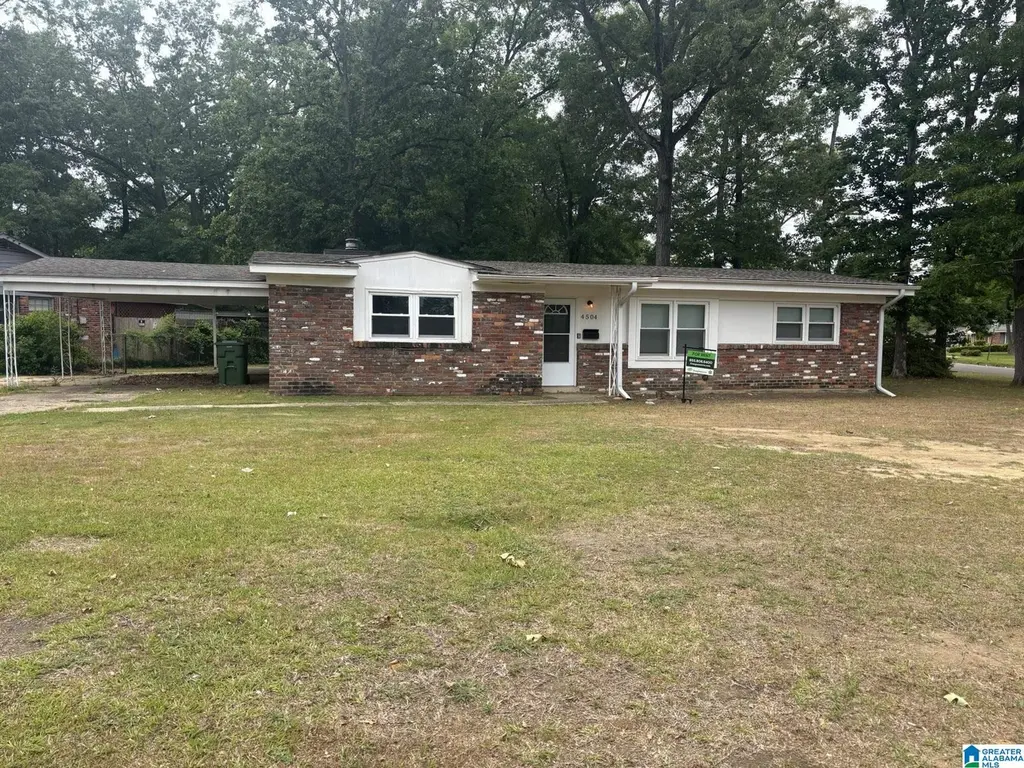
4504 Delray Dr · Montgomery, AL
Flood risk 1/10 · Minimal
- FEMA flood zone
- X (unshaded)
- Chance of flooding over 30 yrs
- 0.0%
- Est. flood insurance / yr
- $507 – $1,088
Fire risk 3/10 · Minor
- Est. fire insurance / yr
- $916 – $1,700
Heat risk 7/10 · Major
- Hot days now (above 108°F)
- 7 days/yr
- Hot days in 30 yrs
- 20 days/yr
Wind risk 8/10 · Major
- Chance of severe wind over 30 yrs
- 80.0%
Air-quality risk 2/10 · Minimal
- Unhealthy air days now
- 1 days/yr
- Unhealthy air days in 30 yrs
- 1 days/yr
Risk factors via First Street. Map © Google.
Why this score? — see what drove the D- grade
The composite is a weighted blend of 9 inputs, each scored 0–100. Each bar is that input's sub-score; the figure is the points it added to the 100-point composite (weight × sub-score).
- Cash flow +16.8/30.0
- DSCR +5.2/10.0
- Rent growth +3.9/5.0
- 1% rule +3.8/10.0
- Livability +3.2/5.0
- Condition / age +2.5/5.0
- ARV discount +2.0/15.0
- Schools +1.7/10.0
- Appreciation +0.0/10.0
$134,900
🖨 Deal sheet 📄 Offer letter ✓ Due diligence
Listing remarks MLS
Sale in "As Is" condition. Nice corner lot; 3rd bedroom has been converted to office. Good investment.
Key facts
- Easy access
- Generous lot
- Mature trees
Tags
Property features AI
Finance
- Financial info: Monthly garbage fee ($22)
- HOA & community: No association fee
Exterior
- Parking: Attached parking; 1-car carport space
- Utilities: Public water; Septic system; Electric water heater; Internet availability unknown
- Home design: Single-family existing home; Slab foundation
- Construction: Brick over foundation; Wood siding
- Exterior features: Covered patio; Porch
Interior
- Kitchen: Electric oven; Refrigerator; Laminate countertops
- Bedrooms: Master bedroom on main level; Additional bedrooms on main level; Walk-in closets
- Flooring: Hardwood floors
- Bathrooms: Two full bathrooms with tub/shower combos
- Heating & cooling: Central heating (forced air); Central electric cooling
- Interior features: Smooth ceilings; Split bedroom floor plan; Attic with pull-down access; Laminate kitchen countertops; Oven (electric) and refrigerator included
- Laundry & utility: Main-level laundry area; Washer hookup; Electric dryer hookup
Neighborhood map
What this means for you Summary
Snapshot
- This is a 2-bed/2.0-bath single-family listed at $135k.
Deal economics
- At list price, monthly cash flow is $86 ($1k/yr) — positive.
- The deal already cash-flows at list — no discount required.
- To meet the 1% rule (rent ≥ 1% of price), the offer needs to be $119k (12.0% below list).
- Recommended offer: $119k (12.0% below list) — sets the bar for 1% rule.
Location & tenants
- Location reads 65/100 on livability (#138 in AL) — a middle-class / working-renter tenant base. Strengths: cost of living A+, housing A+; Watch: employment D, crime F, amenities D-.
- Montgomery County (urban): math 9% / reading 31% proficiency, ranked #106 of 129 in AL (top 82%) — low school quality limits family demand, transient renter base, plan for 1-2y turnover; 70% free/reduced lunch — lower-income household profile, screen leases tightly.
- Zoned schools: Johnson Elementary School (math 2% / reading 17%, grade F, #568 of 627 statewide, top 94%, 352 students, 87% FRL); Lanier Senior High School (math 2% / reading 12%, grade F, #265 of 305 statewide, top 89%, 798 students, 94% FRL) — zoned schools average 90% FRL vs 70% district-wide (20 pts higher); higher-poverty schools than district average — tighter screening recommended.
- Market conditions: Rents rising fast (+5.7%/yr); 293 active listings in the ZIP; 11 comparable units currently listed for rent nearby; rentals at typical pace (median 21d on market — plan ~3-4 weeks tenant-placement turnaround); 45% of comp listings sitting > 30 days — soft ceiling on asking rent; 460 units permitted in Montgomery County in 2024 (37 in 5+ unit buildings).
Forward outlook
- Local home prices are declining (-3.0%/yr); year-one equity from $933 of loan paydown is wiped out by about $4k of value loss. Plan a longer hold.
- Montgomery County population projected to shrink 8% by 2050 — rents likely to lag national; underwrite the cash flow, not the appreciation.
Negotiation context
- It's been on market 41 days — a 3% lower offer ($131k) is reasonable based on typical stale-listing flexibility.
- 6 sale attempts since 19y ago with the ask held roughly flat each time — persistent listings suggest the price (not the market) is what's stuck; bring a comps-based counter.
Risks & watch-outs
- Climate carrying-cost: severe wind risk, 80% chance of damaging wind over 30y; extreme-heat days projected 7→20/yr by 2055 (HVAC capex compounding) — expect insurance premiums to compound above CPI over the hold.
Questions for the listing agent
- It's been on market 41 days. Have you received any prior offers? Is the seller open to a 12% concession, seller financing, or rate buy-down credit?
- Built in 1962 — when were the roof, HVAC, electrical panel, plumbing, and water heater last replaced?
- Is there a deadline driving the sale (1031 exchange, divorce, estate, relocation)? That informs how much negotiation room exists.
- Crime grade is F in this area — have there been break-ins, vandalism, or insurance claims at this property in the last 3 years? What carrier currently insures it and at what premium?
- The area grade is low — what's the realistic commute time and amenity access for the typical tenant pool here? Any planned neighborhood developments (good or bad) we should know about?
- What's the average days-on-market for RENTAL listings here right now (not sales)? A rising rental-DOM trend means longer vacancies and softer asking-rent achievability than the comps imply.
- What's the recent tenant-quality profile in this submarket — average credit score on applications, eviction rate, late-payment / NSF rate, and stable-employment percentage? A property-management company in the area should have these aggregated.
- How much new for-sale + rental construction is in the pipeline within 1–3 miles? Heavy new supply typically softens prices + rents 12–24 months out; constrained supply supports both.
Investment metrics
- 1% rule
- 0.88% ✗
- Cap rate
- 7.05%
- Cash-on-cash
- 2.72%
- DSCR
- 1.12
- GRM
- 9.5
CMA / ARV
- ARV (median comp)
- $120,309
- List price
- $134,900
- Delta
- 12.13%
- Verdict
- OVERPRICED
- Comps
- 20 within 1.0 mi
Show comp detail 12 sales within ~0.75 mi
| Address | Dist | Beds/Ba | Sqft | Sold | Price | $/sf | Match |
|---|---|---|---|---|---|---|---|
| 1712 Marlowe Dr | 0.05mi | 3/2.0 (+1) | 1,530 (-6%) | 2mo | $150,000 | $98 | 81 |
| 743 Leicester Dr | 0.21mi | 3/2.0 (+1) | 1,610 (-1%) | 6mo | $124,000 | $77 | 78 |
| 4512 Delray Rd | 0.02mi | 3/2.0 (+1) | 1,500 (-8%) | 9mo | $125,000 | $83 | 74 |
| 829 Leicester Dr | 0.14mi | 3/2.0 (+1) | 1,774 (+9%) | 3mo | $50,000 | $28 | 71 |
| 651 Seibles Rd | 0.33mi | 3/2.0 (+1) | 1,611 (-1%) | 10mo | $126,000 | $78 | 69 |
| 4712 Falcon Ln | 0.37mi | 3/2.0 (+1) | 1,636 (+0%) | 9mo | $132,000 | $81 | 69 |
| 731 Leicester Dr | 0.23mi | 3/2.0 (+1) | 1,743 (+7%) | 7mo | $140,000 | $80 | 67 |
| 4348 Rainbow Rd | 0.21mi | 3/2.0 (+1) | 1,590 (-2%) | 18mo | $122,500 | $77 | 66 |
| 1160 Queensbury Dr | 0.29mi | 3/2.0 (+1) | 1,734 (+6%) | 8mo | $115,000 | $66 | 64 |
| 4506 Narrow Lane Rd | 0.55mi | 3/2.0 (+1) | 1,784 (+10%) | 10mo | $21,100 | $12 | 45 |
| 540 Seibles Rd | 0.34mi | 3/2.0 (+1) | 1,833 (+12%) | 20mo | $165,000 | $90 | 41 |
| 1426 Marlowe Dr | 0.42mi | 3/2.0 (+1) | 1,402 (-14%) | 16mo | $118,000 | $84 | 39 |
Match score weights: distance 35% · size 25% · config 20% · recency 20%. Top-matched comps best support the ARV.
Projected returns pro-forma
-3.0% appreciation · 5.65% rent growth · sell at horizon
- IRR
- -9.3%
- Equity multiple
- 0.65×
- Total profit
- $-13,192
- Equity at exit
- $20,114
- IRR
- 3.1%
- Equity multiple
- 1.25×
- Total profit
- $9,480
- Equity at exit
- $11,664
Cash invested: $37,772 (down + closing). Projections, not guarantees.
Landlord ↔ Tenant lean methodology
- Overall (STATE)
- 90 Strongly Landlord-Friendly
- State Alabama
- 90 Strongly Landlord-Friendly · R+15
- County
- — inherits STATE
- City
- — inherits STATE
ZIP-level market 36116
- Home prices YoY
- -9.7%
- Rents YoY
- 5.7%
- Active inventory
- 293
- Price-to-rent
- 9.5×
Monthly cashflow live
- Estimated rent
- $1,187 high interval (Pro) →
- Mortgage (P&I)
- −$707
- Tax from tax record
- −$89 /mo · $1,062/yr
- Insurance
- −$56
- HOA
- −$0
- Vacancy / Maint / Mgmt
- −$249
- Net cashflow
- $86
Break-even live
UW: 25.0% down · 7.5% · 30yr · 1.5% tax · 5.0% vac · 8.0% maint · 8.0% mgmt
Financing live
Cash to close
- Down payment
- $33,725
- Closing costs
- $4,047
- Reserves months
- —
- Total cash needed
- —
Loan-product check · same deal, 3 products live
Conventional
25% down · 7.5% · 30yr
- Down + closing
- —
- Monthly P&I
- —
- Monthly cashflow
- —
- DSCR
- —
- Eligible?
- —
Personal DTI + credit; lowest rate.
DSCR
20% down · 8.5% · 30yr
- Down + closing
- —
- Monthly P&I
- —
- Monthly cashflow
- —
- DSCR
- —
- Eligible?
- —
No personal income docs; deal must DSCR.
Hard money
10% down · 12.0% · 12mo
- Down + closing
- —
- Monthly P&I
- —
- Monthly cashflow
- —
- DSCR
- —
- Eligible?
- —
Short-term bridge; refi at stabilization.
Rent comps 11 comps
| Address | Beds | Baths | Sqft | Rent | $/sqft | DOM | Units | Dist |
|---|---|---|---|---|---|---|---|---|
| 4342 Sunshine Dr Montgomery, AL | 3.0 | 2.0 | 1323 | $1,250 | $0.94 | 13d | 1 | 0.29mi |
| 1114 Druid Hills Dr Montgomery, AL | 3.0 | 1.0 | 1192 | $1,250 | $1.05 | 21d | 1 | 0.84mi |
| 548 Winston Dr Montgomery, AL | 2.0 | 2.5 | 1396 | $1,000 | $0.72 | 43d | 1 | 0.94mi |
| 3701 Wesley Dr Unit 3737 Montgomery, AL | 3.0 | 2.0 | 1050 | $1,280 | $1.22 | 43d | 1 | 1.10mi |
| 3708 Princeton Rd Montgomery, AL | 2.0 | 2.0 | 1749 | $900 | $0.51 | 21d | 1 | 1.12mi |
| 3737 Wesley Dr Montgomery, AL | 3.0 | 2.0 | 1050 | $1,280 | $1.22 | 43d | 1 | 1.13mi |
| 3649 Princeton Rd Montgomery, AL | 3.0 | 1.0 | 1266 | $1,200 | $0.95 | 21d | 1 | 1.18mi |
| 3735 Bridlewood Dr Montgomery, AL | 3.0 | 1.0 | 1386 | $895 | $0.65 | 43d | 1 | 1.26mi |
| 2230 Woodley Sq W Montgomery, AL | 1.0–2.0 | 1.0–2.0 | 902 | $898 | $1.00 | 13d | 11 | 1.32mi |
| 3212 Herbert Dr Montgomery, AL | 3.0 | 2.0 | 1180 | $1,425 | $1.21 | 21d | 1 | 1.46mi |
| 3608 Wilmington Rd Montgomery, AL | 3.0 | 1.0 | 1160 | $950 | $0.82 | 43d | 1 | 1.49mi |
Listing history 24 events
-
2026-06-18days on market $134,900 Active 41 DOM
-
2026-06-17days on market $134,900 Active 40 DOM
-
2026-06-16days on market $134,900 Active 39 DOM
-
2026-06-15days on market $134,900 Active 38 DOM
-
2026-06-14days on market $134,900 Active 36 DOM
-
2026-06-13days on market $134,900 Active 35 DOM
-
2026-06-10days on market $134,900 Active 33 DOM
-
2026-06-09days on market $134,900 Active 32 DOM
-
2026-06-08days on market $134,900 Active 31 DOM
-
2026-06-07days on market $134,900 Active 30 DOM
-
2026-06-03days on market $134,900 Active 26 DOM
-
2026-06-02days on market $134,900 Active 25 DOM
-
2026-06-01days on market $134,900 Active 24 DOM
-
2026-05-31days on market $134,900 Active 23 DOM
-
2026-05-30days on market $134,900 Active 22 DOM
-
2026-05-08$134,900 Active 478-char remark
-
2021-09-02soldstatus $270,000
-
2015-06-05$29,900
-
2014-06-06soldstatus $23,500
Show marketing remark (112 chars)
Sale in "As Is" condition. Nice corner lot; 3rd bedroom has been converted to office. Good investment.
-
2013-11-19$30,000
Show marketing remark (112 chars)
Sale in "As Is" condition. Nice corner lot; 3rd bedroom has been converted to office. Good investment.
-
2011-05-27$35,000
-
2008-08-13$89,900
-
2007-11-14soldstatus $12,250
-
2007-07-26$24,500
ⓘ Source: listings_history table (triggers on properties + properties_extension) + one-shot
backfill from property_details.listing_events for pre-trigger history.
Tax reassessment forecast AL · Resets to sale price
- Current annual tax
- $1,062 · $89/mo
- Projected year-2 tax
- $1,062 · $89/mo
- Expected delta
- $0/yr ($0/mo · 0.0%)
ⓘ Screening estimate from a state-policy table — verify with the county assessor before closing.
Climate risk First Street
- Flood 1/10 Low FEMA zone X (unshaded) · 0% chance over 30 yrs
- Wildfire 3/10 Moderate
- Heat 7/10 Severe 7 d/yr ≥108°F today · 20 d/yr by 30 yrs out
- Wind 8/10 Severe 80% chance of damaging wind over 30 yrs
- Air quality 2/10 Low 1 unhealthy d/yr today · 1 by 30 yrs out
Nearby sold comps map
Loading sold comps map…
Walkable amenities ~0.75 mi
Loading nearby amenities…
Taxation est. · year 1
- Rental income
- $14,244
- − Mortgage interest
- −$7,556
- − Property taxes
- −$1,062
- − Insurance
- −$674
- − Repairs & maintenance
- −$1,140
- − Management
- −$1,140
- − Depreciation
- −$3,924
- Taxable loss
- −$1,253
- Est. tax savings @ 24.0%
- +$301
- After-tax cash flow
- $1,328/yr
For passive investors: Depreciation is non-cash, so a rental often shows a tax loss while cash-flowing — sheltering income. Rental losses are passive: they offset passive income freely, and up to $25,000/yr can offset ordinary (W-2) income if you actively participate and your MAGI is under $100k (phasing out to $0 by $150k); unused losses carry forward. On sale, claimed depreciation is recaptured at up to 25%, and gains may owe capital-gains tax (a 1031 exchange can defer both). Figures are a year-1 estimate at your 24.0% rate — not tax advice; consult a CPA.
Schools (NCES district)
- District
- Montgomery County
- NCES district ID
- 0102430
- Math proficiency
- 9% ▼ -21.00%
- Reading proficiency
- 31% ▼ -1.00%
- Median HH income
- $43,902
- Composite
- 17.24/100
- National rank
- #9093
- State rank
- #106 of 129 in AL
Livability — Montgomery
- Score
- 65/100
- State rank
- #138
- US rank
- #13416
Category grades
Schools grade is shown separately in the Schools card above.
Census & demographics
- Census place
- Montgomery, AL
- County
- Montgomery County · 190,016 people
- City population
- 175,913
- Metro
- Montgomery, AL
- Population (ZIP)
- 45,250
- Household income
- $55,160
- Rent vs Own
- Severe rent burden
- 2786.0
Population outlook (Montgomery County) Hauer SSP2
- Today (2025)
- 224,008 people
- By 2030
- 221,460 · -1.1%
- By 2040
- 214,179 · -4.4%
- By 2050
- 204,912 · -8.5%
- By 2075
- 177,821 · -20.6%
- By 2100
- 145,134 · -35.2%
Race, ethnicity, and origin ACS 2023
- Neighborhood character
- Predominantly Black (80%)
- Race & ethnicity
- Black 80% White 12% Two or more races 4% Asian 3% Hispanic / Latino 2%
- Common ancestry
- Italian 1%
- Foreign-born
- 5% · Canada, South Korea
- Languages at home
- 94% English-only · Spanish 2% Other Indo-European 1% Korean 1%
Political lean MEDSL · Montgomery
- 2024 margin
- Solid D (+30.7) · D 64.8% · R 34.1% · Other 1.1%
- 2008→2024 swing
- +11.5pp toward D · 2008: 19.2pp · 2024: 30.7pp
- All cycles
- 2024: D+30.7 2020: D+31.5 2016: D+26.2 2012: D+24.3 2008: D+19.2
Not yet ingested
- Civics
- —
Market trends
- HPI YoY
- ▼ -16.31%
- Current HPI
- 151.8598
- Rent YoY
- ▲ 5.65%
- Metro
- Montgomery, AL
- State GDP YoY
- ▲ 2.94%
- F500 in state
- 4
Industry mix (Fortune 500 HQ in AL)
| Industry | F500 HQs | Revenue |
|---|---|---|
| Financial Services | 1 | $8B |
|
||
| Healthcare | 1 | $5B |
|
||
Price history
+450.6% since first listed9 events — show timeline
- 2026-05-08 Listed $134,900 Greater Alabama MLS
- 2021-09-02 Sold (Public Records) $270,000 Public Records
- 2015-06-05 Listed $29,900 MAAR
- 2014-06-06 Sold (MLS) $23,500 MAAR
- 2013-11-19 Listed $30,000 MAAR
- 2011-05-27 Listed $35,000 MAAR
- 2008-08-13 Listed $89,900 MAAR
- 2007-11-14 Sold (MLS) $12,250 MAAR
- 2007-07-26 Listed $24,500 MAAR
Property tax history
+8.2%/yrLatest (2025): $1,062 · -5.1% YoY. Source: county tax records.
Cash-flow waterfall
monthlySold comps — $/sqft
last 12 mo · ≤1 miLoading sold comps…