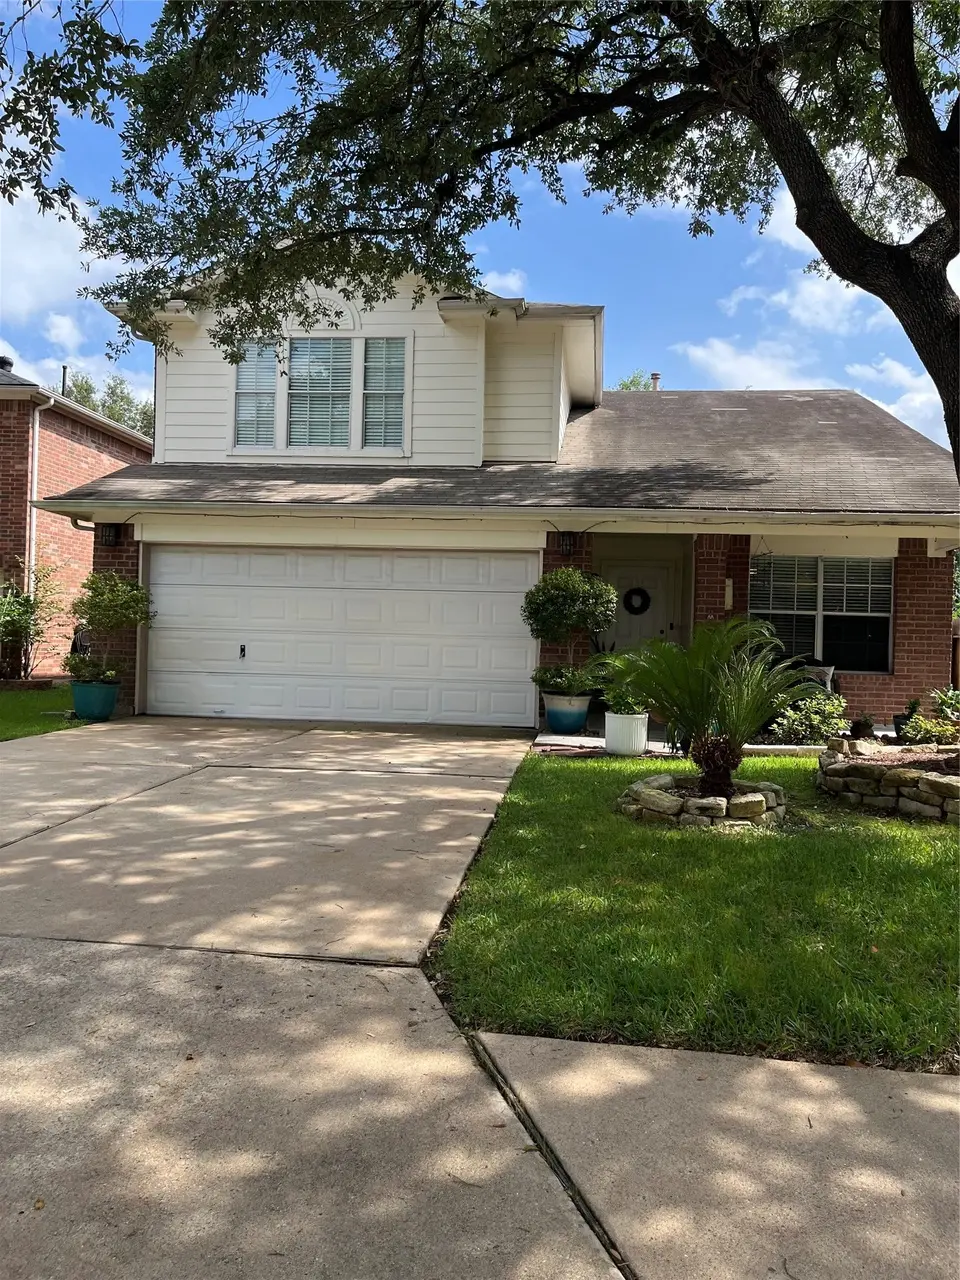
19111 Indian Stone Ln · Houston, TX
Flood risk 3/10 · Minor
- FEMA flood zone
- X (unshaded)
- Chance of flooding over 30 yrs
- 0.2%
- Est. flood insurance / yr
- $507 – $1,088
Fire risk 2/10 · Minimal
- Est. fire insurance / yr
- $1,222 – $2,270
Heat risk 9/10 · Severe
- Hot days now (above 110°F)
- 7 days/yr
- Hot days in 30 yrs
- 23 days/yr
Wind risk 8/10 · Major
- Chance of severe wind over 30 yrs
- 99.0%
Air-quality risk 2/10 · Minimal
- Unhealthy air days now
- 2 days/yr
- Unhealthy air days in 30 yrs
- 2 days/yr
Risk factors via First Street. Map © Google.
Why this score? — see what drove the D- grade
The composite is a weighted blend of 9 inputs, each scored 0–100. Each bar is that input's sub-score; the figure is the points it added to the 100-point composite (weight × sub-score).
- ARV discount +13.1/15.0
- Cash flow +6.3/30.0
- Appreciation +4.4/10.0
- Schools +4.4/10.0
- Livability +3.7/5.0
- 1% rule +3.2/10.0
- Condition / age +2.5/5.0
- Rent growth +1.8/5.0
- DSCR +0.6/10.0
$245,000
🖨 Deal sheet 📄 Offer letter ✓ Due diligence
Listing remarks
Come to see this beautiful, spacious, well-maintained home in Katy, conveniently located in Windstone subdivision, easy access to Schools zoned in CY-Fair ISD, Dining and mayor Highways, fenced backyard with no neighbors, nicely sized bedrooms and a cozy living and formal dining room combo, no flooding.
Key facts
- Fenced backyard
- 5,523 sq ft lot
- 2 garage spots
Tags
Property features AI
Finance
- HOA & community: Homeowners association: Spectrum Management; Annual association fee of $685; Association amenities include clubhouse and common areas; community pool
Exterior
- Parking: Attached garage; 2-car garage
- Utilities: Public water; Public sewer; Asphalt road access
- Home design: Residential property; Faces north; Built in 2001; Slab foundation
- Construction: Brick and wood siding construction; Composition roof
- Exterior features: Fenced back yard; Private yard; Subdivision setting; Association pool
Interior
- Kitchen: Dishwasher; Garbage disposal; Gas oven; Gas range
- Bedrooms: Primary bedroom on first floor; Primary bedroom dimensions 15x13; Bedrooms on second floor (three): 10x10, 11x10, 11x11
- Flooring: Carpet; Tile
- Bathrooms: Two full bathrooms; One half bathroom; Primary bathroom on first floor (8x9); Additional bathroom on second floor (9x8)
- Heating & cooling: Central heating (gas); Central electric air conditioning
- Interior features: High ceilings; Ceiling fan(s); Bath in primary bedroom; Gas fireplace (1)
- Laundry & utility: Washer hookup; Gas dryer hookup
Neighborhood map
What this means for you Summary
Snapshot
- This is a 3-bed/2.5-bath single-family listed at $245k.
Deal economics
- At list price, monthly cash flow is $-440 ($-5k/yr) — negative.
- To cash-flow at today's rent, offer at most $167k (31.7% below list).
- To meet the 1% rule (rent ≥ 1% of price), the offer needs to be $201k (18.0% below list).
- Recommended offer: $167k (31.7% below list) — sets the bar for cash-flow.
- Cap rate 4.1% vs local median 3.2% in Houston — top-decile yield for the area; either an underpriced asset or a hidden risk that comps aren't pricing in. Stress-test before assuming the spread holds.
Location & tenants
- Location reads 74/100 on livability (#184 in TX, #4,771 nationally) — a middle-class / working-renter tenant base. Strengths: amenities A+, cost of living A+, housing A+; Watch: crime F.
- Cypress-Fairbanks ISD (suburban): math 45% / reading 52% proficiency, ranked #161 of 826 in TX (top 20%) — families likely to look elsewhere, expect single-tenant / working-renter base with shorter leases.
- Zoned schools: Thornton Middle (math 28% / reading 41%, grade F, #858 of 1,662 statewide, top 54%, 1,397 students, 80% FRL); Cypress Lakes H S (math 33% / reading 48%, grade F, #798 of 1,632 statewide, top 49%, 3,179 students, 73% FRL) — zoned schools average 76% FRL vs 43% district-wide (34 pts higher); higher-poverty schools than district average — tighter screening recommended.
- Market conditions: Rents soft (-2.9%/yr); 744 active listings in the ZIP; 24 comparable units currently listed for rent nearby; rentals at typical pace (median 22d on market — plan ~3-4 weeks tenant-placement turnaround); solid renter incomes; 29,883 units permitted in Harris County in 2024 (8,621 in 5+ unit buildings).
Forward outlook
- Local home prices are declining (-1.3%/yr); year-one equity from $2k of loan paydown is wiped out by about $3k of value loss. Plan a longer hold.
- Harris County population projected at +47% by 2050 — long-run rental-demand tailwind backs the buy-and-hold thesis.
Negotiation context
- It's been on market 34 days — a 3% lower offer ($238k) is reasonable based on typical stale-listing flexibility.
- 3 sale attempts since 18y ago with the ask held roughly flat each time — persistent listings suggest the price (not the market) is what's stuck; bring a comps-based counter.
- Current owner paid $106k; list at $245k implies a 131% gain — meaningful room to come down on a strong offer.
Risks & watch-outs
- Watch-outs: property tax is 2.9% of price.
- Climate carrying-cost: severe wind risk, 99% chance of damaging wind over 30y; extreme-heat days projected 7→23/yr by 2055 (HVAC capex compounding) — expect insurance premiums to compound above CPI over the hold.
Questions for the listing agent
- What do current leases actually rent for vs. the listed asking? Can we see a recent rent roll and the last 12 months of T-12 income?
- It's been on market 34 days. Have you received any prior offers? Is the seller open to a 32% concession, seller financing, or rate buy-down credit?
- Property tax is high relative to price — has the assessment been appealed recently, and will the sale trigger a re-assessment?
- What does the HOA fee cover, when was the last increase, and are there any pending special assessments or reserve-fund shortfalls?
- Is there a deadline driving the sale (1031 exchange, divorce, estate, relocation)? That informs how much negotiation room exists.
- Schools are D-rated, which usually means shorter tenancies and higher turnover. Who's the typical renter profile here, and what's been the actual vacancy rate?
- Crime grade is F in this area — have there been break-ins, vandalism, or insurance claims at this property in the last 3 years? What carrier currently insures it and at what premium?
- The area grade is low — what's the realistic commute time and amenity access for the typical tenant pool here? Any planned neighborhood developments (good or bad) we should know about?
- What's the average days-on-market for RENTAL listings here right now (not sales)? A rising rental-DOM trend means longer vacancies and softer asking-rent achievability than the comps imply.
- What's the recent tenant-quality profile in this submarket — average credit score on applications, eviction rate, late-payment / NSF rate, and stable-employment percentage? A property-management company in the area should have these aggregated.
- How much new for-sale + rental construction is in the pipeline within 1–3 miles? Heavy new supply typically softens prices + rents 12–24 months out; constrained supply supports both.
Investment metrics
- 1% rule
- 0.82% ✗
- Cap rate
- 4.14%
- Cash-on-cash
- -7.70%
- DSCR
- 0.66
- GRM
- 10.2
CMA / ARV
- ARV (median comp)
- $279,850
- List price
- $245,000
- Delta
- -12.45%
- Verdict
- UNDERPRICED
- Comps
- 20 within 1.0 mi
Show comp detail 12 sales within ~0.75 mi
| Address | Dist | Beds/Ba | Sqft | Sold | Price | $/sf | Match |
|---|---|---|---|---|---|---|---|
| 4918 Dwarf Honey Suckle Ct | 0.19mi | 3/2.0 | 2,159 (+3%) | 0mo | $275,000 | $127 | 84 |
| 4819 Monarch Glen Ln | 0.10mi | 4/2.5 (+1) | 2,260 (+8%) | 3mo | $274,000 | $121 | 75 |
| 18810 Appletree Ridge Rd | 0.35mi | 3/2.0 | 1,986 (-5%) | 4mo | $287,000 | $145 | 70 |
| 18822 Appletree Ridge Rd | 0.32mi | 3/2.0 | 1,928 (-8%) | 1mo | $285,000 | $148 | 69 |
| 4711 Ivy Meadow Ln | 0.49mi | 4/2.5 (+1) | 2,100 (+0%) | 4mo | $275,000 | $131 | 68 |
| 4911 Windcross Ct | 0.41mi | 4/2.0 (+1) | 2,199 (+5%) | 5mo | $280,000 | $127 | 61 |
| 4607 Wild Bluebonnet Way | 0.48mi | 4/2.0 (+1) | 2,191 (+5%) | 5mo | $290,000 | $132 | 59 |
| 4810 Plum Forest Rd | 0.53mi | 4/2.0 (+1) | 2,249 (+7%) | 4mo | $290,000 | $129 | 53 |
| 19338 Montclair Meadow Ln | 0.43mi | 4/2.5 (+1) | 1,856 (-11%) | 4mo | $250,000 | $135 | 52 |
| 18739 Appletree Ridge Rd | 0.42mi | 4/2.0 (+1) | 1,872 (-11%) | 5mo | $269,000 | $144 | 52 |
| 18334 Gardens End Ln | 0.74mi | 4/3.0 (+1) | 2,268 (+8%) | 2mo | $360,000 | $159 | 43 |
| 18511 Windy Stone Dr | 0.59mi | 4/3.0 (+1) | 2,388 (+14%) | 2mo | $345,000 | $144 | 41 |
Match score weights: distance 35% · size 25% · config 20% · recency 20%. Top-matched comps best support the ARV.
Projected returns pro-forma
-1.27% appreciation · 0.0% rent growth · sell at horizon
- IRR
- -20.0%
- Equity multiple
- 0.20×
- Total profit
- $-55,122
- Equity at exit
- $55,971
- IRR
- -17.4%
- Equity multiple
- -0.30×
- Total profit
- $-88,988
- Equity at exit
- $56,114
Cash invested: $68,600 (down + closing). Projections, not guarantees.
Landlord ↔ Tenant lean methodology
- Overall (STATE)
- 87 Strongly Landlord-Friendly
- State Texas
- 87 Strongly Landlord-Friendly · R+5
- County
- — inherits STATE
- City
- — inherits STATE
ZIP-level market 77449
- Home prices YoY
- -0.5%
- Rents YoY
- -2.9%
- Active inventory
- 744
- Price-to-rent
- 10.2×
Monthly cashflow live
- Estimated rent
- $2,010 high interval (Pro) →
- Mortgage (P&I)
- −$1,285
- Tax from tax record
- −$584 /mo · $7,010/yr
- Insurance
- −$102
- HOA
- −$57
- Vacancy / Maint / Mgmt
- −$422
- Net cashflow
- $-440
Break-even live
UW: 25.0% down · 7.5% · 30yr · 1.5% tax · 5.0% vac · 8.0% maint · 8.0% mgmt
Financing live
Cash to close
- Down payment
- $61,250
- Closing costs
- $7,350
- Reserves months
- —
- Total cash needed
- —
Loan-product check · same deal, 3 products live
Conventional
25% down · 7.5% · 30yr
- Down + closing
- —
- Monthly P&I
- —
- Monthly cashflow
- —
- DSCR
- —
- Eligible?
- —
Personal DTI + credit; lowest rate.
DSCR
20% down · 8.5% · 30yr
- Down + closing
- —
- Monthly P&I
- —
- Monthly cashflow
- —
- DSCR
- —
- Eligible?
- —
No personal income docs; deal must DSCR.
Hard money
10% down · 12.0% · 12mo
- Down + closing
- —
- Monthly P&I
- —
- Monthly cashflow
- —
- DSCR
- —
- Eligible?
- —
Short-term bridge; refi at stabilization.
Rent comps 24 comps
| Address | Beds | Baths | Sqft | Rent | $/sqft | DOM | Units | Dist |
|---|---|---|---|---|---|---|---|---|
| 19211 Sunny Leaf Ln Katy, TX | 3.0 | 2.5 | 2460 | $1,931 | $0.78 | 22d | 1 | 0.28mi |
| 4818 Twisting Rd Houston, TX | 4.0 | 2.5 | 2516 | $2,245 | $0.89 | 20d | 1 | 0.31mi |
| 18810 Brescia Ln Katy, TX | 3.0 | 3.0 | 1777 | $2,010 | $1.13 | 43d | 1 | 0.52mi |
| 19311 Cypress Bay Dr Katy, TX | 3.0 | 2.0 | 2052 | $2,080 | $1.01 | 3d | 1 | 0.68mi |
| 18530 Paddys Creek Trl Katy, TX | 3.0 | 3.0 | 1777 | $2,010 | $1.13 | 43d | 1 | 0.75mi |
| 5843 Kyle Cove Dr Katy, TX | 3.0 | 3.0 | 1777 | $2,010 | $1.13 | 43d | 1 | 0.76mi |
| 4211 Falcon Meadow Dr Katy, TX | 3.0 | 2.0 | 1436 | $1,795 | $1.25 | 24d | 1 | 0.77mi |
| 5707 Amelia Plantation Dr Katy, TX | 4.0 | 3.0 | 1687 | $2,020 | $1.20 | 43d | 1 | 0.80mi |
| 18606 Cooper Ravine Way Katy, TX | 3.0 | 2.5 | 2100 | $1,885 | $0.90 | 5d | 1 | 0.85mi |
| 19319 Cypress Arbor Ct Katy, TX | 4.0 | 3.0 | 1794 | $1,940 | $1.08 | 7d | 1 | 0.85mi |
| 20014 Windcroft Hollow Ln Katy, TX | 3.0 | 2.0 | 1458 | $1,689 | $1.16 | 2d | 1 | 0.90mi |
| 5915 Shining Leaf Ct Katy, TX | 4.0 | 2.0 | 1742 | $1,890 | $1.08 | 43d | 1 | 0.98mi |
| 6210 Scotchwood Dr Katy, TX | 3.0 | 2.0 | 1680 | $1,696 | $1.01 | 22d | 1 | 1.05mi |
| 4802 Upland Dale Ct Katy, TX | 3.0 | 3.0 | 2298 | $2,100 | $0.91 | 11d | 1 | 1.09mi |
| 21207 Woodland Green Dr Katy, TX | 4.0 | 3.0 | 2017 | $2,099 | $1.04 | 43d | 1 | 1.14mi |
| 6331 Scotchwood Dr Katy, TX | 3.0 | 2.5 | 1610 | $1,681 | $1.04 | 5d | 1 | 1.19mi |
| 19730 Cozy Cabbin Dr Katy, TX | 3.0 | 2.0 | 1544 | $1,800 | $1.17 | 22d | 1 | 1.23mi |
| 5418 Gosforth Dr Katy, TX | 3.0 | 2.5 | 2150 | $2,150 | $1.00 | 43d | 1 | 1.24mi |
| 19735 Plantation Grove Trl Katy, TX | 3.0 | 2.0 | 1404 | $1,719 | $1.22 | 2d | 1 | 1.26mi |
| 6018 Fern Hollow Ct Katy, TX | 3.0 | 2.5 | 1910 | $1,855 | $0.97 | 16d | 1 | 1.27mi |
| 18745 Dennington Dr Katy, TX | 4.0 | 2.5 | 1917 | $1,500 | $0.78 | 4d | 1 | 1.28mi |
| 5039 Lamppost Hill Ct Katy, TX | 4.0 | 2.5 | 2384 | $1,896 | $0.80 | 22d | 1 | 1.29mi |
| 19802 Plantation Grove Trl Katy, TX | 3.0 | 2.0 | 1607 | $1,745 | $1.09 | 43d | 1 | 1.30mi |
| 18622 Dennington Dr Katy, TX | 4.0 | 2.5 | 2281 | $1,625 | $0.71 | 43d | 1 | 1.36mi |
HOA detail
- Monthly dues
- $57 · $684/yr
Listing history 25 events
-
2026-06-18days on market $245,000 Active 34 DOM
-
2026-06-17days on market $245,000 Active 33 DOM
-
2026-06-16days on market $245,000 Active 32 DOM
-
2026-06-15days on market $245,000 Active 31 DOM
-
2026-06-13days on market $245,000 Active 29 DOM
-
2026-06-13days on market $245,000 Active 28 DOM
-
2026-06-09days on market $245,000 Active 25 DOM
-
2026-06-08days on market $245,000 Active 24 DOM
-
2026-06-07days on market $245,000 Active 23 DOM
-
2026-06-04days on market $245,000 Active 20 DOM
-
2026-06-03days on market $245,000 Active 19 DOM
-
2026-06-02days on market $245,000 Active 18 DOM
-
2026-06-01days on market $245,000 Active 17 DOM
-
2026-05-31days on market $245,000 Active 16 DOM
-
2026-05-15$245,000 Active 306-char remark
-
2022-08-10status Option Pending
-
2022-08-09historical
-
2022-08-03price $270,000
-
2022-07-05price $2,600
-
2022-07-02price $280,000
-
2022-06-01$295,000 Active
-
2010-03-22soldstatus $106,230
-
2008-08-29historical
-
2008-02-25$135,900
-
2001-01-01soldstatus
ⓘ Source: listings_history table (triggers on properties + properties_extension) + one-shot
backfill from property_details.listing_events for pre-trigger history.
Tax reassessment forecast TX · Resets to sale price
- Current annual tax
- $7,010 · $584/mo
- Projected year-2 tax
- $7,010 · $584/mo
- Expected delta
- $0/yr ($0/mo · 0.0%)
ⓘ Screening estimate from a state-policy table — verify with the county assessor before closing.
Climate risk First Street
- Flood 3/10 Moderate FEMA zone X (unshaded) · 20% chance over 30 yrs
- Wildfire 2/10 Low
- Heat 9/10 Extreme 7 d/yr ≥110°F today · 23 d/yr by 30 yrs out
- Wind 8/10 Severe 99% chance of damaging wind over 30 yrs
- Air quality 2/10 Low 2 unhealthy d/yr today · 2 by 30 yrs out
Nearby sold comps map
Loading sold comps map…
Walkable amenities ~0.75 mi
Loading nearby amenities…
Taxation est. · year 1
- Rental income
- $24,119
- − Mortgage interest
- −$13,724
- − Property taxes
- −$7,010
- − Insurance
- −$1,225
- − Repairs & maintenance
- −$1,930
- − Management
- −$1,930
- − HOA
- −$684
- − Depreciation
- −$7,127
- Taxable loss
- −$9,511
- Est. tax savings @ 24.0%
- +$2,283
- After-tax cash flow
- $-3,001/yr
For passive investors: Depreciation is non-cash, so a rental often shows a tax loss while cash-flowing — sheltering income. Rental losses are passive: they offset passive income freely, and up to $25,000/yr can offset ordinary (W-2) income if you actively participate and your MAGI is under $100k (phasing out to $0 by $150k); unused losses carry forward. On sale, claimed depreciation is recaptured at up to 25%, and gains may owe capital-gains tax (a 1031 exchange can defer both). Figures are a year-1 estimate at your 24.0% rate — not tax advice; consult a CPA.
Schools (NCES district)
- District
- Cypress-Fairbanks ISD
- NCES district ID
- 4816110
- Math proficiency
- 45% ▼ -12.00%
- Reading proficiency
- 52% ▼ -2.00%
- Median HH income
- $72,025
- Composite
- 43.63/100
- National rank
- #2968
- State rank
- #161 of 826 in TX
Livability — Houston
- Score
- 74/100
- State rank
- #184
- US rank
- #4771
Category grades
Schools grade is shown separately in the Schools card above.
Census & demographics
- County
- Harris County · 4,702,590 people
- City population
- 3,226,434
- Metro
- Houston-The Woodlands-Sugar Land, TX
- Population (ZIP)
- 130,028
- Household income
- $87,808
- Rent vs Own
- Severe rent burden
- 3088.0
Population outlook (Harris County) Hauer SSP2
- Today (2025)
- 5,571,493 people
- By 2030
- 6,089,821 · +9.3%
- By 2040
- 7,142,806 · +28.2%
- By 2050
- 8,185,864 · +46.9%
- By 2075
- 10,574,329 · +89.8%
- By 2100
- 12,109,958 · +117.4%
Race, ethnicity, and origin ACS 2023
- Neighborhood character
- Diverse neighborhood (Simpson 0.68)
- Race & ethnicity
- Hispanic / Latino 49% Two or more races 22% Black 20% White 19% Asian 6%
- Hispanic origin (detail)
- Mexican 26% Puerto Rican 1% Cuban 4%
- Common ancestry
- Lithuanian 1% Italian 1%
- Foreign-born
- 32% · Canada, Jamaica, Vietnam
- Languages at home
- 48% English-only · Spanish 40% Other Indo-European 3% Vietnamese 1%
Political lean MEDSL · Harris
- 2024 margin
- Lean D (+5.5) · D 52.0% · R 46.4% · Other 1.6%
- 2008→2024 swing
- +3.9pp toward D · 2008: 1.6pp · 2024: 5.5pp
- All cycles
- 2024: D+5.5 2020: D+13.3 2016: D+12.4 2012: D+0.1 2008: D+1.6
Not yet ingested
- Civics
- —
Market trends
- HPI YoY
- ▼ -1.27%
- Current HPI
- 254.6622
- Rent YoY
- ▼ -2.86%
- Metro
- Houston-The Woodlands-Sugar Land, TX
- State GDP YoY
- ▲ 3.95%
- F500 in state
- 110
Industry mix (Fortune 500 HQ in TX)
| Industry | F500 HQs | Revenue |
|---|---|---|
| Energy | 16 | $1,198B |
|
||
| Technology | 5 | $198B |
|
||
| Engineering / Construction | 4 | $72B |
|
||
| Energy Services | 3 | $60B |
|
||
| Utilities | 3 | $41B |
|
||
| Healthcare | 2 | $330B |
|
||
Price history
+80.3% since first listed11 events — show timeline
- 2026-05-15 Listed $245,000 HARMLS
- 2022-08-10 Pending — HARMLS
- 2022-08-09 Listing Removed — HARMLS
- 2022-08-03 Price Changed $270,000 HARMLS
- 2022-07-05 Price Changed $2,600 RENT.
- 2022-07-02 Price Changed $280,000 HARMLS
- 2022-06-01 Listed $295,000 HARMLS
- 2010-03-22 Sold (Public Records) $106,230 Public Records
- 2008-08-29 Listing Removed — HARMLS
- 2008-02-25 Listed $135,900 HARMLS
- 2001-01-01 Sold (Public Records) — Public Records
Property tax history
+5.2%/yrLatest (2025): $7,010 · +2.6% YoY. Source: county tax records.
Cash-flow waterfall
monthlySold comps — $/sqft
last 12 mo · ≤1 miLoading sold comps…