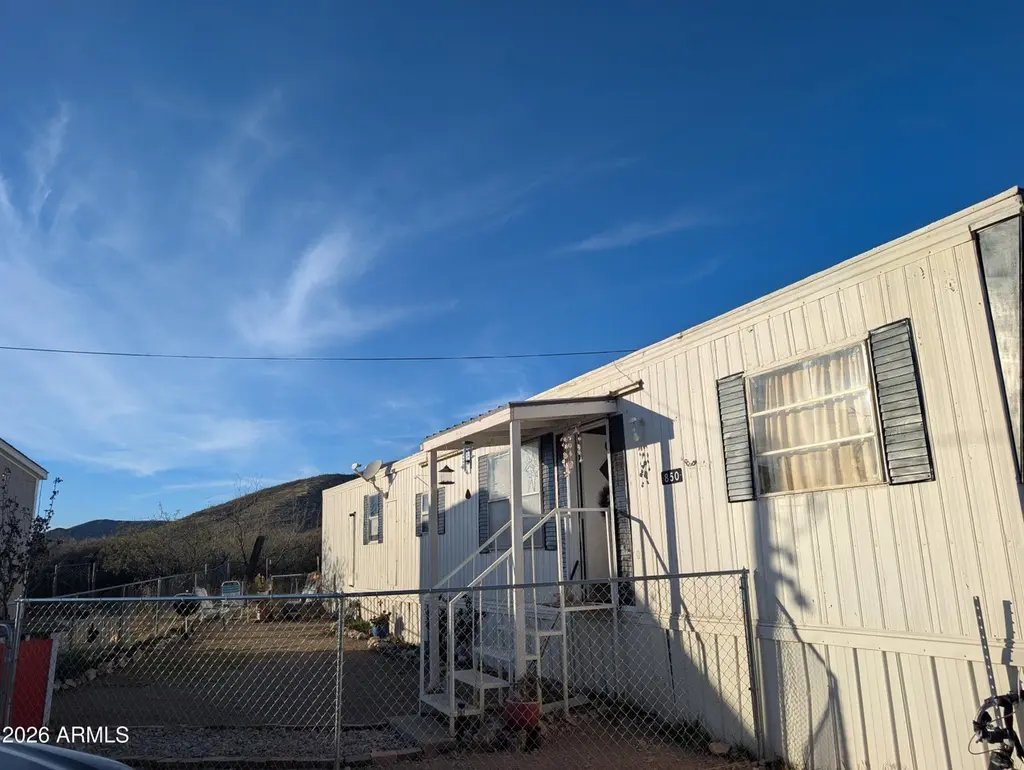
850 W Sieling Loop · Bisbee, AZ
Flood risk 1/10 · Minimal
- FEMA flood zone
- X (unshaded)
- Chance of flooding over 30 yrs
- 0.0%
- Est. flood insurance / yr
- $507 – $1,088
Fire risk 8/10 · Major
- Est. fire insurance / yr
- $610 – $1,132
Heat risk 4/10 · Minor
- Hot days now (above 95°F)
- 6 days/yr
- Hot days in 30 yrs
- 15 days/yr
Wind risk 1/10 · Minimal
- Chance of severe wind over 30 yrs
- —
Air-quality risk 1/10 · Minimal
- Unhealthy air days now
- 0 days/yr
- Unhealthy air days in 30 yrs
- 0 days/yr
Risk factors via First Street. Map © Google.
Why this score? — see what drove the D grade
The composite is a weighted blend of 9 inputs, each scored 0–100. Each bar is that input's sub-score; the figure is the points it added to the 100-point composite (weight × sub-score).
- Cash flow +15.0/30.0
- ARV discount +7.5/15.0
- 1% rule +5.0/10.0
- DSCR +5.0/10.0
- Livability +3.1/5.0
- Condition / age +2.8/5.0
- Rent growth +2.5/5.0
- Schools +1.2/10.0
- Appreciation +0.0/10.0
$20,000
🖨 Deal sheet (PDF) 📄 Offer letter ✓ Due diligence
Key facts
- Built 1971
- Listed 117 days
Neighborhood map
What this means for you Summary
Snapshot
- This is a 2-bed/2.0-bath single-family listed at $20k. Condition is rated average.
Deal economics
- At list price, monthly cash flow is $533 ($6k/yr) — positive.
- The deal already cash-flows at list — no discount required.
- Meets the 1% rule at list price ($850 rent vs $20k).
- Recommended offer: $18k (9.0% below list) — sets the bar for market timing.
- Cap rate 38.3% vs local median 2.1% in Bisbee — top-decile yield for the area; either an underpriced asset or a hidden risk that comps aren't pricing in. Stress-test before assuming the spread holds.
Location & tenants
- Location reads 61/100 on livability (#151 in AZ) — a middle-class / working-renter tenant base. Strengths: crime A+, cost of living A+, housing A; Watch: employment D, amenities F, commute F.
- Bisbee Unified District (4169) (town): math 10% / reading 19% proficiency, ranked #218 of 249 in AZ (top 88%) — low school quality limits family demand, transient renter base, plan for 1-2y turnover.
- Zoned schools: Greenway Primary School (math 17% / reading 27%, grade F, #687 of 1,109 statewide, top 65%, 212 students, 76% FRL); Lowell School (math 8% / reading 17%, grade F, #174 of 218 statewide, top 81%, 116 students, 66% FRL); Bisbee High School (math 8% / reading 17%, grade F, #281 of 381 statewide, top 75%, 352 students, 53% FRL).
- Market conditions: 137 active listings in the ZIP; 1 comparable units currently listed for rent nearby; 437 units permitted in Cochise County in 2024 (6 in 5+ unit buildings).
Forward outlook
- Local home prices are declining (-3.0%/yr); year-one equity from $138 of loan paydown is wiped out by about $600 of value loss. Plan a longer hold.
- Cochise County population projected at -30% by 2050 — secular population decline; favor cash flow + early exit over multi-decade hold.
- At projected returns (-3.0% appreciation + 3.0% rent growth), your $6k cash investment doubles in ~1 year — after that, you're playing with house money.
Negotiation context
- It's been on market 118 days — a 9% lower offer ($18k) is reasonable based on typical stale-listing flexibility.
Risks & watch-outs
- Climate carrying-cost: severe wildfire risk — expect insurance premiums to compound above CPI over the hold.
Questions for the listing agent
- It's been on market 118 days. Have you received any prior offers? Is the seller open to a 9% concession, seller financing, or rate buy-down credit?
- Built in 1971 — when were the roof, HVAC, electrical panel, plumbing, and water heater last replaced?
- Why hasn't it sold? Are there any deal-killer items the seller is aware of (foundation, flood, title, zoning, code violations)?
- Is there a deadline driving the sale (1031 exchange, divorce, estate, relocation)? That informs how much negotiation room exists.
- Schools are F-rated, which usually means shorter tenancies and higher turnover. Who's the typical renter profile here, and what's been the actual vacancy rate?
- The area grade is low — what's the realistic commute time and amenity access for the typical tenant pool here? Any planned neighborhood developments (good or bad) we should know about?
- What's the average days-on-market for RENTAL listings here right now (not sales)? A rising rental-DOM trend means longer vacancies and softer asking-rent achievability than the comps imply.
- What's the recent tenant-quality profile in this submarket — average credit score on applications, eviction rate, late-payment / NSF rate, and stable-employment percentage? A property-management company in the area should have these aggregated.
- How much new for-sale + rental construction is in the pipeline within 1–3 miles? Heavy new supply typically softens prices + rents 12–24 months out; constrained supply supports both.
Investment metrics
- 1% rule
- 4.25% ✓
- Cap rate
- 38.29%
- Cash-on-cash
- 114.28%
- DSCR
- 6.08
- GRM
- 2.0
CMA / ARV
- ARV (median comp)
- $133,396
- List price
- $20,000
- Delta
- -85.01%
- Verdict
- UNDERPRICED
- Comps
- 12 within 1.0 mi
Projected returns pro-forma
-3.0% appreciation · 3.0% rent growth · sell at horizon
- IRR
- —
- Equity multiple
- 6.49×
- Total profit
- $30,737
- Equity at exit
- $2,982
- IRR
- —
- Equity multiple
- 13.60×
- Total profit
- $70,553
- Equity at exit
- $1,729
Cash invested: $5,600 (down + closing). Projections, not guarantees.
Landlord ↔ Tenant lean methodology
- Overall (STATE)
- 87 Strongly Landlord-Friendly
- State Arizona
- 87 Strongly Landlord-Friendly · R+3
- County
- — inherits STATE
- City
- — inherits STATE
ZIP-level market 85603
- Active inventory
- 137
- Price-to-rent
- 2.0×
Monthly cashflow live
- Estimated rent
- $850 medium interval (Pro) →
- Mortgage (P&I)
- −$105
- Tax est. 1.5%
- −$25 /mo · $300/yr
- Insurance
- −$8
- HOA
- −$0
- Vacancy / Maint / Mgmt
- −$178
- Net cashflow
- $533
Break-even live
Sensitivity live
| Price | -10% $547 | -5% $540 | +0% $533 | +5% $526 | +10% $519 |
|---|---|---|---|---|---|
| Rent | -10% $466 | -5% $500 | +0% $533 | +5% $567 | +10% $600 |
| Rate | -1.0pp $543 | -0.5pp $538 | base $533 | +0.5pp $528 | +1.0pp $523 |
UW: 25.0% down · 7.5% · 30yr · 1.5% tax · 5.0% vac · 8.0% maint · 8.0% mgmt
Financing live
Cash to close
- Down payment
- $5,000
- Closing costs
- $600
- Reserves months
- —
- Total cash needed
- —
Loan-product check · same deal, 3 products live
Conventional
25% down · 7.5% · 30yr
- Down + closing
- —
- Monthly P&I
- —
- Monthly cashflow
- —
- DSCR
- —
- Eligible?
- —
Personal DTI + credit; lowest rate.
DSCR
20% down · 8.5% · 30yr
- Down + closing
- —
- Monthly P&I
- —
- Monthly cashflow
- —
- DSCR
- —
- Eligible?
- —
No personal income docs; deal must DSCR.
Hard money
10% down · 12.0% · 12mo
- Down + closing
- —
- Monthly P&I
- —
- Monthly cashflow
- —
- DSCR
- —
- Eligible?
- —
Short-term bridge; refi at stabilization.
Rent comps 1 comps
| Address | Beds | Baths | Sqft | Rent | $/sqft | DOM | Units | Dist |
|---|---|---|---|---|---|---|---|---|
| 872 Arizona 92 Unit a Bisbee, AZ | 1.0 | 1.5 | 600 | $850 | $1.42 | 45d | 1 | 0.19mi |
Listing history 8 events
-
2026-06-03days on market $20,000 Active 118 DOM
-
2026-06-02days on market $20,000 Active 117 DOM
-
2026-06-01days on market $20,000 Active 116 DOM
-
2026-05-31days on market $20,000 Active 115 DOM
-
2026-05-30days on market $20,000 Active 114 DOM
-
2026-05-11price $20,000
-
2026-03-23price $23,500
-
2026-02-02$25,000 Active
ⓘ Source: listings_history table (triggers on properties + properties_extension) + one-shot
backfill from property_details.listing_events for pre-trigger history.
Climate risk First Street
- Flood 1/10 Low FEMA zone X (unshaded) · 0% chance over 30 yrs
- Wildfire 8/10 Severe
- Heat 4/10 Moderate 6 d/yr ≥95°F today · 15 d/yr by 30 yrs out
- Wind 1/10 Low
- Air quality 1/10 Low 0 unhealthy d/yr today · 0 by 30 yrs out
Nearby sold comps map
Loading sold comps map…
Walkable amenities ~0.75 mi
Loading nearby amenities…
Taxation est. · year 1
- Rental income
- $10,200
- − Mortgage interest
- −$1,120
- − Property taxes
- −$300
- − Insurance
- −$100
- − Repairs & maintenance
- −$816
- − Management
- −$816
- − Depreciation
- −$582
- Taxable income
- $6,466
- Est. tax owed @ 24.0%
- −$1,552
- After-tax cash flow
- $4,848/yr
For passive investors: Depreciation is non-cash, so a rental often shows a tax loss while cash-flowing — sheltering income. Rental losses are passive: they offset passive income freely, and up to $25,000/yr can offset ordinary (W-2) income if you actively participate and your MAGI is under $100k (phasing out to $0 by $150k); unused losses carry forward. On sale, claimed depreciation is recaptured at up to 25%, and gains may owe capital-gains tax (a 1031 exchange can defer both). Figures are a year-1 estimate at your 24.0% rate — not tax advice; consult a CPA.
Condition & rehab AI · 11 photos
This manufactured home requires some cosmetic updates and maintenance to improve its condition and value. Painting, landscaping, and HVAC upgrades can significantly enhance its appeal and marketability.
Repairs flagged
- Minor Kitchen cabinets — Light wear and tear.
- Minor Bathroom fixtures — Light wear and tear.
- Minor Exterior siding — Some discoloration and wear.
- Minor Interior walls — Chipped paint in some areas.
- Minor Windows — Some frames show wear.
- Minor Landscaping — Minimal and overgrown in some areas.
- Moderate HVAC system — Age may affect efficiency and performance.
- Minor Foundation cracks — Visible cracks may need inspection and repair.
Value-add opportunities
- Both Painting and updating interior walls — Fresh paint can improve the home's appearance and value.
- Both Landscaping improvements — Aesthetic improvements can enhance curb appeal and value.
- Both HVAC system upgrade — A new HVAC system can improve comfort and energy efficiency, boosting both resale and rental value.
- Both Kitchen and bathroom updates — Fresh updates can make the home more appealing and functional, increasing its value.
Renovation cost estimate screening
| Repair item | Severity | Est. cost |
|---|---|---|
| Kitchen cabinets · Light wear and tear. | Minor | $500–3,000 |
| Bathroom fixtures · Light wear and tear. | Minor | $500–3,000 |
| Exterior siding · Some discoloration and wear. | Minor | $500–3,000 |
| Interior walls · Chipped paint in some areas. | Minor | $500–3,000 |
| Windows · Some frames show wear. | Minor | $500–3,000 |
| Landscaping · Minimal and overgrown in some areas. | Minor | $500–3,000 |
| HVAC system · Age may affect efficiency and performance. | Moderate | $3,000–15,000 |
| Foundation cracks · Visible cracks may need inspection and repair. | Minor | $500–3,000 |
| Total estimated repair cost · 8 items | $6,500–36,000 |
Value-add ROI direction
- Both Painting and updating interior walls — Fresh paint can improve the home's appearance and value. ↑
- Both Landscaping improvements — Aesthetic improvements can enhance curb appeal and value. ↑
- Both HVAC system upgrade — A new HVAC system can improve comfort and energy efficiency, boosting both resale and rental value. ↑
- Both Kitchen and bathroom updates — Fresh updates can make the home more appealing and functional, increasing its value. ↑
ⓘ Cost ranges are severity-bucket heuristics (US national rule-of-thumb). Get contractor quotes + a written scope before underwriting a rehab budget.
Schools (NCES district)
- District
- Bisbee Unified District (4169)
- NCES district ID
- 0401180
- Math proficiency
- 10% ▼ -20.00%
- Reading proficiency
- 19% ▼ -8.00%
- Median HH income
- $33,316
- Composite
- 11.73/100
- National rank
- #9688
- State rank
- #218 of 249 in AZ
Livability — Bisbee
- Score
- 61/100
- State rank
- #151
- US rank
- #17700
Category grades
Schools grade is shown separately in the Schools card above.
Census & demographics
- Population (ZIP)
- 6,798
Population outlook (Cochise County) Hauer SSP2
- Today (2025)
- 113,402 people
- By 2030
- 106,197 · -6.4%
- By 2040
- 92,166 · -18.7%
- By 2050
- 79,805 · -29.6%
- By 2075
- 56,831 · -49.9%
- By 2100
- 35,103 · -69.0%
Race, ethnicity, and origin ACS 2023
- Neighborhood character
- Majority White (62%)
- Race & ethnicity
- White 62% Hispanic / Latino 33% Two or more races 23% Native American 2%
- Hispanic origin (detail)
- Mexican 30%
- Common ancestry
- Slovak 3% Iranian 2% Serbian 2%
- Foreign-born
- 7% · Canada
- Languages at home
- 78% English-only · Spanish 20% French/Haitian/Cajun 1% German/W. Germanic 1%
Political lean MEDSL · Cochise
- 2024 margin
- Strong R (+23.1) · D 37.8% · R 61.0% · Other 1.2%
- 2008→2024 swing
- -2.5pp toward R · 2008: -20.7pp · 2024: -23.1pp
- All cycles
- 2024: R+23.1 2020: R+19.6 2016: R+22.6 2012: R+24.0 2008: R+20.7
Not yet ingested
- Civics
- —
Market trends
- HPI YoY
- ▼ -180.64%
- Current HPI
- 168.8806
- Rent YoY
- —
- Metro
- —
- State GDP YoY
- ▲ 4.54%
- F500 in state
- 20
Industry mix (Fortune 500 HQ in AZ)
| Industry | F500 HQs | Revenue |
|---|---|---|
| Technology | 2 | $13B |
|
||
| Mining / Metals | 1 | $23B |
|
||
| Environmental Services | 1 | $16B |
|
||
| Metals / Steel | 1 | $14B |
|
||
| Technology Distribution | 1 | $9B |
|
||
| Homebuilding | 1 | $8B |
|
||
Price history
-20.0% since first listed3 events — show timeline
- 2026-05-11 Price Changed $20,000 ARMLS
- 2026-03-23 Price Changed $23,500 ARMLS
- 2026-02-02 Listed $25,000 ARMLS
Cash-flow waterfall
monthlySold comps — $/sqft
last 12 mo · ≤1 miLoading sold comps…