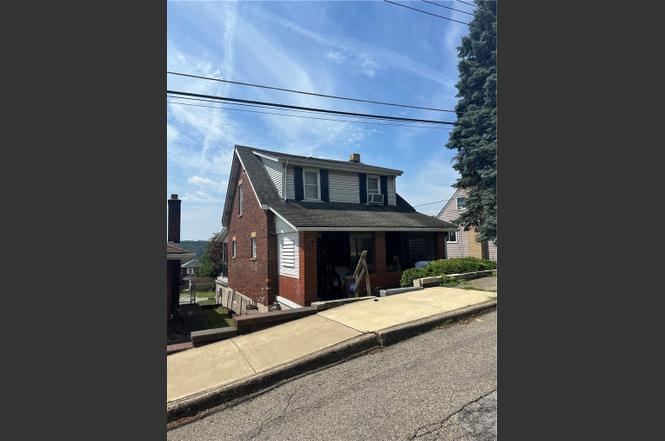
1634 Beech Ave · Turtle Creek, PA
Flood risk 1/10 · Minimal
- FEMA flood zone
- X (unshaded)
- Chance of flooding over 30 yrs
- 0.0%
- Est. flood insurance / yr
- $473 – $860
Fire risk 1/10 · Minimal
- Est. fire insurance / yr
- $511 – $949
Heat risk 4/10 · Minor
- Hot days now (above 97°F)
- 7 days/yr
- Hot days in 30 yrs
- 18 days/yr
Wind risk 2/10 · Minimal
- Chance of severe wind over 30 yrs
- 0.0%
Air-quality risk 4/10 · Minor
- Unhealthy air days now
- 5 days/yr
- Unhealthy air days in 30 yrs
- 7 days/yr
Risk factors via First Street. Map © Google.
Why this score? — see what drove the B+ grade
The composite is a weighted blend of 9 inputs, each scored 0–100. Each bar is that input's sub-score; the figure is the points it added to the 100-point composite (weight × sub-score).
- Cash flow +30.0/30.0
- ARV discount +15.0/15.0
- 1% rule +10.0/10.0
- DSCR +10.0/10.0
- Livability +3.5/5.0
- Rent growth +2.5/5.0
- Condition / age +2.5/5.0
- Schools +1.8/10.0
- Appreciation +0.0/10.0
$70,000
🖨 Deal sheet 📄 Offer letter ✓ Due diligence
Listing remarks MLS
Great 2-story, 2 Bedroom home in the heart of Turtle Creek. Property is situated on a double lot with a finished basement, 1 car attached garage and additional off street parking. Property is a great starter home or a great investment property as well.
Key facts
- 2,500 sq ft lot
- Garage
- Built 1942
Neighborhood map
What this means for you Summary
Snapshot
- This is a 2-bed/1.5-bath single-family listed at $70k.
Deal economics
- At list price, monthly cash flow is $378 ($5k/yr) — positive.
- The deal already cash-flows at list — no discount required.
- Meets the 1% rule at list price ($1k rent vs $70k).
Location & tenants
- Location reads 69/100 on livability (#807 in PA) — a middle-class / working-renter tenant base. Strengths: crime A+, cost of living A+, housing B; Watch: health & safety D+, amenities F, commute F.
- Woodland Hills SD (suburban): math 13% / reading 30% proficiency, ranked #486 of 539 in PA (top 90%) — low school quality limits family demand, transient renter base, plan for 1-2y turnover; 69% free/reduced lunch — lower-income household profile, screen leases tightly.
- Market conditions: 28 active listings in the ZIP; 20 comparable units currently listed for rent nearby; rentals at typical pace (median 24d on market — plan ~3-4 weeks tenant-placement turnaround); 40% of comp listings sitting > 30 days — soft ceiling on asking rent; 2,996 units permitted in Allegheny County in 2024 (1,588 in 5+ unit buildings).
Forward outlook
- Local home prices are declining (-3.0%/yr); year-one equity from $484 of loan paydown is wiped out by about $2k of value loss. Plan a longer hold.
- At projected returns (-3.0% appreciation + 3.0% rent growth), your $20k cash investment doubles in ~6 years — after that, you're playing with house money.
Negotiation context
- Only 9 days on market — expect competitive offers; lowballing is unlikely to land.
- 6 sale attempts since 16y ago with the ask held roughly flat each time — persistent listings suggest the price (not the market) is what's stuck; bring a comps-based counter.
- Current owner paid $21k; list at $70k implies a 241% gain — meaningful room to come down on a strong offer.
Risks & watch-outs
- Watch-outs: property tax is 3.2% of price; built in 1942 — expect roof / HVAC / electrical / plumbing capex.
Questions for the listing agent
- Built in 1942 — when were the roof, HVAC, electrical panel, plumbing, and water heater last replaced?
- Property tax is high relative to price — has the assessment been appealed recently, and will the sale trigger a re-assessment?
- Is there a deadline driving the sale (1031 exchange, divorce, estate, relocation)? That informs how much negotiation room exists.
- What's the average days-on-market for RENTAL listings here right now (not sales)? A rising rental-DOM trend means longer vacancies and softer asking-rent achievability than the comps imply.
- What's the recent tenant-quality profile in this submarket — average credit score on applications, eviction rate, late-payment / NSF rate, and stable-employment percentage? A property-management company in the area should have these aggregated.
- How much new for-sale + rental construction is in the pipeline within 1–3 miles? Heavy new supply typically softens prices + rents 12–24 months out; constrained supply supports both.
Investment metrics
- 1% rule
- 1.73% ✓
- Cap rate
- 12.76%
- Cash-on-cash
- 23.11%
- DSCR
- 2.03
- GRM
- 4.8
CMA / ARV
- ARV (on-the-fly)
- $115,440
- Comps found
- 10
Show comp detail 10 sales within ~0.75 mi
| Address | Dist | Beds/Ba | Sqft | Sold | Price | $/sf | Match |
|---|---|---|---|---|---|---|---|
| 924 James St | 0.22mi | 3/1.5 (+1) | 1,103 (+6%) | 0mo | $115,000 | $104 | 74 |
| 505 Bellwood Ave | 0.55mi | 2/1.0 | 1,058 (+2%) | 15mo | $132,000 | $125 | 57 |
| 1979 Gregory Dr | 0.25mi | 3/2.0 (+1) | 1,100 (+6%) | 21mo | $208,000 | $189 | 54 |
| 508 Bellwood Ave | 0.57mi | 3/2.0 (+1) | 1,110 (+7%) | 7mo | $190,000 | $171 | 49 |
| 124 8th St | 0.62mi | 2/1.0 | 1,024 (-2%) | 21mo | $61,500 | $60 | 49 |
| 1216 Center St | 0.39mi | 3/1.0 (+1) | 1,144 (+10%) | 12mo | $116,000 | $101 | 48 |
| 422 James | 0.27mi | 3/1.0 (+1) | 1,136 (+9%) | 22mo | $122,500 | $108 | 46 |
| 125 8th St | 0.63mi | 2/1.0 | 988 (-5%) | 24mo | $110,000 | $111 | 40 |
| 737 Patton Street Ext | 0.68mi | 3/1.5 (+1) | 1,134 (+9%) | 11mo | $175,000 | $154 | 39 |
| 530 Maine St | 0.69mi | 3/1.0 (+1) | 1,175 (+13%) | 7mo | $56,000 | $48 | 34 |
Match score weights: distance 35% · size 25% · config 20% · recency 20%. Top-matched comps best support the ARV.
Projected returns pro-forma
-3.0% appreciation · 3.0% rent growth · sell at horizon
- IRR
- 16.2%
- Equity multiple
- 1.65×
- Total profit
- $12,779
- Equity at exit
- $10,437
- IRR
- 24.8%
- Equity multiple
- 3.16×
- Total profit
- $42,405
- Equity at exit
- $6,052
Cash invested: $19,600 (down + closing). Projections, not guarantees.
Landlord ↔ Tenant lean methodology
- Overall (STATE)
- 62 Landlord-Friendly
- State Pennsylvania
- 62 Landlord-Friendly · EVEN
- County
- — inherits STATE
- City
- — inherits STATE
ZIP-level market 15145
- Home prices YoY
- -31.2%
- Active inventory
- 28
- Price-to-rent
- 4.8×
Monthly cashflow live
- Estimated rent
- $1,213 high interval (Pro) →
- Mortgage (P&I)
- −$367
- Tax from tax record
- −$185 /mo · $2,217/yr
- Insurance
- −$29
- HOA
- −$0
- Vacancy / Maint / Mgmt
- −$255
- Net cashflow
- $378
Break-even live
UW: 25.0% down · 7.5% · 30yr · 1.5% tax · 5.0% vac · 8.0% maint · 8.0% mgmt
Financing live
Cash to close
- Down payment
- $17,500
- Closing costs
- $2,100
- Reserves months
- —
- Total cash needed
- —
Loan-product check · same deal, 3 products live
Conventional
25% down · 7.5% · 30yr
- Down + closing
- —
- Monthly P&I
- —
- Monthly cashflow
- —
- DSCR
- —
- Eligible?
- —
Personal DTI + credit; lowest rate.
DSCR
20% down · 8.5% · 30yr
- Down + closing
- —
- Monthly P&I
- —
- Monthly cashflow
- —
- DSCR
- —
- Eligible?
- —
No personal income docs; deal must DSCR.
Hard money
10% down · 12.0% · 12mo
- Down + closing
- —
- Monthly P&I
- —
- Monthly cashflow
- —
- DSCR
- —
- Eligible?
- —
Short-term bridge; refi at stabilization.
Rent comps 20 comps
| Address | Beds | Baths | Sqft | Rent | $/sqft | DOM | Units | Dist |
|---|---|---|---|---|---|---|---|---|
| 622 Mercer St Unit B Turtle Creek, PA | 1.0 | 1.0 | 725 | $1,300 | $1.79 | 7d | 1 | 0.14mi |
| 1615 Lynn Ave Unit 2 Turtle Creek, PA | 2.0 | 1.0 | 1100 | $1,145 | $1.04 | 43d | 1 | 0.25mi |
| 342 Kenyon St Turtle Creek, PA | 1.0–2.0 | 1.0 | 850 | $1,155 | $1.36 | 14d | 6 | 0.46mi |
| 918 Oak Ave Turtle Creek, PA | 1.0 | 1.0 | 750 | $1,100 | $1.47 | 23d | 1 | 0.52mi |
| 221 Grant St Unit 221-B Turtle Creek, PA | 2.0 | 1.0 | 756 | $775 | $1.03 | 43d | 1 | 0.66mi |
| 906 Penn Ave Unit B Turtle Creek, PA | 3.0 | 1.0 | 820 | $1,250 | $1.52 | 23d | 1 | 0.76mi |
| 906 Penn Ave Unit D Turtle Creek, PA | 3.0 | 2.0 | 1277 | $1,400 | $1.10 | 43d | 1 | 0.76mi |
| 906 Penn Ave Unit B Turtle Creek, PA | 3.0 | 1.0 | 820 | $1,250 | $1.52 | 43d | 1 | 0.76mi |
| 906 Penn Ave Unit A Turtle Creek, PA | 2.0 | 2.0 | 1122 | $1,250 | $1.11 | 43d | 1 | 0.76mi |
| 505 Washington St Turtle Creek, PA | 2.0 | 1.0 | 1064 | $1,200 | $1.13 | 43d | 1 | 0.92mi |
| 173 Churchill Rd Turtle Creek, PA | 1.0–2.0 | 1.0 | 820 | $1,175 | $1.43 | 17d | 2 | 0.92mi |
| 400 Greensburg Pike North Versailles, PA | 3.0 | 1.0 | 1324 | $1,250 | $0.94 | 43d | 1 | 0.93mi |
| 1100 Penn Center Blvd Pittsburgh, PA | 2.0 | 1.0–2.0 | 1203 | $2,199 | $1.83 | 1d | 17 | 0.96mi |
| 165 State St Wilmerding, PA | 3.0 | 1.0 | 1100 | $995 | $0.90 | 17d | 1 | 1.15mi |
| 210 Westinghouse Ave Unit 210-E Wilmerding, PA | 2.0 | 1.0 | 800 | $999 | $1.25 | 14d | 1 | 1.31mi |
| 210 Westinghouse Ave Unit 210-D Wilmerding, PA | 2.0 | 1.0 | 800 | $999 | $1.25 | 43d | 1 | 1.31mi |
| 610 Brown Ave Turtle Creek, PA | 3.0 | 1.0 | 1268 | $1,499 | $1.18 | 4d | 1 | 1.34mi |
| 810 Wood St Unit 1 East Pittsburgh, PA | 1.0 | 1.0 | 1000 | $1,200 | $1.20 | 7d | 1 | 1.34mi |
| 219 North Ave Unit 1 East Pittsburgh, PA | 2.0 | 1.0 | 850 | $900 | $1.06 | 2d | 1 | 1.43mi |
| 207 Kingston Dr Pittsburgh, PA | 3.0 | 1.5 | 1020 | $1,495 | $1.47 | 14d | 1 | 1.49mi |
Listing history 14 events
-
2026-02-05status Pending
-
2026-01-27$70,000 Active
-
2025-12-31historical Expired 252-char remark
Show marketing remark (252 chars)
Great 2-story, 2 Bedroom home in the heart of Turtle Creek. Property is situated on a double lot with a finished basement, 1 car attached garage and additional off street parking. Property is a great starter home or a great investment property as well.
-
2025-07-12$70,000 Active 252-char remark
Show marketing remark (252 chars)
Great 2-story, 2 Bedroom home in the heart of Turtle Creek. Property is situated on a double lot with a finished basement, 1 car attached garage and additional off street parking. Property is a great starter home or a great investment property as well.
-
2025-03-25status Active 213-char remark
Show marketing remark (213 chars)
Single Family residence located on a double lot in Turtle Creek. Property located near Route 30 and minutes from Downtown Pittsburgh. Property being sold in a larger portfolio but could be sold separately as well.
-
2024-12-31historical Expired 213-char remark
Show marketing remark (213 chars)
Single Family residence located on a double lot in Turtle Creek. Property located near Route 30 and minutes from Downtown Pittsburgh. Property being sold in a larger portfolio but could be sold separately as well.
-
2024-11-23status Pending 213-char remark
Show marketing remark (213 chars)
Single Family residence located on a double lot in Turtle Creek. Property located near Route 30 and minutes from Downtown Pittsburgh. Property being sold in a larger portfolio but could be sold separately as well.
-
2024-09-16$70,000 Active 213-char remark
Show marketing remark (213 chars)
Single Family residence located on a double lot in Turtle Creek. Property located near Route 30 and minutes from Downtown Pittsburgh. Property being sold in a larger portfolio but could be sold separately as well.
-
2012-03-30soldstatus $20,551
-
2012-03-30price $28,000
-
2012-01-31$20,551
-
2010-04-06$36,000
-
2007-12-05soldstatus $41,200
-
2007-10-04soldstatus $25,000
ⓘ Source: listings_history table (triggers on properties + properties_extension) + one-shot
backfill from property_details.listing_events for pre-trigger history.
Tax reassessment forecast PA · Partial reset (capped growth)
- Current annual tax
- $2,217 · $185/mo
- Projected year-2 tax
- $2,217 · $185/mo
- Expected delta
- $0/yr ($0/mo · 0.0%)
ⓘ Screening estimate from a state-policy table — verify with the county assessor before closing.
Climate risk First Street
- Flood 1/10 Low FEMA zone X (unshaded) · 0% chance over 30 yrs
- Wildfire 1/10 Low
- Heat 4/10 Moderate 7 d/yr ≥97°F today · 18 d/yr by 30 yrs out
- Wind 2/10 Low 0% chance of damaging wind over 30 yrs
- Air quality 4/10 Moderate 5 unhealthy d/yr today · 7 by 30 yrs out
Nearby sold comps map
Loading sold comps map…
Walkable amenities ~0.75 mi
Loading nearby amenities…
Taxation est. · year 1
- Rental income
- $14,560
- − Mortgage interest
- −$3,921
- − Property taxes
- −$2,217
- − Insurance
- −$350
- − Repairs & maintenance
- −$1,165
- − Management
- −$1,165
- − Depreciation
- −$2,036
- Taxable income
- $3,706
- Est. tax owed @ 24.0%
- −$889
- After-tax cash flow
- $3,641/yr
For passive investors: Depreciation is non-cash, so a rental often shows a tax loss while cash-flowing — sheltering income. Rental losses are passive: they offset passive income freely, and up to $25,000/yr can offset ordinary (W-2) income if you actively participate and your MAGI is under $100k (phasing out to $0 by $150k); unused losses carry forward. On sale, claimed depreciation is recaptured at up to 25%, and gains may owe capital-gains tax (a 1031 exchange can defer both). Figures are a year-1 estimate at your 24.0% rate — not tax advice; consult a CPA.
Schools (NCES district)
- District
- Woodland Hills SD
- NCES district ID
- 4216500
- Math proficiency
- 13% ▼ -13.00%
- Reading proficiency
- 30% ▼ -10.00%
- Median HH income
- $41,803
- Composite
- 18.31/100
- National rank
- #8954
- State rank
- #486 of 539 in PA
Livability — Turtle Creek
- Score
- 69/100
- State rank
- #807
- US rank
- #8228
Category grades
Schools grade is shown separately in the Schools card above.
Census & demographics
- Census place
- Turtle Creek, PA
- County
- Allegheny County · 1,022,028 people
- City population
- 6,695
- Metro
- Pittsburgh, PA
- Population (ZIP)
- 6,695
- Household income
- $49,628
- Rent vs Own
- Severe rent burden
- 344.0
Population outlook (Allegheny County) Hauer SSP2
- Today (2025)
- 1,250,282 people
- By 2030
- 1,256,482 · +0.5%
- By 2040
- 1,256,318 · +0.5%
- By 2050
- 1,244,169 · -0.5%
- By 2075
- 1,197,693 · -4.2%
- By 2100
- 1,093,187 · -12.6%
Race, ethnicity, and origin ACS 2023
- Neighborhood character
- Majority White (64%)
- Race & ethnicity
- White 64% Black 22% Two or more races 11% Asian 2%
- Common ancestry
- Romanian 6% Slovene 1% Scotch-Irish 1%
- Foreign-born
- 2% · Canada
- Languages at home
- 96% English-only · Spanish 2% German/W. Germanic 1%
Political lean MEDSL · Allegheny
- 2024 margin
- Strong D (+20.3) · D 59.7% · R 39.4%
- 2008→2024 swing
- +4.8pp toward D · 2008: 15.5pp · 2024: 20.3pp
- All cycles
- 2024: D+20.3 2020: D+20.4 2016: D+16.4 2012: D+14.4 2008: D+15.5
Not yet ingested
- Civics
- —
Market trends
- HPI YoY
- ▼ -73.67%
- Current HPI
- 162.0452
- Rent YoY
- —
- Metro
- Pittsburgh, PA
- State GDP YoY
- ▲ 1.68%
- F500 in state
- 34
Industry mix (Fortune 500 HQ in PA)
| Industry | F500 HQs | Revenue |
|---|---|---|
| Healthcare | 2 | $309B |
|
||
| Insurance | 2 | $27B |
|
||
| Telecommunications / Media | 1 | $124B |
|
||
| Industrial Distribution | 1 | $22B |
|
||
| Financial Services | 1 | $20B |
|
||
| Chemicals / Materials | 1 | $18B |
|
||
Price history
+180.0% since first listed14 events — show timeline
- 2026-02-05 Pending — West Penn MLS
- 2026-01-27 Listed $70,000 West Penn MLS
- 2025-12-31 Delisted — West Penn MLS
- 2025-07-12 Listed $70,000 West Penn MLS
- 2025-03-25 Relisted — West Penn MLS
- 2024-12-31 Delisted — West Penn MLS
- 2024-11-23 Pending — West Penn MLS
- 2024-09-16 Listed $70,000 West Penn MLS
- 2012-03-30 Price Changed $28,000 West Penn MLS
- 2012-03-30 Sold (MLS) $20,551 West Penn MLS
- 2012-01-31 Listed $20,551 West Penn MLS
- 2010-04-06 Listed $36,000 West Penn MLS
- 2007-12-05 Sold (Public Records) $41,200 Public Records
- 2007-10-04 Sold (Public Records) $25,000 Public Records
Property tax history
+2.1%/yrLatest (2026): $2,217 · +3.1% YoY. Source: county tax records.
Cash-flow waterfall
monthlySold comps — $/sqft
last 12 mo · ≤1 miLoading sold comps…