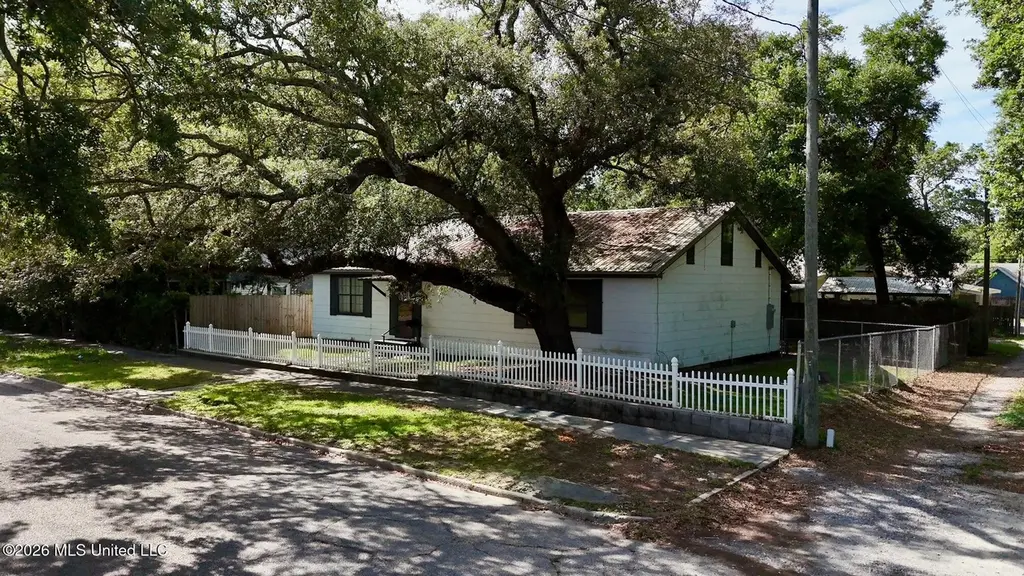
3214 14th St · Gulfport, MS
Flood risk 1/10 · Minimal
- FEMA flood zone
- X (unshaded)
- Chance of flooding over 30 yrs
- 0.0%
- Est. flood insurance / yr
- $507 – $1,088
Fire risk 1/10 · Minimal
- Est. fire insurance / yr
- $1,241 – $2,305
Heat risk 10/10 · Severe
- Hot days now (above 106°F)
- 7 days/yr
- Hot days in 30 yrs
- 23 days/yr
Wind risk 9/10 · Severe
- Chance of severe wind over 30 yrs
- 99.0%
Air-quality risk 1/10 · Minimal
- Unhealthy air days now
- 0 days/yr
- Unhealthy air days in 30 yrs
- 0 days/yr
Risk factors via First Street. Map © Google.
Why this score? — see what drove the D- grade
The composite is a weighted blend of 9 inputs, each scored 0–100. Each bar is that input's sub-score; the figure is the points it added to the 100-point composite (weight × sub-score).
- Cash flow +14.3/30.0
- Rent growth +5.0/5.0
- DSCR +4.3/10.0
- Livability +3.7/5.0
- Schools +3.4/10.0
- 1% rule +3.1/10.0
- Condition / age +2.5/5.0
- ARV discount +0.0/15.0
- Appreciation +0.0/10.0
$179,900
🖨 Deal sheet (PDF) 📄 Offer letter ✓ Due diligence
Listing remarks
Just 4 blocks from the beach, this charming cottage is full of potential and is ready for its next chapter! Features include: 4 bedrooms/1.5 baths, fenced yard, detached shed/workshop, and carport. With a prime location near the beach, dining and local attractions, this property has endless possibilities to make it your own! Whether you are looking for a primary residence, a vacation getaway, an investment property or renovation project, this fixer-upper offers a rare opportunity to create something special, Being sold as-is. Don't wait!
Key facts
- Fenced yard
- Prime location
- Detached shed
Tags
Property features AI
Finance
- HOA & community: Community features: boating, fishing, near entertainment, restaurants
Exterior
- Parking: Carport (1 space); Gravel parking
- Utilities: Public water; Public sewer; Electricity connected; Cable connected; Sewer connected; Water connected
- Home design: Single-family residence; One and one-half story; Fixer condition
- Construction: Asbestos siding; Siding construction; Metal roof; Chainwall foundation; Built (year per public records)
- Exterior features: Private yard; Full fenced yard with gate; Shed(s)
Interior
- Kitchen: Dishwasher; Free-standing refrigerator; Oven
- Flooring: Carpet; Concrete; Vinyl
- Bathrooms: 1 full bathroom; 1 half bathroom (1.5 total)
- Heating & cooling: Central heating (natural gas); Central air conditioning; Ceiling fans; Electric cooling
- Interior features: Dishwasher; Free-standing refrigerator; Oven; Washer and dryer included; In-kitchen laundry; Carpet flooring; Concrete flooring; Vinyl flooring
- Laundry & utility: Washer and dryer included; Laundry located in the kitchen
Neighborhood map
What this means for you Summary
Snapshot
- This is a 4-bed/1.5-bath single-family listed at $180k.
Deal economics
- At list price, monthly cash flow is $32 ($385/yr) — positive.
- The deal already cash-flows at list — no discount required.
- To meet the 1% rule (rent ≥ 1% of price), the offer needs to be $146k (18.6% below list).
- Recommended offer: $146k (18.6% below list) — sets the bar for 1% rule.
- Cap rate 6.5% vs local median 4.9% in Gulfport — top-decile yield for the area; either an underpriced asset or a hidden risk that comps aren't pricing in. Stress-test before assuming the spread holds.
Location & tenants
- Location reads 73/100 on livability (#15 in MS) — a middle-class / working-renter tenant base. Strengths: cost of living A+, housing A+, health & safety A+; Watch: amenities F, commute F, employment F.
- Gulfport School District (urban): math 41% / reading 42% proficiency, ranked #37 of 130 in MS (top 28%) — families likely to look elsewhere, expect single-tenant / working-renter base with shorter leases; 67% free/reduced lunch — lower-income household profile, screen leases tightly.
- Zoned schools: West Elementary School (math 24% / reading 33%, grade F, #195 of 375 statewide, top 52%, 523 students, 100% FRL); Gulfport Central Middle School (math 20% / reading 23%, grade F, #109 of 179 statewide, top 62%, 585 students, 100% FRL); Gulfport High School (math 42% / reading 36%, grade F, #54 of 197 statewide, top 28%, 1,728 students, 100% FRL) — zoned schools average 100% FRL vs 67% district-wide (33 pts higher); higher-poverty schools than district average — tighter screening recommended.
- Market conditions: Rents rising fast (+10.5%/yr); 254 active listings in the ZIP; 8 comparable units currently listed for rent nearby; rentals at typical pace (median 16d on market — plan ~3-4 weeks tenant-placement turnaround); lower-income renter base — watch delinquency; 2,194 units permitted in Harrison County in 2024 (0 in 5+ unit buildings).
- At $1,464/mo this rent would consume 51% of the median local household income ($35k/yr) (locally 1516% of renters already pay >50% of income on rent) — very limited rent-growth headroom before tenants either downsize or default.
Forward outlook
- Local home prices are declining (-3.0%/yr); year-one equity from $1k of loan paydown is wiped out by about $5k of value loss. Plan a longer hold.
- Harrison County population projected at +27% by 2050 — long-run rental-demand tailwind backs the buy-and-hold thesis.
Negotiation context
- It's been on market 15 days — a 2% lower offer ($177k) is reasonable based on typical stale-listing flexibility.
Risks & watch-outs
- Watch-outs: built in 1950 — expect roof / HVAC / electrical / plumbing capex.
- Climate carrying-cost: severe wind risk, 99% chance of damaging wind over 30y; extreme-heat days projected 7→23/yr by 2055 (HVAC capex compounding) — expect insurance premiums to compound above CPI over the hold.
Questions for the listing agent
- Built in 1950 — when were the roof, HVAC, electrical panel, plumbing, and water heater last replaced?
- Is there a deadline driving the sale (1031 exchange, divorce, estate, relocation)? That informs how much negotiation room exists.
- Schools are D-rated, which usually means shorter tenancies and higher turnover. Who's the typical renter profile here, and what's been the actual vacancy rate?
- The area grade is low — what's the realistic commute time and amenity access for the typical tenant pool here? Any planned neighborhood developments (good or bad) we should know about?
- What's the average days-on-market for RENTAL listings here right now (not sales)? A rising rental-DOM trend means longer vacancies and softer asking-rent achievability than the comps imply.
- What's the recent tenant-quality profile in this submarket — average credit score on applications, eviction rate, late-payment / NSF rate, and stable-employment percentage? A property-management company in the area should have these aggregated.
- How much new for-sale + rental construction is in the pipeline within 1–3 miles? Heavy new supply typically softens prices + rents 12–24 months out; constrained supply supports both.
Investment metrics
- 1% rule
- 0.81% ✗
- Cap rate
- 6.51%
- Cash-on-cash
- 0.76%
- DSCR
- 1.03
- GRM
- 10.2
CMA / ARV
- ARV (on-the-fly)
- $126,225
- Comps found
- 12
Show comp detail 12 sales within ~0.75 mi
| Address | Dist | Beds/Ba | Sqft | Sold | Price | $/sf | Match |
|---|---|---|---|---|---|---|---|
| 1611 Eastward Dr | 0.21mi | 3/2.0 (-1) | 1,700 (+1%) | 2mo | $59,500 | $35 | 80 |
| 1710 Eastward Dr | 0.26mi | 5/2.0 (+1) | 1,655 (-2%) | 11mo | $84,000 | $51 | 69 |
| 817 39th Ave | 0.59mi | 4/2.0 | 1,697 (+1%) | 2mo | $230,000 | $136 | 67 |
| 3321 14th St | 0.08mi | 3/2.0 (-1) | 1,773 (+5%) | 19mo | $225,000 | $127 | 64 |
| 3811 16th St | 0.43mi | 3/2.0 (-1) | 1,717 (+2%) | 11mo | $125,000 | $73 | 60 |
| 1225 32nd Ave | 0.10mi | 3/2.0 (-1) | 1,500 (-11%) | 12mo | $275,000 | $183 | 60 |
| 3621 Southward Dr | 0.31mi | 4/2.0 | 1,827 (+9%) | 13mo | $73,000 | $40 | 58 |
| 1715 Terrace Dr | 0.47mi | 4/2.0 | 1,546 (-8%) | 8mo | $143,900 | $93 | 56 |
| 2002 35th Ave | 0.48mi | 3/2.5 (-1) | 1,591 (-6%) | 7mo | $99,000 | $62 | 54 |
| 3901 16th St | 0.49mi | 3/2.0 (-1) | 1,746 (+4%) | 15mo | $60,000 | $34 | 52 |
| 2113 30th Ave | 0.56mi | 3/1.0 (-1) | 1,539 (-9%) | 8mo | $115,000 | $75 | 46 |
| 1313 42nd Ave | 0.64mi | 3/2.0 (-1) | 1,433 (-15%) | 18mo | $120,000 | $84 | 23 |
Match score weights: distance 35% · size 25% · config 20% · recency 20%. Top-matched comps best support the ARV.
Projected returns pro-forma
-3.0% appreciation · 8.0% rent growth · sell at horizon
- IRR
- -10.1%
- Equity multiple
- 0.61×
- Total profit
- $-19,424
- Equity at exit
- $26,824
- IRR
- 4.7%
- Equity multiple
- 1.41×
- Total profit
- $20,718
- Equity at exit
- $15,554
Cash invested: $50,372 (down + closing). Projections, not guarantees.
Landlord ↔ Tenant lean methodology
- Overall (STATE)
- 90 Strongly Landlord-Friendly
- State Mississippi
- 90 Strongly Landlord-Friendly · R+11
- County
- — inherits STATE
- City
- — inherits STATE
ZIP-level market 39501
- Home prices YoY
- -34.5%
- Rents YoY
- 10.5%
- Active inventory
- 254
- Price-to-rent
- 10.2×
Monthly cashflow live
- Estimated rent
- $1,464 high interval (Pro) →
- Mortgage (P&I)
- −$943
- Tax from tax record
- −$106 /mo · $1,272/yr
- Insurance
- −$75
- HOA
- −$0
- Vacancy / Maint / Mgmt
- −$307
- Net cashflow
- $32
Break-even live
Sensitivity live
| Price | -10% $134 | -5% $83 | +0% $32 | +5% $-19 | +10% $-70 |
|---|---|---|---|---|---|
| Rent | -10% $-84 | -5% $-26 | +0% $32 | +5% $90 | +10% $148 |
| Rate | -1.0pp $123 | -0.5pp $78 | base $32 | +0.5pp $-15 | +1.0pp $-62 |
UW: 25.0% down · 7.5% · 30yr · 1.5% tax · 5.0% vac · 8.0% maint · 8.0% mgmt
Financing live
Cash to close
- Down payment
- $44,975
- Closing costs
- $5,397
- Reserves months
- —
- Total cash needed
- —
Loan-product check · same deal, 3 products live
Conventional
25% down · 7.5% · 30yr
- Down + closing
- —
- Monthly P&I
- —
- Monthly cashflow
- —
- DSCR
- —
- Eligible?
- —
Personal DTI + credit; lowest rate.
DSCR
20% down · 8.5% · 30yr
- Down + closing
- —
- Monthly P&I
- —
- Monthly cashflow
- —
- DSCR
- —
- Eligible?
- —
No personal income docs; deal must DSCR.
Hard money
10% down · 12.0% · 12mo
- Down + closing
- —
- Monthly P&I
- —
- Monthly cashflow
- —
- DSCR
- —
- Eligible?
- —
Short-term bridge; refi at stabilization.
Rent comps 8 comps
| Address | Beds | Baths | Sqft | Rent | $/sqft | DOM | Units | Dist |
|---|---|---|---|---|---|---|---|---|
| 1106 32nd Ave Gulfport, MS | 3.0 | 2.0 | 1200 | $1,300 | $1.08 | 45d | 1 | 0.19mi |
| 2068 W Beach Blvd Biloxi, MS | 1.0–3.0 | 1.0–2.0 | 998 | $1,700 | $1.70 | 15d | 1 | 0.48mi |
| 2113 33rd Ave Gulfport, MS | 5.0 | 2.0 | 1531 | $1,300 | $0.85 | 46d | 1 | 0.57mi |
| 4319 Lewis St Gulfport, MS | 3.0 | 2.0 | 1371 | $1,649 | $1.20 | 15d | 1 | 0.95mi |
| 1129 Woodward Ave Gulfport, MS | 3.0 | 1.0 | 1719 | $1,300 | $0.76 | 15d | 1 | 1.11mi |
| 1605 20th St Gulfport, MS | 3.0 | 3.0 | 1350 | $1,095 | $0.81 | 45d | 1 | 1.33mi |
| 1412 Jo Ellen Cir Gulfport, MS | 3.0 | 1.5 | 1275 | $1,050 | $0.82 | 15d | 1 | 1.42mi |
| 1206 Beach Ave Gulfport, MS | 3.0 | 2.0 | 1076 | $1,500 | $1.39 | 15d | 1 | 1.43mi |
Listing history 12 events
-
2026-06-22days on market $179,900 Active 15 DOM
-
2026-06-18days on market $179,900 Active 12 DOM
-
2026-06-17days on market $179,900 Active 11 DOM
-
2026-06-16days on market $179,900 Active 10 DOM
-
2026-06-15days on market $179,900 Active 9 DOM
-
2026-06-14days on market $179,900 Active 7 DOM
-
2026-06-13days on market $179,900 Active 6 DOM
-
2026-06-10days on market $179,900 Active 4 DOM
-
2026-06-09days on market $179,900 Active 3 DOM
-
2026-06-08days on market $179,900 Active 2 DOM
-
2026-06-07remarks 548-char remark
-
2026-06-07$179,900 Active 1 DOM
ⓘ Source: listings_history table (triggers on properties + properties_extension) + one-shot
backfill from property_details.listing_events for pre-trigger history.
Tax reassessment forecast MS · Resets to sale price
- Current annual tax
- $1,272 · $106/mo
- Projected year-2 tax
- $1,421 · $118/mo
- Expected delta
- +$149/yr (+$12/mo · 11.7%)
ⓘ Screening estimate from a state-policy table — verify with the county assessor before closing.
Climate risk First Street
- Flood 1/10 Low FEMA zone X (unshaded) · 0% chance over 30 yrs
- Wildfire 1/10 Low
- Heat 10/10 Extreme 7 d/yr ≥106°F today · 23 d/yr by 30 yrs out
- Wind 9/10 Extreme 99% chance of damaging wind over 30 yrs
- Air quality 1/10 Low 0 unhealthy d/yr today · 0 by 30 yrs out
Nearby sold comps map
Loading sold comps map…
Walkable amenities ~0.75 mi
Loading nearby amenities…
Taxation est. · year 1
- Rental income
- $17,566
- − Mortgage interest
- −$10,077
- − Property taxes
- −$1,272
- − Insurance
- −$900
- − Repairs & maintenance
- −$1,405
- − Management
- −$1,405
- − Depreciation
- −$5,233
- Taxable loss
- −$2,727
- Est. tax savings @ 24.0%
- +$654
- After-tax cash flow
- $1,039/yr
For passive investors: Depreciation is non-cash, so a rental often shows a tax loss while cash-flowing — sheltering income. Rental losses are passive: they offset passive income freely, and up to $25,000/yr can offset ordinary (W-2) income if you actively participate and your MAGI is under $100k (phasing out to $0 by $150k); unused losses carry forward. On sale, claimed depreciation is recaptured at up to 25%, and gains may owe capital-gains tax (a 1031 exchange can defer both). Figures are a year-1 estimate at your 24.0% rate — not tax advice; consult a CPA.
Schools (NCES district)
- District
- Gulfport School District
- NCES district ID
- 2801710
- Math proficiency
- 41% ▼ -15.00%
- Reading proficiency
- 42% ▼ -6.00%
- Median HH income
- $35,712
- Composite
- 34.38/100
- National rank
- #5213
- State rank
- #37 of 130 in MS
Livability — Gulfport
- Score
- 73/100
- State rank
- #15
- US rank
- #5010
Category grades
Schools grade is shown separately in the Schools card above.
Census & demographics
- Census place
- Gulfport, MS
- County
- Harrison County · 178,171 people
- City population
- 96,188
- Metro
- Gulfport-Biloxi, MS
- Population (ZIP)
- 22,565
- Household income
- $34,758
- Rent vs Own
- Severe rent burden
- 1516.0
Population outlook (Harrison County) Hauer SSP2
- Today (2025)
- 228,444 people
- By 2030
- 241,942 · +5.9%
- By 2040
- 267,531 · +17.1%
- By 2050
- 291,062 · +27.4%
- By 2075
- 346,711 · +51.8%
- By 2100
- 378,165 · +65.5%
Race, ethnicity, and origin ACS 2023
- Neighborhood character
- Diverse neighborhood (Simpson 0.56)
- Race & ethnicity
- Black 59% White 29% Two or more races 7% Hispanic / Latino 5%
- Hispanic origin (detail)
- Mexican 2%
- Common ancestry
- Lithuanian 2% Serbian 1% Slovak 1%
- Foreign-born
- 2% · Canada
- Languages at home
- 95% English-only · Spanish 4%
Political lean MEDSL · Harrison
- 2024 margin
- Strong R (+28.9) · D 35.0% · R 63.9% · Other 1.1%
- 2008→2024 swing
- -2.9pp toward R · 2008: -26.0pp · 2024: -28.9pp
- All cycles
- 2024: R+28.9 2020: R+25.2 2016: R+30.7 2012: R+26.6 2008: R+26.0
Not yet ingested
- Civics
- —
Market trends
- HPI YoY
- ▼ -110.16%
- Current HPI
- 208.998
- Rent YoY
- ▲ 10.49%
- Metro
- Gulfport-Biloxi, MS
- State GDP YoY
- —
- F500 in state
- 0
Price history
1 event — show timeline
- 2026-06-05 Listed $179,900 MLSU
Property tax history
+3.9%/yrLatest (2025): $1,272 · +3.9% YoY. Source: county tax records.
Cash-flow waterfall
monthlySold comps — $/sqft
last 12 mo · ≤1 miLoading sold comps…