6008 Moeller Rd #100 · New Haven, IN
Flood risk No data
- FEMA flood zone
- —
- Chance of flooding over 30 yrs
- —
- Est. flood insurance / yr
- —
Fire risk No data
- Est. fire insurance / yr
- —
Heat risk No data
- Hot days now (above threshold)
- —
- Hot days in 30 yrs
- —
Wind risk No data
- Chance of severe wind over 30 yrs
- —
Air-quality risk No data
- Unhealthy air days now
- —
- Unhealthy air days in 30 yrs
- —
Risk factors via First Street. Map © Google.
Why this score? — see what drove the D+ grade
The composite is a weighted blend of 9 inputs, each scored 0–100. Each bar is that input's sub-score; the figure is the points it added to the 100-point composite (weight × sub-score).
- Cash flow +15.0/30.0
- ARV discount +7.5/15.0
- 1% rule +5.0/10.0
- DSCR +5.0/10.0
- Rent growth +3.7/5.0
- Schools +3.6/10.0
- Livability +3.5/5.0
- Condition / age +2.2/5.0
- Appreciation +0.0/10.0
$36,300
🖨 Deal sheet 📄 Offer letter ✓ Due diligence
Key facts
- Built 2024
- Listed 124 days
Property features AI
Finance
- Other: Living area of 2016; Address: 6008 Moeller Rd #100, Fort Wayne, IN 46806; Listing status: Active; Last updated May 20, 2026
- Financial info: List price $35,800
Exterior
- Utilities: Central air
- Home design: Plan 93411; Single-family property (plan information provided)
- Construction: Built as part of new construction inventory
- Exterior features: Property listed as new construction (Spec)
Interior
- Bedrooms: 4 bedrooms
- Bathrooms: 2 bathrooms
- Heating & cooling: Central air conditioning
- Interior features: Central air conditioning
Neighborhood map
What this means for you Summary
Snapshot
- This is a 4-bed/2.0-bath manufactured listed at $36k. Condition is rated fair.
Deal economics
- At list price, monthly cash flow is $959 ($12k/yr) — positive.
- The deal already cash-flows at list — no discount required.
- Meets the 1% rule at list price ($2k rent vs $36k).
- Recommended offer: $32k (12.0% below list) — sets the bar for market timing.
- Cap rate 38.0% vs local median 4.9% in New Haven — top-decile yield for the area; either an underpriced asset or a hidden risk that comps aren't pricing in. Stress-test before assuming the spread holds.
Location & tenants
- Location reads 70/100 on livability (#149 in IN) — a middle-class / working-renter tenant base. Strengths: cost of living A+, housing A+, crime B+; Watch: schools D+, employment D, amenities F.
- East Allen County Schools (suburban): math 36% / reading 47% proficiency, ranked #122 of 301 in IN (top 40%) — families likely to look elsewhere, expect single-tenant / working-renter base with shorter leases.
- Market conditions: Rents rising fast (+4.9%/yr); 129 active listings in the ZIP; 1 comparable units currently listed for rent nearby; 1,861 units permitted in Allen County in 2024 (576 in 5+ unit buildings).
- This rent runs 38% of the median local income ($48k/yr) — at the standard rent-burdened threshold; future hikes will face affordability resistance.
Forward outlook
- Local home prices are declining (-3.0%/yr); year-one equity from $251 of loan paydown is wiped out by about $1k of value loss. Plan a longer hold.
- Allen County population projected at +10% by 2050 — modest demand growth; plan on rents tracking national, not racing it.
- At projected returns (-3.0% appreciation + 4.9% rent growth), your $10k cash investment doubles in ~1 year — after that, you're playing with house money.
Negotiation context
- It's been on market 124 days — a 12% lower offer ($32k) is reasonable based on typical stale-listing flexibility.
Questions for the listing agent
- It's been on market 124 days. Have you received any prior offers? Is the seller open to a 12% concession, seller financing, or rate buy-down credit?
- Have any recent inspections been done? Can we get a copy of the seller's disclosures and any deferred-maintenance estimates?
- Why hasn't it sold? Are there any deal-killer items the seller is aware of (foundation, flood, title, zoning, code violations)?
- Is there a deadline driving the sale (1031 exchange, divorce, estate, relocation)? That informs how much negotiation room exists.
- Schools are D-rated, which usually means shorter tenancies and higher turnover. Who's the typical renter profile here, and what's been the actual vacancy rate?
- The area grade is low — what's the realistic commute time and amenity access for the typical tenant pool here? Any planned neighborhood developments (good or bad) we should know about?
- What's the average days-on-market for RENTAL listings here right now (not sales)? A rising rental-DOM trend means longer vacancies and softer asking-rent achievability than the comps imply.
- What's the recent tenant-quality profile in this submarket — average credit score on applications, eviction rate, late-payment / NSF rate, and stable-employment percentage? A property-management company in the area should have these aggregated.
- How much new for-sale + rental construction is in the pipeline within 1–3 miles? Heavy new supply typically softens prices + rents 12–24 months out; constrained supply supports both.
Investment metrics
- 1% rule
- 4.22% ✓
- Cap rate
- 37.99%
- Cash-on-cash
- 113.19%
- DSCR
- 6.04
- GRM
- 2.0
CMA / ARV
No comps found within radius.
Projected returns pro-forma
-3.0% appreciation · 4.93% rent growth · sell at horizon
- IRR
- —
- Equity multiple
- 6.73×
- Total profit
- $58,233
- Equity at exit
- $5,412
- IRR
- —
- Equity multiple
- 15.01×
- Total profit
- $142,366
- Equity at exit
- $3,139
Cash invested: $10,164 (down + closing). Projections, not guarantees.
Landlord ↔ Tenant lean methodology
- Overall (STATE)
- 90 Strongly Landlord-Friendly
- State Indiana
- 90 Strongly Landlord-Friendly · R+11
- County
- — inherits STATE
- City
- — inherits STATE
ZIP-level market 46806
- Home prices YoY
- -33.6%
- Rents YoY
- 4.9%
- Active inventory
- 129
- Price-to-rent
- 2.0×
Monthly cashflow live
- Estimated rent
- $1,531 medium interval (Pro) →
- Mortgage (P&I)
- −$190
- Tax est. 1.5%
- −$45 /mo · $544/yr
- Insurance
- −$15
- HOA
- −$0
- Vacancy / Maint / Mgmt
- −$322
- Net cashflow
- $959
Break-even live
UW: 25.0% down · 7.5% · 30yr · 1.5% tax · 5.0% vac · 8.0% maint · 8.0% mgmt
Financing live
Cash to close
- Down payment
- $9,075
- Closing costs
- $1,089
- Reserves months
- —
- Total cash needed
- —
Loan-product check · same deal, 3 products live
Conventional
25% down · 7.5% · 30yr
- Down + closing
- —
- Monthly P&I
- —
- Monthly cashflow
- —
- DSCR
- —
- Eligible?
- —
Personal DTI + credit; lowest rate.
DSCR
20% down · 8.5% · 30yr
- Down + closing
- —
- Monthly P&I
- —
- Monthly cashflow
- —
- DSCR
- —
- Eligible?
- —
No personal income docs; deal must DSCR.
Hard money
10% down · 12.0% · 12mo
- Down + closing
- —
- Monthly P&I
- —
- Monthly cashflow
- —
- DSCR
- —
- Eligible?
- —
Short-term bridge; refi at stabilization.
Rent comps 1 comps
| Address | Beds | Baths | Sqft | Rent | $/sqft | DOM | Units | Dist |
|---|---|---|---|---|---|---|---|---|
| 2396 Cinema Xing Fort Wayne, IN | 3.0 | 2.5 | 1580 | $1,999 | $1.27 | 43d | 15 | 1.39mi |
Listing history 15 events
-
2026-06-18days on market $36,300 Active 124 DOM
-
2026-06-17days on market $36,300 Active 123 DOM
-
2026-06-16days on market $36,300 Active 122 DOM
-
2026-06-15days on market $36,300 Active 121 DOM
-
2026-06-14days on market $36,300 Active 119 DOM
-
2026-06-13days on market $36,300 Active 118 DOM
-
2026-06-10days on market $36,300 Active 116 DOM
-
2026-06-09days on market $36,300 Active 115 DOM
-
2026-06-08days on market $36,300 Active 114 DOM
-
2026-06-07days on market $36,300 Active 113 DOM
-
2026-06-03days on market $36,300 Active 109 DOM
-
2026-06-02days on market $36,300 Active 108 DOM
-
2026-06-01pricedays on market $36,300 Active 107 DOM
-
2026-05-31days on market $35,800 Active 106 DOM
-
2026-05-30days on market $35,800 Active 105 DOM
ⓘ Source: listings_history table (triggers on properties + properties_extension) + one-shot
backfill from property_details.listing_events for pre-trigger history.
Nearby sold comps map
Loading sold comps map…
Walkable amenities ~0.75 mi
Loading nearby amenities…
Taxation est. · year 1
- Rental income
- $18,374
- − Mortgage interest
- −$2,033
- − Property taxes
- −$544
- − Insurance
- −$182
- − Repairs & maintenance
- −$1,470
- − Management
- −$1,470
- − Depreciation
- −$1,056
- Taxable income
- $11,618
- Est. tax owed @ 24.0%
- −$2,788
- After-tax cash flow
- $8,716/yr
For passive investors: Depreciation is non-cash, so a rental often shows a tax loss while cash-flowing — sheltering income. Rental losses are passive: they offset passive income freely, and up to $25,000/yr can offset ordinary (W-2) income if you actively participate and your MAGI is under $100k (phasing out to $0 by $150k); unused losses carry forward. On sale, claimed depreciation is recaptured at up to 25%, and gains may owe capital-gains tax (a 1031 exchange can defer both). Figures are a year-1 estimate at your 24.0% rate — not tax advice; consult a CPA.
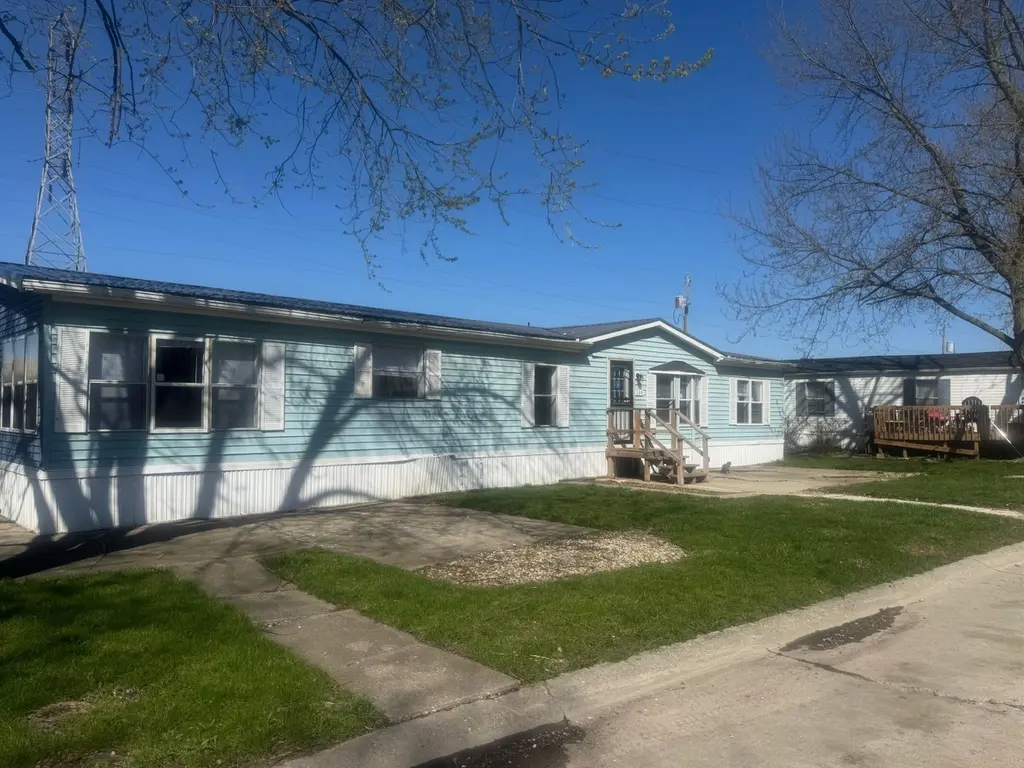
Condition & rehab AI · 1 photo
The home is in fair condition with some exterior and driveway repairs needed. Painting the exterior and sealing driveway cracks can significantly improve its resale and rental value.
Repairs flagged
- Minor Driveway cracks — Small cracks in concrete driveway
- Minor Exterior siding — Some discoloration on light blue siding
Value-add opportunities
- Resale Paint exterior walls — Fresh paint can improve curb appeal and home value
- Rental Seal driveway cracks — Sealing cracks can prevent further damage and keep the driveway in good condition
Renovation cost estimate screening
| Repair item | Severity | Est. cost |
|---|---|---|
| Driveway cracks · Small cracks in concrete driveway | Minor | $500–3,000 |
| Exterior siding · Some discoloration on light blue siding | Minor | $500–3,000 |
| Total estimated repair cost · 2 items | $1,000–6,000 |
Value-add ROI direction
- Resale Paint exterior walls — Fresh paint can improve curb appeal and home value ↑
- Rental Seal driveway cracks — Sealing cracks can prevent further damage and keep the driveway in good condition ↑
ⓘ Cost ranges are severity-bucket heuristics (US national rule-of-thumb). Get contractor quotes + a written scope before underwriting a rehab budget.
Schools (NCES district)
- District
- East Allen County Schools
- NCES district ID
- 1802850
- Math proficiency
- 36% ▼ -8.00%
- Reading proficiency
- 47% ▼ -4.00%
- Median HH income
- $50,524
- Composite
- 35.75/100
- National rank
- #4849
- State rank
- #122 of 301 in IN
Livability — New Haven
- Score
- 70/100
- State rank
- #149
- US rank
- #7499
Category grades
Schools grade is shown separately in the Schools card above.
Census & demographics
- Census place
- New Haven, IN
- County
- Allen County · 326,813 people
- Metro
- Fort Wayne, IN
- Population (ZIP)
- 26,425
- Household income
- $47,895
- Rent vs Own
- Severe rent burden
- 1184.0
Population outlook (Allen County) Hauer SSP2
- Today (2025)
- 394,020 people
- By 2030
- 405,128 · +2.8%
- By 2040
- 423,476 · +7.5%
- By 2050
- 435,137 · +10.4%
- By 2075
- 450,293 · +14.3%
- By 2100
- 424,101 · +7.6%
Race, ethnicity, and origin ACS 2023
- Neighborhood character
- Highly diverse neighborhood (Simpson 0.74)
- Race & ethnicity
- Black 37% Hispanic / Latino 26% White 21% Asian 12% Two or more races 11% Native American 2%
- Hispanic origin (detail)
- Mexican 18% Puerto Rican 1%
- Common ancestry
- Italian 1% Romanian 1% Lithuanian 1%
- Foreign-born
- 19% · Canada, Philippines, South Korea
- Languages at home
- 71% English-only · Spanish 19% Other Asian/Pacific 9%
Political lean MEDSL · Allen
- 2024 margin
- R (+12.5) · D 42.9% · R 55.4% · Other 1.7%
- 2008→2024 swing
- -8.1pp toward R · 2008: -4.3pp · 2024: -12.5pp
- All cycles
- 2024: R+12.5 2020: R+11.2 2016: R+19.6 2012: R+16.8 2008: R+4.3
Not yet ingested
- Civics
- —
Market trends
- HPI YoY
- ▼ -148.00%
- Current HPI
- 291.8198
- Rent YoY
- ▲ 4.93%
- Metro
- Fort Wayne, IN
- State GDP YoY
- ▲ 2.90%
- F500 in state
- 18
Industry mix (Fortune 500 HQ in IN)
| Industry | F500 HQs | Revenue |
|---|---|---|
| Industrial Machinery | 2 | $37B |
|
||
| Healthcare | 1 | $177B |
|
||
| Pharmaceuticals | 1 | $45B |
|
||
| Metals / Steel | 1 | $18B |
|
||
| Agriculture | 1 | $17B |
|
||
| Packaging | 1 | $12B |
|
||
Cash-flow waterfall
monthlySold comps — $/sqft
last 12 mo · ≤1 miLoading sold comps…