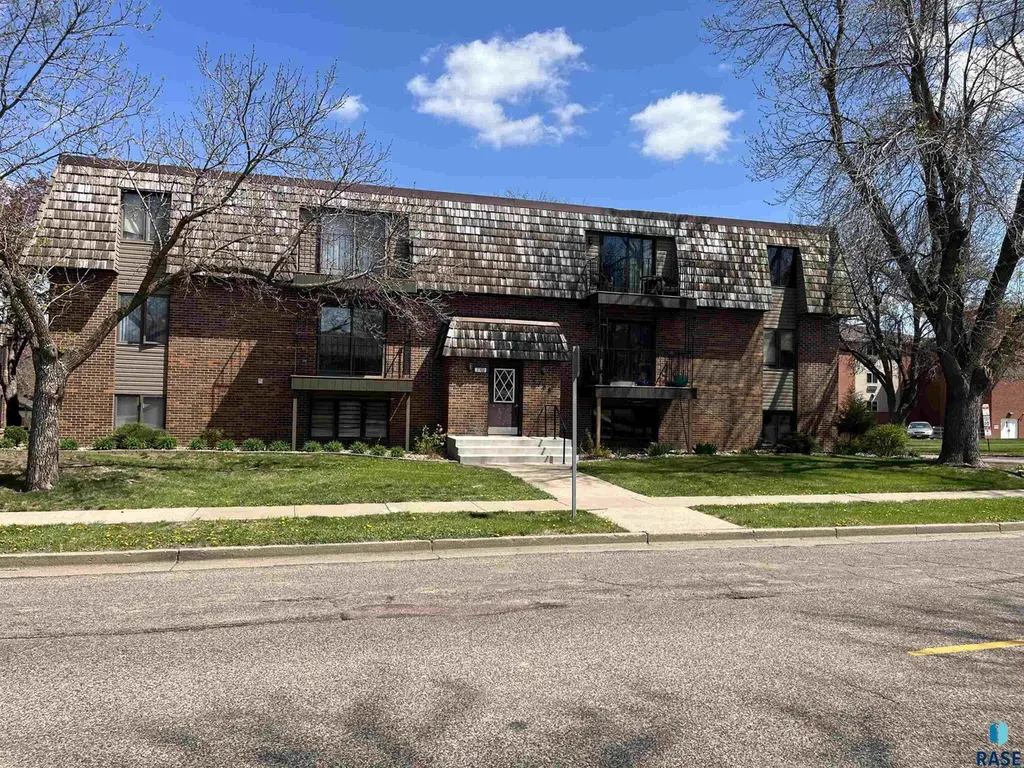
3708 S Terry Ave Ave #110 · Sioux Falls, SD
Flood risk 1/10 · Minimal
- FEMA flood zone
- X (unshaded)
- Chance of flooding over 30 yrs
- 0.0%
- Est. flood insurance / yr
- $507 – $1,088
Fire risk 1/10 · Minimal
- Est. fire insurance / yr
- $1,342 – $2,492
Heat risk 3/10 · Minor
- Hot days now (above 99°F)
- 7 days/yr
- Hot days in 30 yrs
- 14 days/yr
Wind risk 2/10 · Minimal
- Chance of severe wind over 30 yrs
- —
Air-quality risk 2/10 · Minimal
- Unhealthy air days now
- 1 days/yr
- Unhealthy air days in 30 yrs
- 1 days/yr
Risk factors via First Street. Map © Google.
Why this score? — see what drove the D grade
The composite is a weighted blend of 9 inputs, each scored 0–100. Each bar is that input's sub-score; the figure is the points it added to the 100-point composite (weight × sub-score).
- ARV discount +14.4/15.0
- 1% rule +6.5/10.0
- Cash flow +6.0/30.0
- Livability +4.2/5.0
- Condition / age +4.0/5.0
- Schools +3.7/10.0
- Rent growth +3.0/5.0
- DSCR +0.4/10.0
- Appreciation +0.0/10.0
$95,000
🖨 Deal sheet 📄 Offer letter ✓ Due diligence
Key facts
- New flooring
- New bathroom vanity
- New countertops
Tags
Property features AI
Finance
- Financial info: Annual property tax available
- HOA & community: Homeowners association with amenities including pool, trash service, snow removal, grounds and structure maintenance, and water; HOA fee applies
Exterior
- Parking: Detached garage (1 car), approximately 12x24
- Utilities: Public water; Public sewer
- Home design: Condominium (ranch style); Lower level unit
- Construction: Brick construction; Tar and gravel roof; Other foundation
- Exterior features: City lot; Public maintained road; Lot ownership: owned
Interior
- Kitchen: Electric range; Microwave; Dishwasher; Refrigerator
- Bedrooms: Total of 4 rooms (includes bedrooms and living spaces)
- Flooring: Carpet; Laminate
- Bathrooms: 1 full bathroom on main level
- Heating & cooling: Baseboard heating; Central air conditioning
- Interior features: Main level finished living area; No basement
- Laundry & utility: Electric water heater; No water softener
Neighborhood map
What this means for you Summary
Snapshot
- This is a 2-bed/1.0-bath condo listed at $95k. Condition is rated good.
Deal economics
- At list price, monthly cash flow is $-180 ($-2k/yr) — negative.
- To cash-flow at today's rent, offer at most $69k (27.5% below list).
- Meets the 1% rule at list price ($1k rent vs $95k).
- Recommended offer: $69k (27.5% below list) — sets the bar for cash-flow.
- Cap rate 4.0% vs local median 2.6% in Sioux Falls — top-decile yield for the area; either an underpriced asset or a hidden risk that comps aren't pricing in. Stress-test before assuming the spread holds.
Location & tenants
- Location reads 85/100 on livability (#3 in SD, #610 nationally) — a professional / high-income tenant draw. Strengths: amenities A+, commute A+, cost of living A+; Watch: crime F.
- Sioux Falls School District 49-5 (urban): math 39% / reading 48% proficiency, ranked #45 of 59 in SD (top 76%) — families likely to look elsewhere, expect single-tenant / working-renter base with shorter leases.
- Zoned schools: Oscar Howe Elementary - 58 (math 49% / reading 48%, grade D, #132 of 253 statewide, top 52%, 586 students, 42% FRL); Roosevelt High School - 03 (math 40% / reading 60%, grade D+, #67 of 151 statewide, top 45%, 1,713 students, 28% FRL) — zoned schools at 35% FRL track the district average.
- Market conditions: Rents rising (+2.2%/yr); 393 active listings in the ZIP; 40 comparable units currently listed for rent nearby; rentals at typical pace (median 21d on market — plan ~3-4 weeks tenant-placement turnaround); solid renter incomes; 2,425 units permitted in Minnehaha County in 2024 (1,367 in 5+ unit buildings).
- This rent is only 17% of the median local income ($78k/yr) — well below the 30% rent-burden line; pricing power to push rent on renewal without tenant pushback.
Forward outlook
- Local home prices are declining (-3.0%/yr); year-one equity from $657 of loan paydown is wiped out by about $3k of value loss. Plan a longer hold.
- Minnehaha County population projected at +46% by 2050 — long-run rental-demand tailwind backs the buy-and-hold thesis.
Negotiation context
- It's been on market 43 days — a 3% lower offer ($92k) is reasonable based on typical stale-listing flexibility.
Risks & watch-outs
- Watch-outs: HOA is 35% of rent.
Questions for the listing agent
- What do current leases actually rent for vs. the listed asking? Can we see a recent rent roll and the last 12 months of T-12 income?
- It's been on market 43 days. Have you received any prior offers? Is the seller open to a 27% concession, seller financing, or rate buy-down credit?
- Built in 1977 — when were the roof, HVAC, electrical panel, plumbing, and water heater last replaced?
- What does the HOA fee cover, when was the last increase, and are there any pending special assessments or reserve-fund shortfalls?
- Any open or pending special assessments — roof, HVAC, plumbing, elevator, façade? What's the per-unit balance and payoff schedule, and is the seller paying it off at close or rolling it to the buyer?
- Is there a deadline driving the sale (1031 exchange, divorce, estate, relocation)? That informs how much negotiation room exists.
- Schools are B-rated — typically a magnet for longer-tenancy family renters. What's the average tenant stay here, and is there a school-zone premium baked into asking?
- Crime grade is F in this area — have there been break-ins, vandalism, or insurance claims at this property in the last 3 years? What carrier currently insures it and at what premium?
- The area grade is low — what's the realistic commute time and amenity access for the typical tenant pool here? Any planned neighborhood developments (good or bad) we should know about?
- What's the average days-on-market for RENTAL listings here right now (not sales)? A rising rental-DOM trend means longer vacancies and softer asking-rent achievability than the comps imply.
- What's the recent tenant-quality profile in this submarket — average credit score on applications, eviction rate, late-payment / NSF rate, and stable-employment percentage? A property-management company in the area should have these aggregated.
- How much new apartment / multifamily construction is in the pipeline within 1–3 miles? Heavy new supply (>2% of stock underway) typically softens rents 12–24 months out; light construction supports rent growth.
Investment metrics
- 1% rule
- 1.15% ✓
- Cap rate
- 4.01%
- Cash-on-cash
- -8.14%
- DSCR
- 0.64
- GRM
- 7.2
CMA / ARV
- ARV (median comp)
- $112,284
- List price
- $95,000
- Delta
- -15.39%
- Verdict
- UNDERPRICED
- Comps
- 20 within 1.0 mi
Projected returns pro-forma
-3.0% appreciation · 2.18% rent growth · sell at horizon
- IRR
- -31.8%
- Equity multiple
- -0.03×
- Total profit
- $-27,524
- Equity at exit
- $14,165
- IRR
- -42.5%
- Equity multiple
- -0.55×
- Total profit
- $-41,339
- Equity at exit
- $8,214
Cash invested: $26,600 (down + closing). Projections, not guarantees.
Landlord ↔ Tenant lean methodology
- Overall (STATE)
- 83 Strongly Landlord-Friendly
- State South Dakota
- 83 Strongly Landlord-Friendly · R+16
- County
- — inherits STATE
- City
- — inherits STATE
ZIP-level market 57106
- Rents YoY
- 2.2%
- Active inventory
- 393
- Price-to-rent
- 7.2×
Monthly cashflow live
- Estimated rent
- $1,093 high interval (Pro) →
- Mortgage (P&I)
- −$498
- Tax est. 1.5%
- −$119 /mo · $1,425/yr
- Insurance
- −$40
- HOA
- −$387
- Vacancy / Maint / Mgmt
- −$229
- Net cashflow
- $-180
Break-even live
UW: 25.0% down · 7.5% · 30yr · 1.5% tax · 5.0% vac · 8.0% maint · 8.0% mgmt
Financing live
Cash to close
- Down payment
- $23,750
- Closing costs
- $2,850
- Reserves months
- —
- Total cash needed
- —
Loan-product check · same deal, 3 products live
Conventional
25% down · 7.5% · 30yr
- Down + closing
- —
- Monthly P&I
- —
- Monthly cashflow
- —
- DSCR
- —
- Eligible?
- —
Personal DTI + credit; lowest rate.
DSCR
20% down · 8.5% · 30yr
- Down + closing
- —
- Monthly P&I
- —
- Monthly cashflow
- —
- DSCR
- —
- Eligible?
- —
No personal income docs; deal must DSCR.
Hard money
10% down · 12.0% · 12mo
- Down + closing
- —
- Monthly P&I
- —
- Monthly cashflow
- —
- DSCR
- —
- Eligible?
- —
Short-term bridge; refi at stabilization.
Rent comps 40 comps
| Address | Beds | Baths | Sqft | Rent | $/sqft | DOM | Units | Dist |
|---|---|---|---|---|---|---|---|---|
| 3712 S Terry Ave Sioux Falls, SD | 2.0 | 1.0 | 768 | $1,250 | $1.63 | 21d | 1 | 0.07mi |
| 3552 S Gateway Blvd #102 Sioux Falls, SD | 2.0 | 1.0 | 816 | $1,400 | $1.72 | 21d | 1 | 0.11mi |
| 4908 W Kirkwood Cir Sioux Falls, SD | 2.0 | 1.0 | 750 | $749 | $1.00 | 21d | 1 | 0.12mi |
| 3511 S Gateway Blvd Sioux Falls, SD | 1.0 | 1.0 | 600 | $800 | $1.33 | 21d | 2 | 0.14mi |
| 3804 S Cathy Ave Sioux Falls, SD | 1.0 | 1.0 | 800 | $875 | $1.09 | 43d | 1 | 0.15mi |
| 5005 W Heritage Pl Unit 7 Sioux Falls, SD | 2.0 | 1.0 | 900 | $825 | $0.92 | 43d | 1 | 0.15mi |
| 3705 S Cathy Ave Sioux Falls, SD | 2.0 | 1.0 | 821 | $875 | $1.07 | 21d | 1 | 0.20mi |
| 3901 S Cathy Ave Sioux Falls, SD | 2.0 | 1.5 | 1100 | $888 | $0.81 | 21d | 2 | 0.21mi |
| 3600 S Cathy Ave Apt 2 Sioux Falls, SD | 2.0 | 1.0 | 850 | $825 | $0.97 | 43d | 1 | 0.22mi |
| 3609 S Cathy Ave Unit 10 Sioux Falls, SD | 2.0 | 1.5 | 994 | $795 | $0.80 | 43d | 1 | 0.23mi |
| 3012 S Mayfair Dr Sioux Falls, SD | 2.0 | 1.0 | 800 | $787 | $0.98 | 43d | 1 | 0.49mi |
| 4605 W Chippewa Cir Sioux Falls, SD | 1.0–2.0 | 1.0–2.0 | 1090 | $1,132 | $1.04 | 13d | 16 | 0.51mi |
| 4401 W Valhalla Blvd Sioux Falls, SD | 1.0–3.0 | 1.0–2.0 | 811 | $978 | $1.21 | 13d | 33 | 0.52mi |
| 4100 W Valhalla Blvd Sioux Falls, SD | 1.0–3.0 | 1.0–2.0 | 843 | $942 | $1.12 | 13d | 17 | 0.54mi |
| 3215 S Westbrooke Ln Sioux Falls, SD | 1.0–2.0 | 1.0 | 900 | $1,018 | $1.13 | 13d | 10 | 0.60mi |
| 4901 S Marion Rd Apt 4 Sioux Falls, SD | 2.0 | 1.0 | 1040 | $850 | $0.82 | 43d | 1 | 0.70mi |
| 5401 56th St Apt 32 Sioux Falls, SD | 2.0 | 1.0 | 1040 | $900 | $0.87 | 43d | 1 | 0.71mi |
| 6000 W 43rd St Sioux Falls, SD | 1.0–2.0 | 1.0–2.0 | 910 | $1,005 | $1.10 | 13d | 2 | 0.80mi |
| 4400 S Louise Ave Sioux Falls, SD | 2.0–3.0 | 1.0 | 965 | $902 | $0.93 | 43d | 1 | 0.88mi |
| 5107 S Marion Rd Sioux Falls, SD | 1.0–3.0 | 1.0–2.0 | 1050 | $1,142 | $1.09 | 13d | 4 | 0.90mi |
| 2900 S Louise Ave Unit 2900-207 Sioux Falls, SD | 2.0 | 1.0 | 913 | $1,025 | $1.12 | 13d | 1 | 0.92mi |
| 2900 S Louise Ave Unit 3008-202 Sioux Falls, SD | 2.0 | 1.0 | 913 | $935 | $1.02 | 13d | 1 | 0.92mi |
| 2900 S Louise Ave Unit 3008-304 Sioux Falls, SD | 2.0 | 1.0 | 927 | $960 | $1.04 | 13d | 1 | 0.92mi |
| 2900 S Louise Ave Unit 3012-202 Sioux Falls, SD | 2.0 | 1.0 | 913 | $1,010 | $1.11 | 21d | 1 | 0.92mi |
| 2900 S Louise Ave Unit 3004-304 Sioux Falls, SD | 2.0 | 1.0 | 927 | $1,035 | $1.12 | 21d | 1 | 0.92mi |
| 2900 S Louise Ave Unit 2908-207 Sioux Falls, SD | 2.0 | 1.0 | 913 | $1,074 | $1.18 | 21d | 1 | 0.92mi |
| 2900 S Louise Ave Unit 2908-105 Sioux Falls, SD | 1.0 | 1.0 | 738 | $941 | $1.28 | 43d | 1 | 0.92mi |
| 2900 S Louise Ave Unit 3000-208 Sioux Falls, SD | 2.0 | 1.0 | 913 | $1,060 | $1.16 | 13d | 1 | 0.92mi |
| 2900 S Louise Ave Unit 3000-303 Sioux Falls, SD | 1.0 | 1.0 | 738 | $865 | $1.17 | 13d | 1 | 0.92mi |
| 2900 S Louise Ave Unit 3008-106 Sioux Falls, SD | 2.0 | 1.0 | 927 | $1,105 | $1.19 | 13d | 1 | 0.92mi |
| 5109 S Rolling Green Ave Sioux Falls, SD | 1.0 | 1.0 | 825 | $1,294 | $1.57 | 21d | 2 | 0.93mi |
| 2301 S Lorraine Pl Sioux Falls, SD | 2.0 | 1.0–2.0 | 834 | $1,695 | $2.03 | 13d | 15 | 0.94mi |
| 4617 S Baha Ave Unit 4703 Sioux Falls, SD | 2.0 | 1.0 | 800 | $1,150 | $1.44 | 43d | 1 | 0.95mi |
| 4617 S Baha Ave Unit 4713 Sioux Falls, SD | 3.0 | 2.0 | 1000 | $1,390 | $1.39 | 43d | 1 | 0.95mi |
| 4617 S Baha Ave Unit 4709 Sioux Falls, SD | 2.0 | 1.0 | 800 | $1,295 | $1.62 | 43d | 1 | 0.95mi |
| 5120 S Rolling Green Ave Sioux Falls, SD | 2.0 | 1.0–2.0 | 801 | $1,430 | $1.78 | 13d | 24 | 0.97mi |
| 3700 S Golden Creek Pl Unit 3201-18 Sioux Falls, SD | 2.0 | 1.0 | 840 | $943 | $1.12 | 21d | 1 | 0.98mi |
| 3700 S Golden Creek Pl Unit 3700-203 Sioux Falls, SD | 1.0 | 1.0 | 640 | $895 | $1.40 | 43d | 1 | 0.98mi |
| 3700 S Golden Creek Pl Unit 3205-17 Sioux Falls, SD | 2.0 | 1.0 | 840 | $1,030 | $1.23 | 43d | 1 | 0.98mi |
| 3700 S Golden Creek Pl Unit 3201-15 Sioux Falls, SD | 2.0 | 1.0 | 840 | $955 | $1.14 | 43d | 1 | 0.98mi |
HOA detail condo
- Monthly dues
- $387 · $4,644/yr
- Assessments
- None detected in remarks — confirm with the listing agent.
Listing history 17 events
-
2026-06-18days on market $95,000 Active 43 DOM
-
2026-06-17days on market $95,000 Active 42 DOM
-
2026-06-16days on market $95,000 Active 41 DOM
-
2026-06-15days on market $95,000 Active 40 DOM
-
2026-06-14days on market $95,000 Active 38 DOM
-
2026-06-13pricedays on market $95,000 Active 37 DOM
-
2026-06-10days on market $103,000 Active 35 DOM
-
2026-06-09days on market $103,000 Active 34 DOM
-
2026-06-08days on market $103,000 Active 33 DOM
-
2026-06-07days on market $103,000 Active 32 DOM
-
2026-06-05days on market $103,000 Active 29 DOM
-
2026-06-03days on market $103,000 Active 28 DOM
-
2026-06-02days on market $103,000 Active 27 DOM
-
2026-06-01days on market $103,000 Active 26 DOM
-
2026-05-31days on market $103,000 Active 25 DOM
-
2026-05-30days on market $103,000 Active 24 DOM
-
2026-05-06$110,000 Active 907-char remark
ⓘ Source: listings_history table (triggers on properties + properties_extension) + one-shot
backfill from property_details.listing_events for pre-trigger history.
Climate risk First Street
- Flood 1/10 Low FEMA zone X (unshaded) · 0% chance over 30 yrs
- Wildfire 1/10 Low
- Heat 3/10 Moderate 7 d/yr ≥99°F today · 14 d/yr by 30 yrs out
- Wind 2/10 Low
- Air quality 2/10 Low 1 unhealthy d/yr today · 1 by 30 yrs out
Nearby sold comps map
Loading sold comps map…
Walkable amenities ~0.75 mi
Loading nearby amenities…
Taxation est. · year 1
- Rental income
- $13,111
- − Mortgage interest
- −$5,321
- − Property taxes
- −$1,425
- − Insurance
- −$475
- − Repairs & maintenance
- −$1,049
- − Management
- −$1,049
- − HOA
- −$4,644
- − Depreciation
- −$2,764
- Taxable loss
- −$3,616
- Est. tax savings @ 24.0%
- +$868
- After-tax cash flow
- $-1,297/yr
For passive investors: Depreciation is non-cash, so a rental often shows a tax loss while cash-flowing — sheltering income. Rental losses are passive: they offset passive income freely, and up to $25,000/yr can offset ordinary (W-2) income if you actively participate and your MAGI is under $100k (phasing out to $0 by $150k); unused losses carry forward. On sale, claimed depreciation is recaptured at up to 25%, and gains may owe capital-gains tax (a 1031 exchange can defer both). Figures are a year-1 estimate at your 24.0% rate — not tax advice; consult a CPA.
Condition & rehab AI · 10 photos
This townhouse is in good condition with a modern kitchen and neutral paint. It has potential for further improvements to enhance its curb appeal and value.
Value-add opportunities
- Both Painting exterior and interior walls — Fresh paint can enhance curb appeal and interior aesthetics
- Both Landscaping improvements — Well-maintained landscaping can increase curb appeal and property value
- Resale Kitchen backsplash — A backsplash can add visual interest and protect the backsplash from stains
- Rental Bathroom renovation — A modern bathroom can attract renters and increase rental value
Renovation cost estimate screening
Value-add ROI direction
- Both Painting exterior and interior walls — Fresh paint can enhance curb appeal and interior aesthetics ↑
- Both Landscaping improvements — Well-maintained landscaping can increase curb appeal and property value ↑
- Resale Kitchen backsplash — A backsplash can add visual interest and protect the backsplash from stains ↑
- Rental Bathroom renovation — A modern bathroom can attract renters and increase rental value ↑
ⓘ Cost ranges are severity-bucket heuristics (US national rule-of-thumb). Get contractor quotes + a written scope before underwriting a rehab budget.
Schools (NCES district)
- District
- Sioux Falls School District 49-5
- NCES district ID
- 4666270
- Math proficiency
- 39% ▼ -4.00%
- Reading proficiency
- 48% ▼ -2.00%
- Median HH income
- $51,093
- Composite
- 37.47/100
- National rank
- #4407
- State rank
- #45 of 59 in SD
Livability — Sioux Falls
- Score
- 85/100
- State rank
- #3
- US rank
- #610
Category grades
Schools grade is shown separately in the Schools card above.
Census & demographics
- Census place
- Sioux Falls, SD
- County
- Minnehaha County · 191,523 people
- City population
- 207,623
- Metro
- Sioux Falls, SD
- Population (ZIP)
- 51,907
- Household income
- $77,580
- Rent vs Own
- Severe rent burden
- 1500.0
Population outlook (Minnehaha County) Hauer SSP2
- Today (2025)
- 222,323 people
- By 2030
- 241,430 · +8.6%
- By 2040
- 281,643 · +26.7%
- By 2050
- 325,574 · +46.4%
- By 2075
- 469,313 · +111.1%
- By 2100
- 664,763 · +199.0%
Race, ethnicity, and origin ACS 2023
- Neighborhood character
- Predominantly White (81%)
- Race & ethnicity
- White 81% Hispanic / Latino 7% Two or more races 7% Black 5% Asian 1% Native American 1%
- Hispanic origin (detail)
- Mexican 2%
- Common ancestry
- Portuguese 12% Iranian 7% Lithuanian 2%
- Foreign-born
- 7% · Canada
- Languages at home
- 91% English-only · Spanish 5% Russian/Polish/Slavic 1% Other Indo-European 1%
Political lean MEDSL · Minnehaha
- 2024 margin
- R (+12.7) · D 42.5% · R 55.2% · Other 2.4%
- 2008→2024 swing
- -13.4pp toward R · 2008: 0.7pp · 2024: -12.7pp
- All cycles
- 2024: R+12.7 2020: R+9.5 2016: R+14.6 2012: R+7.4 2008: D+0.7
Not yet ingested
- Civics
- —
Market trends
- HPI YoY
- ▼ -138.17%
- Current HPI
- 214.9065
- Rent YoY
- ▲ 2.18%
- Metro
- Sioux Falls, SD
- State GDP YoY
- ▲ 0.70%
- F500 in state
- 2
Industry mix (Fortune 500 HQ in SD)
| Industry | F500 HQs | Revenue |
|---|---|---|
| Utilities | 1 | $1B |
|
||
Price history
-13.6% since first listed3 events — show timeline
- 2026-06-10 Price Changed $95,000 REALTOR® Association of the Sioux Empire
- 2026-05-21 Price Changed $103,000 REALTOR® Association of the Sioux Empire
- 2026-05-06 Listed $110,000 REALTOR® Association of the Sioux Empire
Cash-flow waterfall
monthlySold comps — $/sqft
last 12 mo · ≤1 miLoading sold comps…