 🔨 Auction
6413 North Dr · Louisville/Jefferson County metro government (balance), KY
Flood risk 1/10 · Minimal
- FEMA flood zone
- X (shaded)
- Chance of flooding over 30 yrs
- 0.0%
- Est. flood insurance / yr
- $507 – $1,088
Fire risk 3/10 · Minor
- Est. fire insurance / yr
- $839 – $1,559
Heat risk 5/10 · Moderate
- Hot days now (above 104°F)
- 7 days/yr
- Hot days in 30 yrs
- 19 days/yr
Wind risk 2/10 · Minimal
- Chance of severe wind over 30 yrs
- 3.0%
Air-quality risk 3/10 · Minor
- Unhealthy air days now
- 2 days/yr
- Unhealthy air days in 30 yrs
- 3 days/yr
Risk factors via First Street. Map © Google.
Why this score? — see what drove the D grade
The composite is a weighted blend of 9 inputs, each scored 0–100. Each bar is that input's sub-score; the figure is the points it added to the 100-point composite (weight × sub-score).
- Cash flow +15.0/30.0
- ARV discount +7.5/15.0
- 1% rule +5.0/10.0
- DSCR +5.0/10.0
- Rent growth +3.0/5.0
- Livability +2.5/5.0
- Schools +2.3/10.0
- Condition / age +2.2/5.0
- Appreciation +0.0/10.0
$1
🖨 Deal sheet 📄 Offer letter ✓ Due diligence
Listing remarks MLS
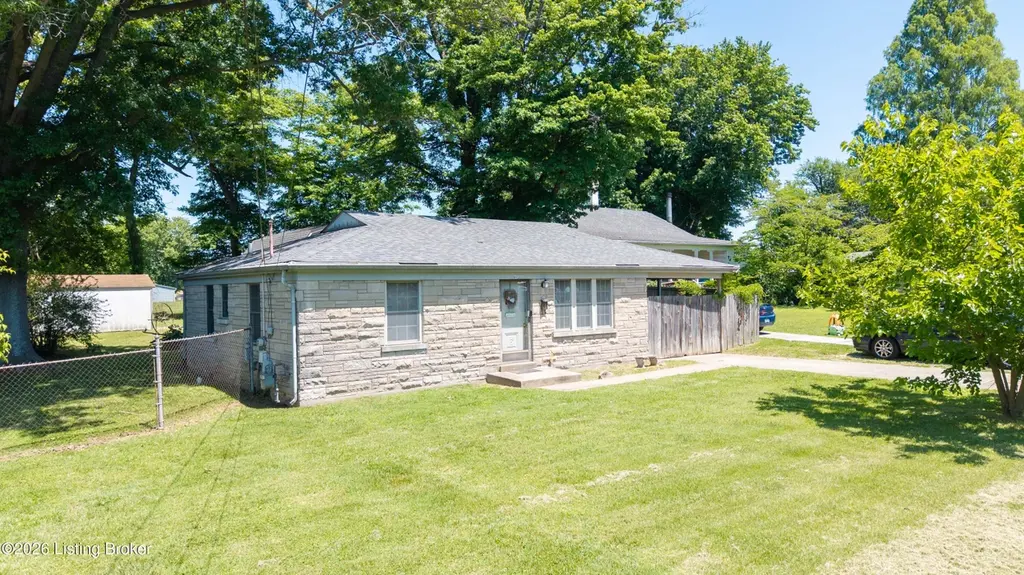
ONLINE ONLY Absolute AUCTION! Online Bidding Begins Monday, May 25, 2026 at 10:00 AM (EST) and ends Thursday, June 11, 2026 at 7:00 PM (EST). Buyers premium will be added to the final bid price. Property sells AS-IS, closing on or before 45 days from auction date. SELLS TO THE HIGHEST BIDDER REGARDLESS OF PRICE! "Bring your imagination" is real estate speak for this place needs some love, but it also means you have a blank canvas. With a 2-bedroom, 1-bath layout, a detached garage, and a fenced yard, you have a highly marketable footprint for either a rental property or a starter-home flip.
Key facts
- 0.26 acre lot
- Garage
- Built 1954
Property features AI
Finance
- Other: Lot size approximately 0.26 acres; Building area reported as 744
- HOA & community: No association fee
Exterior
- Parking: Detached 1-car garage
- Utilities: Electricity connected
- Home design: Single-story residential property (1 story); Property listed as Auction
- Construction: Built in 1954; Stone construction; Shingle roof
- Exterior features: Wood and chain-link fencing; Located in the Pleasure Ridge Park subdivision
Interior
- Kitchen: Kitchen located on the first floor
- Bedrooms: Two bedrooms, both on the first floor
- Bathrooms: One full bathroom
- Heating & cooling: Heating present; Wall/window air conditioning units
- Interior features: Total of 4 rooms; No basement
- Laundry & utility: No first-floor laundry
Neighborhood map
What this means for you Summary
Snapshot
- This is a 2-bed/1.0-bath single-family listed at $1. Condition is rated fair.
Deal economics
- At list price, monthly cash flow is $959 ($12k/yr) — positive.
- The deal already cash-flows at list — no discount required.
- Meets the 1% rule at list price ($1k rent vs $1).
- Cap rate 1151220.8% vs local median 4.0% in Louisville/Jefferson County metro government (balance) — top-decile yield for the area; either an underpriced asset or a hidden risk that comps aren't pricing in. Stress-test before assuming the spread holds.
Location & tenants
- Location reads: area grade D — affects rentability + tenant quality, not the cash-flow math above.
- Jefferson County (urban): math 19% / reading 35% proficiency, ranked #121 of 165 in KY (top 73%) — low school quality limits family demand, transient renter base, plan for 1-2y turnover.
- Market conditions: Rents rising (+2.1%/yr); 218 active listings in the ZIP; 2,836 units permitted in Jefferson County in 2024 (1,558 in 5+ unit buildings).
Forward outlook
- Local home prices are declining (-3.0%/yr); year-one equity from $0 of loan paydown is wiped out by about $0 of value loss. Plan a longer hold.
- Jefferson County population projected at +13% by 2050 — modest demand growth; plan on rents tracking national, not racing it.
- At projected returns (-3.0% appreciation + 2.1% rent growth), your $0 cash investment doubles in ~1 year — after that, you're playing with house money.
Negotiation context
- It's been on market 33 days — a 3% lower offer ($0) is reasonable based on typical stale-listing flexibility.
- 2 sale attempts with the ask held roughly flat each time — persistent listings suggest the price (not the market) is what's stuck; bring a comps-based counter.
Risks & watch-outs
- Watch-outs: built in 1954 — expect roof / HVAC / electrical / plumbing capex.
- Climate carrying-cost: extreme-heat days projected 7→19/yr by 2055 (HVAC capex compounding) — expect insurance premiums to compound above CPI over the hold.
Questions for the listing agent
- It's been on market 33 days. Have you received any prior offers? Is the seller open to a 5% concession, seller financing, or rate buy-down credit?
- Have any recent inspections been done? Can we get a copy of the seller's disclosures and any deferred-maintenance estimates?
- Built in 1954 — when were the roof, HVAC, electrical panel, plumbing, and water heater last replaced?
- Is there a deadline driving the sale (1031 exchange, divorce, estate, relocation)? That informs how much negotiation room exists.
- The area grade is low — what's the realistic commute time and amenity access for the typical tenant pool here? Any planned neighborhood developments (good or bad) we should know about?
- What's the average days-on-market for RENTAL listings here right now (not sales)? A rising rental-DOM trend means longer vacancies and softer asking-rent achievability than the comps imply.
- What's the recent tenant-quality profile in this submarket — average credit score on applications, eviction rate, late-payment / NSF rate, and stable-employment percentage? A property-management company in the area should have these aggregated.
- How much new for-sale + rental construction is in the pipeline within 1–3 miles? Heavy new supply typically softens prices + rents 12–24 months out; constrained supply supports both.
Investment metrics
- 1% rule
- 121437.00% ✓
- Cap rate
- 1151220.76%
- Cash-on-cash
- 4111480.24%
- DSCR
- 182938.74
- GRM
- 0.0
CMA / ARV
No comps found within radius.
Projected returns pro-forma
-3.0% appreciation · 2.07% rent growth · sell at horizon
- IRR
- —
- Equity multiple
- 214263.17×
- Total profit
- $59,993
- Equity at exit
- $0
- IRR
- —
- Equity multiple
- 451639.41×
- Total profit
- $126,459
- Equity at exit
- $0
Cash invested: $0 (down + closing). Projections, not guarantees.
Landlord ↔ Tenant lean methodology
- Overall (STATE)
- 83 Strongly Landlord-Friendly
- State Kentucky
- 83 Strongly Landlord-Friendly · R+16
- County
- — inherits STATE
- City
- — inherits STATE
ZIP-level market 40272
- Rents YoY
- 2.1%
- Active inventory
- 218
Monthly cashflow live
- Estimated rent
- $1,214 medium interval (Pro) →
- Mortgage (P&I)
- −$0
- Tax est. 1.5%
- −$0 /mo · $0/yr
- Insurance
- −$0
- HOA
- −$0
- Vacancy / Maint / Mgmt
- −$255
- Net cashflow
- $959
Break-even live
UW: 25.0% down · 7.5% · 30yr · 1.5% tax · 5.0% vac · 8.0% maint · 8.0% mgmt
Financing live
Cash to close
- Down payment
- $0
- Closing costs
- $0
- Reserves months
- —
- Total cash needed
- —
Loan-product check · same deal, 3 products live
Conventional
25% down · 7.5% · 30yr
- Down + closing
- —
- Monthly P&I
- —
- Monthly cashflow
- —
- DSCR
- —
- Eligible?
- —
Personal DTI + credit; lowest rate.
DSCR
20% down · 8.5% · 30yr
- Down + closing
- —
- Monthly P&I
- —
- Monthly cashflow
- —
- DSCR
- —
- Eligible?
- —
No personal income docs; deal must DSCR.
Hard money
10% down · 12.0% · 12mo
- Down + closing
- —
- Monthly P&I
- —
- Monthly cashflow
- —
- DSCR
- —
- Eligible?
- —
Short-term bridge; refi at stabilization.
Listing history 15 events
-
2026-06-17status $1 Pending 33 DOM
-
2026-06-17days on market $1 Active 33 DOM
-
2026-06-16days on market $1 Active 32 DOM
-
2026-06-15days on market $1 Active 31 DOM
-
2026-06-13days on market $1 Active 29 DOM
-
2026-06-10days on market $1 Active 26 DOM
-
2026-06-09days on market $1 Active 25 DOM
-
2026-06-08days on market $1 Active 24 DOM
-
2026-06-07days on market $1 Active 23 DOM
-
2026-06-03days on market $1 Active 19 DOM
-
2026-06-02days on market $1 Active 18 DOM
-
2026-06-01days on market $1 Active 17 DOM
-
2026-05-31days on market $1 Active 16 DOM
-
2026-05-15$1 Active
-
2026-05-14$1 Active 607-char remark
Show marketing remark (607 chars)
ONLINE ONLY Absolute AUCTION! Online Bidding Begins Monday, May 25, 2026 at 10:00 AM (EST) and ends Thursday, June 11, 2026 at 7:00 PM (EST). Buyers premium will be added to the final bid price. Property sells AS-IS, closing on or before 45 days from auction date. SELLS TO THE HIGHEST BIDDER REGARDLESS OF PRICE! "Bring your imagination" is real estate speak for this place needs some love, but it also means you have a blank canvas. With a 2-bedroom, 1-bath layout, a detached garage, and a fenced yard, you have a highly marketable footprint for either a rental property or a starter-home flip.
ⓘ Source: listings_history table (triggers on properties + properties_extension) + one-shot
backfill from property_details.listing_events for pre-trigger history.
Climate risk First Street
- Flood 1/10 Low FEMA zone X (shaded) · 0% chance over 30 yrs
- Wildfire 3/10 Moderate
- Heat 5/10 Major 7 d/yr ≥104°F today · 19 d/yr by 30 yrs out
- Wind 2/10 Low 3% chance of damaging wind over 30 yrs
- Air quality 3/10 Moderate 2 unhealthy d/yr today · 3 by 30 yrs out
Nearby sold comps map
Loading sold comps map…
Walkable amenities ~0.75 mi
Loading nearby amenities…
Taxation est. · year 1
- Rental income
- $14,572
- − Mortgage interest
- −$0
- − Property taxes
- −$0
- − Insurance
- −$0
- − Repairs & maintenance
- −$1,166
- − Management
- −$1,166
- − Depreciation
- −$0
- Taxable income
- $12,241
- Est. tax owed @ 24.0%
- −$2,938
- After-tax cash flow
- $8,574/yr
For passive investors: Depreciation is non-cash, so a rental often shows a tax loss while cash-flowing — sheltering income. Rental losses are passive: they offset passive income freely, and up to $25,000/yr can offset ordinary (W-2) income if you actively participate and your MAGI is under $100k (phasing out to $0 by $150k); unused losses carry forward. On sale, claimed depreciation is recaptured at up to 25%, and gains may owe capital-gains tax (a 1031 exchange can defer both). Figures are a year-1 estimate at your 24.0% rate — not tax advice; consult a CPA.
Condition & rehab AI · 30 photos
This home is in fair condition with some minor repairs and maintenance needed. It has a good exterior and a well-maintained lawn, but the interior needs some organization and painting to improve its resale and rental value.
Repairs flagged
- Minor Kitchen organization — The kitchen is cluttered with appliances and items, indicating a need for organization and cleaning.
- Minor Bathroom cleaning — The bathroom is cluttered with items on the counter and floor, suggesting a need for cleaning and organization.
Value-add opportunities
- Resale Painting interior walls — Painting interior walls can improve the appearance of the home and make it more appealing to potential buyers.
- Rental Organizing kitchen and bathroom — Organizing the kitchen and bathroom can make the home more functional and appealing to potential renters.
Renovation cost estimate screening
| Repair item | Severity | Est. cost |
|---|---|---|
| Kitchen organization · The kitchen is cluttered with appliances and items, indicating a need for organization and cleaning. | Minor | $500–3,000 |
| Bathroom cleaning · The bathroom is cluttered with items on the counter and floor, suggesting a need for cleaning and organization. | Minor | $500–3,000 |
| Total estimated repair cost · 2 items | $1,000–6,000 |
Value-add ROI direction
- Resale Painting interior walls — Painting interior walls can improve the appearance of the home and make it more appealing to potential buyers. ↑
- Rental Organizing kitchen and bathroom — Organizing the kitchen and bathroom can make the home more functional and appealing to potential renters. ↑
ⓘ Cost ranges are severity-bucket heuristics (US national rule-of-thumb). Get contractor quotes + a written scope before underwriting a rehab budget.
Schools (NCES district)
- District
- Jefferson County
- NCES district ID
- 2102990
- Math proficiency
- 19% ▼ -17.00%
- Reading proficiency
- 35% ▼ -11.00%
- Median HH income
- $47,885
- Composite
- 23.45/100
- National rank
- #7884
- State rank
- #121 of 165 in KY
Livability — Louisville/Jefferson County metro government (balance)
No livability data for this city. (Only ~50 U.S. cities are tracked.)
Census & demographics
- Census place
- Louisville/Jefferson County metro government (balance), KY
- County
- Jefferson County · 790,184 people
- City population
- 419,741
- Metro
- Louisville/Jefferson County, KY-IN
- Population (ZIP)
- 38,289
- Household income
- $69,940
- Rent vs Own
- Severe rent burden
- 702.0
Population outlook (Jefferson County) Hauer SSP2
- Today (2025)
- 823,112 people
- By 2030
- 849,343 · +3.2%
- By 2040
- 895,696 · +8.8%
- By 2050
- 933,630 · +13.4%
- By 2075
- 1,028,262 · +24.9%
- By 2100
- 1,072,675 · +30.3%
Race, ethnicity, and origin ACS 2023
- Neighborhood character
- Predominantly White (77%)
- Race & ethnicity
- White 77% Black 9% Hispanic / Latino 9% Two or more races 9%
- Hispanic origin (detail)
- Mexican 3% Cuban 3%
- Common ancestry
- Slovak 2% Lithuanian 1% Italian 1%
- Foreign-born
- 6% · Canada
- Languages at home
- 92% English-only · Spanish 7%
Political lean MEDSL · Jefferson
- 2024 margin
- D (+16.6) · D 57.4% · R 40.9% · Other 1.7%
- 2008→2024 swing
- +4.5pp toward D · 2008: 12.0pp · 2024: 16.6pp
- All cycles
- 2024: D+16.6 2020: D+20.1 2016: D+13.3 2012: D+11.1 2008: D+12.0
Not yet ingested
- Civics
- —
Market trends
- HPI YoY
- ▼ -262.10%
- Current HPI
- 247.2954
- Rent YoY
- ▲ 2.07%
- Metro
- Louisville/Jefferson County, KY-IN
- State GDP YoY
- ▲ 1.81%
- F500 in state
- 4
Industry mix (Fortune 500 HQ in KY)
| Industry | F500 HQs | Revenue |
|---|---|---|
| Healthcare | 1 | $118B |
|
||
| Food / Beverage | 1 | $7B |
|
||
Property tax history
+5.7%/yrLatest (2025): $1,590 · -2.1% YoY. Source: county tax records.
Cash-flow waterfall
monthlySold comps — $/sqft
last 12 mo · ≤1 miLoading sold comps…