854 W 181st St Unit 4C · New York, NY
Flood risk 1/10 · Minimal
- FEMA flood zone
- X (unshaded)
- Chance of flooding over 30 yrs
- 0.0%
- Est. flood insurance / yr
- $507 – $1,088
Fire risk 1/10 · Minimal
- Est. fire insurance / yr
- $691 – $1,283
Heat risk 6/10 · Moderate
- Hot days now (above 99°F)
- 7 days/yr
- Hot days in 30 yrs
- 14 days/yr
Wind risk 5/10 · Moderate
- Chance of severe wind over 30 yrs
- 26.0%
Air-quality risk 3/10 · Minor
- Unhealthy air days now
- 3 days/yr
- Unhealthy air days in 30 yrs
- 4 days/yr
Risk factors via First Street. Map © Google.
Why this score? — see what drove the D grade
The composite is a weighted blend of 9 inputs, each scored 0–100. Each bar is that input's sub-score; the figure is the points it added to the 100-point composite (weight × sub-score).
- Cash flow +9.3/30.0
- ARV discount +7.5/15.0
- Appreciation +6.1/10.0
- Schools +5.0/10.0
- Rent growth +4.1/5.0
- Livability +3.8/5.0
- 1% rule +2.8/10.0
- DSCR +2.6/10.0
- Condition / age +2.5/5.0
$385,000
🖨 Deal sheet (PDF) 📄 Offer letter ✓ Due diligence
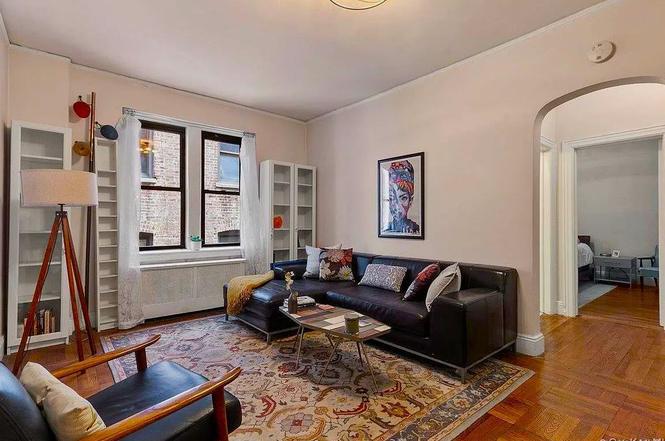
Listing remarks
* TIMELESS CHARM | HIGH CEILINGS | NEW LIGHTING FIXTURES | GRACIOUS ENTRY FOYER | ARCHED DOORWAYS | PICTURE RAIL MOLDING * MOTIVATED SELLER: This bright one-bedroom pre-war co-op is located in a classic, well-maintained, financially sound building and showcases abundant original details throughout. The home features hardwood floors, high ceilings, new lighting fixtures, and four generously sized closets that offer exceptional storage. A gracious entry foyer welcomes you in, while timeless architectural touches such as arched doorways and picture rail molding add warmth and character. Residents enjoy access to a beautiful, tranquil rooftop deck with panoramic views of the George Washington
Key facts
- Rooftop deck
- Fort tryon park
- Bennett park
Tags
Property features AI
Finance
- HOA & community: Managed by Blue Woods Management; Association fees billed monthly
Exterior
- Parking: On-street parking
- Utilities: Public sewer; Public trash collection
- Home design: Stock cooperative; 6-story building; Entry on 4th level
- Construction: Brick exterior
- Exterior features: Brick construction; Not waterfront
Interior
- Kitchen: Gas oven; Gas range; Refrigerator
- Bedrooms: 3 rooms total (includes bedrooms and living areas) — entry level: 4
- Flooring: Hardwood flooring
- Bathrooms: 1 full bathroom
- Heating & cooling: Steam heating; Wall/window air conditioning unit(s)
- Interior features: High ceilings; Common area laundry; Pets allowed
- Laundry & utility: Common area laundry
Neighborhood map
What this means for you Summary
Snapshot
- This is a 1-bed/1.0-bath condo listed at $385k.
Deal economics
- At list price, monthly cash flow is $-284 ($-3k/yr) — negative.
- To cash-flow at today's rent, offer at most $344k (10.7% below list).
- To meet the 1% rule (rent ≥ 1% of price), the offer needs to be $301k (21.9% below list).
- Recommended offer: $301k (21.9% below list) — sets the bar for 1% rule.
- Cap rate 5.4% vs local median 2.6% in New York — top-decile yield for the area; either an underpriced asset or a hidden risk that comps aren't pricing in. Stress-test before assuming the spread holds.
Location & tenants
- Location reads 75/100 on livability (#268 in NY, #4,188 nationally) — a middle-class / working-renter tenant base. Strengths: amenities A+, commute A+, health & safety A; Watch: crime F, cost of living F.
- Market conditions: Rents rising fast (+6.5%/yr); 91 active listings in the ZIP; 7 comparable units currently listed for rent nearby; rentals at typical pace (median 25d on market — plan ~3-4 weeks tenant-placement turnaround); solid renter incomes; 4,467 units permitted in New York County in 2024 (4,463 in 5+ unit buildings).
- At $3,009/mo this rent would consume 48% of the median local household income ($75k/yr) (locally 4751% of renters already pay >50% of income on rent) — very limited rent-growth headroom before tenants either downsize or default.
Forward outlook
- In year one you build about $11k of equity ($3k loan paydown + $8k appreciation (2.2% local appreciation)).
- New York County population projected at +21% by 2050 — long-run rental-demand tailwind backs the buy-and-hold thesis.
- By year 4, paydown + projected appreciation supports a ~$38k cash-out refi (75% LTV) — recoverable capital for the next deal without selling this one.
Negotiation context
- It's been on market 128 days — a 12% lower offer ($339k) is reasonable based on typical stale-listing flexibility.
- 2 sale attempts with the ask held roughly flat each time — persistent listings suggest the price (not the market) is what's stuck; bring a comps-based counter.
Risks & watch-outs
- Watch-outs: built in 1909 — expect roof / HVAC / electrical / plumbing capex.
- Climate carrying-cost: moderate wind risk, 26% chance of damaging wind over 30y; extreme-heat days projected 7→14/yr by 2055 (HVAC capex compounding) — expect insurance premiums to compound above CPI over the hold.
Questions for the listing agent
- What do current leases actually rent for vs. the listed asking? Can we see a recent rent roll and the last 12 months of T-12 income?
- It's been on market 128 days. Have you received any prior offers? Is the seller open to a 22% concession, seller financing, or rate buy-down credit?
- Built in 1909 — when were the roof, HVAC, electrical panel, plumbing, and water heater last replaced?
- Any open or pending special assessments — roof, HVAC, plumbing, elevator, façade? What's the per-unit balance and payoff schedule, and is the seller paying it off at close or rolling it to the buyer?
- Why hasn't it sold? Are there any deal-killer items the seller is aware of (foundation, flood, title, zoning, code violations)?
- Is there a deadline driving the sale (1031 exchange, divorce, estate, relocation)? That informs how much negotiation room exists.
- Schools are B-rated — typically a magnet for longer-tenancy family renters. What's the average tenant stay here, and is there a school-zone premium baked into asking?
- Crime grade is F in this area — have there been break-ins, vandalism, or insurance claims at this property in the last 3 years? What carrier currently insures it and at what premium?
- The area grade is low — what's the realistic commute time and amenity access for the typical tenant pool here? Any planned neighborhood developments (good or bad) we should know about?
- What's the average days-on-market for RENTAL listings here right now (not sales)? A rising rental-DOM trend means longer vacancies and softer asking-rent achievability than the comps imply.
- What's the recent tenant-quality profile in this submarket — average credit score on applications, eviction rate, late-payment / NSF rate, and stable-employment percentage? A property-management company in the area should have these aggregated.
- How much new apartment / multifamily construction is in the pipeline within 1–3 miles? Heavy new supply (>2% of stock underway) typically softens rents 12–24 months out; light construction supports rent growth.
Investment metrics
- 1% rule
- 0.78% ✗
- Cap rate
- 5.41%
- Cash-on-cash
- -3.16%
- DSCR
- 0.86
- GRM
- 10.7
CMA / ARV
No comps found within radius.
Projected returns pro-forma
2.18% appreciation · 6.53% rent growth · sell at horizon
- IRR
- 3.8%
- Equity multiple
- 1.21×
- Total profit
- $23,045
- Equity at exit
- $155,694
- IRR
- 9.3%
- Equity multiple
- 2.37×
- Total profit
- $147,624
- Equity at exit
- $227,190
Cash invested: $107,800 (down + closing). Projections, not guarantees.
Landlord ↔ Tenant lean methodology
- Overall (CITY)
- 0 Strongly Tenant-Friendly
- State New York
- 15 Strongly Tenant-Friendly · D+10
- County
- — inherits STATE
- City New York
- 0 Strongly Tenant-Friendly · D+34
ZIP-level market 10033
- Home prices YoY
- 1.4%
- Rents YoY
- 6.5%
- Active inventory
- 91
- Price-to-rent
- 10.7×
Monthly cashflow live
- Estimated rent
- $3,009 high interval (Pro) →
- Mortgage (P&I)
- −$2,019
- Tax est. 1.5%
- −$481 /mo · $5,775/yr
- Insurance
- −$160
- HOA
- −$0
- Vacancy / Maint / Mgmt
- −$632
- Net cashflow
- $-284
Break-even live
Sensitivity live
| Price | -10% $-18 | -5% $-151 | +0% $-284 | +5% $-417 | +10% $-550 |
|---|---|---|---|---|---|
| Rent | -10% $-521 | -5% $-403 | +0% $-284 | +5% $-165 | +10% $-46 |
| Rate | -1.0pp $-90 | -0.5pp $-186 | base $-284 | +0.5pp $-383 | +1.0pp $-485 |
UW: 25.0% down · 7.5% · 30yr · 1.5% tax · 5.0% vac · 8.0% maint · 8.0% mgmt
Financing live
Cash to close
- Down payment
- $96,250
- Closing costs
- $11,550
- Reserves months
- —
- Total cash needed
- —
Loan-product check · same deal, 3 products live
Conventional
25% down · 7.5% · 30yr
- Down + closing
- —
- Monthly P&I
- —
- Monthly cashflow
- —
- DSCR
- —
- Eligible?
- —
Personal DTI + credit; lowest rate.
DSCR
20% down · 8.5% · 30yr
- Down + closing
- —
- Monthly P&I
- —
- Monthly cashflow
- —
- DSCR
- —
- Eligible?
- —
No personal income docs; deal must DSCR.
Hard money
10% down · 12.0% · 12mo
- Down + closing
- —
- Monthly P&I
- —
- Monthly cashflow
- —
- DSCR
- —
- Eligible?
- —
Short-term bridge; refi at stabilization.
Rent comps 7 comps
| Address | Beds | Baths | Sqft | Rent | $/sqft | DOM | Units | Dist |
|---|---|---|---|---|---|---|---|---|
| 2329 Hudson Ter Fort Lee, NJ | 1.0–2.0 | 1.0 | 750 | $1,795 | $2.39 | 25d | 2 | 1.24mi |
| 2339 Hudson Ter Unit D17 Fort Lee, NJ | 1.0 | 1.0 | 620 | $1,900 | $3.06 | 25d | 1 | 1.28mi |
| 69 Main St Fort Lee, NJ | 2.0 | 1.0–2.0 | 1126 | $3,925 | $3.48 | 25d | 7 | 1.31mi |
| 2100 N Central Rd Fort Lee, NJ | 1.0 | 1.0 | 700 | $4,430 | $6.32 | 2d | 17 | 1.31mi |
| 800 Park Ave Fort Lee, NJ | 3.0 | 1.0–3.0 | 1122 | $5,704 | $5.08 | 1d | 42 | 1.36mi |
| 2040 Hudson St Unit 514 Fort Lee, NJ | — | 1.0 | 590 | $2,358 | $4.00 | 25d | 1 | 1.49mi |
| 2030 Hudson St Fort Lee, NJ | 3.0 | 1.0–2.5 | 1341 | $4,517 | $3.37 | 1d | 1 | 1.49mi |
HOA detail condo
- Monthly dues
- $0 · $0/yr
- Assessments
- None detected in remarks — confirm with the listing agent.
Listing history 13 events
-
2026-06-18days on market $385,000 Active 128 DOM
-
2026-06-17days on market $385,000 Active 127 DOM
-
2026-06-15days on market $385,000 Active 125 DOM
-
2026-06-13days on market $385,000 Active 123 DOM
-
2026-06-10days on market $385,000 Active 119 DOM
-
2026-06-08days on market $385,000 Active 118 DOM
-
2026-06-04days on market $385,000 Active 114 DOM
-
2026-06-03days on market $385,000 Active 113 DOM
-
2026-06-01days on market $385,000 Active 111 DOM
-
2026-05-31days on market $385,000 Active 110 DOM
-
2026-03-31price $385,000
-
2026-03-05status Active
-
2026-01-24$395,000 Active
ⓘ Source: listings_history table (triggers on properties + properties_extension) + one-shot
backfill from property_details.listing_events for pre-trigger history.
Climate risk First Street
- Flood 1/10 Low FEMA zone X (unshaded) · 0% chance over 30 yrs
- Wildfire 1/10 Low
- Heat 6/10 Major 7 d/yr ≥99°F today · 14 d/yr by 30 yrs out
- Wind 5/10 Major 26% chance of damaging wind over 30 yrs
- Air quality 3/10 Moderate 3 unhealthy d/yr today · 4 by 30 yrs out
Nearby sold comps map
Loading sold comps map…
Walkable amenities ~0.75 mi
Loading nearby amenities…
Taxation est. · year 1
- Rental income
- $36,105
- − Mortgage interest
- −$21,566
- − Property taxes
- −$5,775
- − Insurance
- −$1,925
- − Repairs & maintenance
- −$2,888
- − Management
- −$2,888
- − Depreciation
- −$11,200
- Taxable loss
- −$10,138
- Est. tax savings @ 24.0%
- +$2,433
- After-tax cash flow
- $-972/yr
For passive investors: Depreciation is non-cash, so a rental often shows a tax loss while cash-flowing — sheltering income. Rental losses are passive: they offset passive income freely, and up to $25,000/yr can offset ordinary (W-2) income if you actively participate and your MAGI is under $100k (phasing out to $0 by $150k); unused losses carry forward. On sale, claimed depreciation is recaptured at up to 25%, and gains may owe capital-gains tax (a 1031 exchange can defer both). Figures are a year-1 estimate at your 24.0% rate — not tax advice; consult a CPA.
Schools (NCES district)
No district data.
Livability — New York
- Score
- 75/100
- State rank
- #268
- US rank
- #4188
Category grades
Schools grade is shown separately in the Schools card above.
Census & demographics
- Census place
- New York, NY
- County
- New York County · 1,599,927 people
- City population
- 7,731,280
- Metro
- New York-Newark-Jersey City, NY-NJ-PA
- Population (ZIP)
- 54,838
- Household income
- $75,040
- Rent vs Own
- Severe rent burden
- 4751.0
Population outlook (New York County) Hauer SSP2
- Today (2025)
- 1,825,725 people
- By 2030
- 1,904,611 · +4.3%
- By 2040
- 2,052,719 · +12.4%
- By 2050
- 2,206,601 · +20.9%
- By 2075
- 2,509,427 · +37.4%
- By 2100
- 2,702,933 · +48.0%
Race, ethnicity, and origin ACS 2023
- Neighborhood character
- Majority Hispanic (63%)
- Race & ethnicity
- Hispanic / Latino 63% White 27% Two or more races 20% Black 4% Asian 3% Native American 2%
- Hispanic origin (detail)
- Mexican 3% Puerto Rican 4% Cuban 3% Dominican 39%
- Common ancestry
- Scotch-Irish 2% Romanian 2% Lithuanian 1%
- Foreign-born
- 41% · Canada, China, Jamaica
- Languages at home
- 36% English-only · Spanish 56% Russian/Polish/Slavic 2% Other Indo-European 2%
Political lean MEDSL · New York
- 2024 margin
- Solid D (+64.8) · D 82.4% · R 17.6%
- 2008→2024 swing
- -7.4pp toward R · 2008: 72.2pp · 2024: 64.8pp
- All cycles
- 2024: D+64.8 2020: D+74.5 2016: D+77.2 2012: D+69.6 2008: D+72.2
Not yet ingested
- Civics
- —
Market trends
- HPI YoY
- ▲ 2.18%
- Current HPI
- 164.3121
- Rent YoY
- ▲ 6.53%
- Metro
- New York-Newark-Jersey City, NY-NJ-PA
- State GDP YoY
- ▲ 2.60%
- F500 in state
- 92
Industry mix (Fortune 500 HQ in NY)
| Industry | F500 HQs | Revenue |
|---|---|---|
| Financial Services | 10 | $950B |
|
||
| Consumer Goods | 9 | $162B |
|
||
| Insurance | 4 | $225B |
|
||
| Telecommunications | 2 | $144B |
|
||
| Pharmaceuticals | 2 | $112B |
|
||
| Media / Entertainment | 2 | $69B |
|
||
Price history
-2.5% since first listed3 events — show timeline
- 2026-03-31 Price Changed $385,000 OneKey® MLS as Distributed by MLS Grid
- 2026-03-05 Relisted — OneKey® MLS as Distributed by MLS Grid
- 2026-01-24 Listed $395,000 OneKey® MLS as Distributed by MLS Grid
Cash-flow waterfall
monthlySold comps — $/sqft
last 12 mo · ≤1 miLoading sold comps…